Transposase-assisted tagmentation of RNA/DNA hybrid duplexes

  1. Bo Lu
  2. Liting Dong
  3. Danyang Yi
  4. Meiling Zhang
  5. Chenxu Zhu
  6. Xiaoyu Li
  7. Chengqi Yi  Is a corresponding author
  1. State Key Laboratory of Protein and Plant Gene Research, School of Life Sciences, Peking University, China
  2. Peking-Tsinghua Center for Life Sciences, Peking University, China
  3. Department of Chemical Biology and Synthetic and Functional Biomolecules Center, College of Chemistry and Molecular Engineering, Peking University, China

Abstract

Tn5-mediated transposition of double-strand DNA has been widely utilized in various high-throughput sequencing applications. Here, we report that the Tn5 transposase is also capable of direct tagmentation of RNA/DNA hybrids in vitro. As a proof-of-concept application, we utilized this activity to replace the traditional library construction procedure of RNA sequencing, which contains many laborious and time-consuming processes. Results of Transposase-assisted RNA/DNA hybrids Co-tagmEntation (termed ‘TRACE-seq’) are compared to traditional RNA-seq methods in terms of detected gene number, gene body coverage, gene expression measurement, library complexity, and differential expression analysis. At the meantime, TRACE-seq enables a cost-effective one-tube library construction protocol and hence is more rapid (within 6 hr) and convenient. We expect this tagmentation activity on RNA/DNA hybrids to have broad potentials on RNA biology and chromatin research.

Introduction

Transposases exist in both prokaryotes and eukaryotes and catalyze the movement of defined DNA elements (transposon) to another part of the genome in a ‘cut and paste’ mechanism (Kleckner, 1981; Finnegan, 1989; Curcio and Derbyshire, 2003). Taking advantage of this catalytic activity, transposases are widely used in many biomedical applications: for instance, an engineered, hyperactive Tn5 transposase from E. coli can bind to synthetic 19 bp mosaic end-recognition sequences appended to Illumina sequencing adapters (termed ‘Tn5 transposome’) (Adey et al., 2010) and has been utilized in an in vitro double-stranded DNA (dsDNA) tagmentation reaction (namely simultaneously fragment and tag a target sequence with sequencing adaptors) to achieve rapid and low-input library construction for next-generation sequencing (Adey et al., 2010; Goryshin and Reznikoff, 1998; Picelli et al., 2014a; Caruccio, 2011; Ramsköld et al., 2012; Gertz et al., 2012). In addition, Tn5 was also used for in vivo transposition of native chromatin to profile open chromatin, DNA-binding proteins and nucleosome position (‘ATAC-seq’) (Buenrostro et al., 2013). While Tn5 has been broadly adopted in high-throughput sequencing, bioinformatic analysis and structural studies reveal that it belongs to the retroviral integrase superfamily that act on not only dsDNA but also RNA/DNA hybrids (for instance, RNase H). Despite the distinct substrates, these proteins all share a conserved catalytic RNase H-like domain (Figure 1a; Yang and Steitz, 1995; Savilahti et al., 1995; Nowotny, 2009; Rice and Baker, 2001). Given their structural and mechanistic similarity, we attempted to ask whether or not Tn5 is able to catalyze co-tagmentation reactions to both the RNA and DNA strands of RNA/DNA hybrids (Figure 1b), in addition to its canonical function of dsDNA transposition. In this study, we tested this hypothesis and found that indeed Tn5 possesses in vitro tagmentation activity towards both strands of RNA/DNA hybrids. As a proof of concept, we apply such Transposase-assisted RNA/DNA hybrids Co-tagmEntation (TRACE-seq) to achieve rapid and low-cost RNA sequencing starting from total RNA extracted from 10,000 to 100 cells. We find that TRACE-seq performs well when compared with conventional RNA-seq methods in terms of detected gene number, gene expression measurement, library complexity, GC content and differential expression analysis, although TRACE-seq shows bias in gene body coverage and is not strand-specific. At the same time, it avoids many laborious and time-consuming steps in traditional RNA-seq experiments. Such Tn5-assisted tagmentation of RNA/DNA hybrids could have broad applications in RNA biology and chromatin research.

Figure 1 with 1 supplement see all
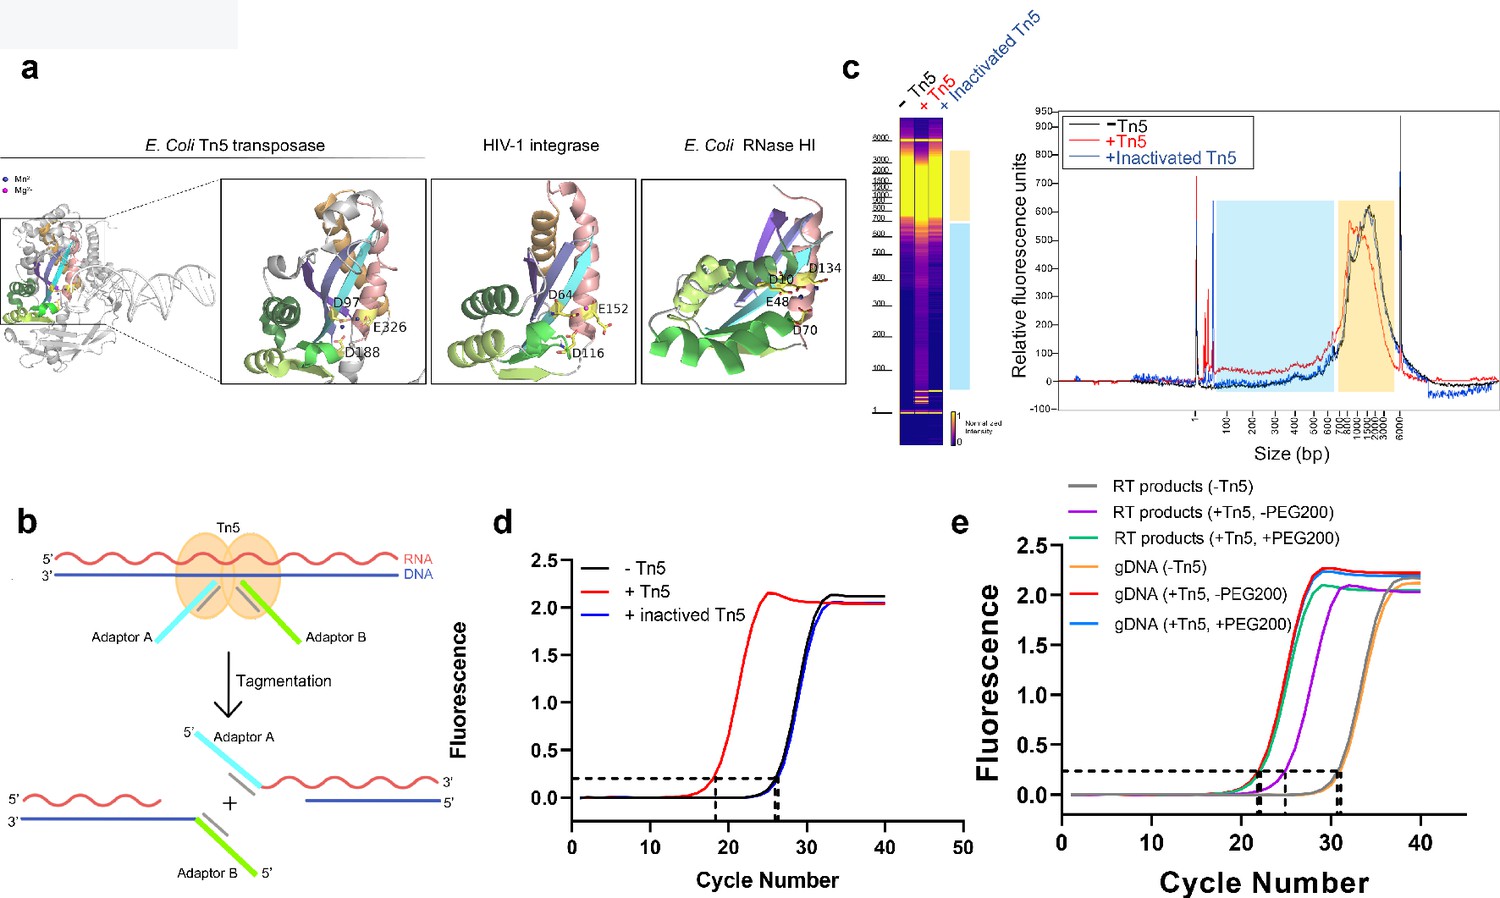
Tn5 transposome has direct tagmentation activity on RNA/DNA hybrid duplexes.

(a) Crystal structure of a single subunit of E. coli Tn5 Transposase (PDB code 1MM8) complexed with ME DNA duplex, and zoom-in views of the conserved catalytic core of Tn5 transposase, HIV-1 integrase (PDB code 1BIU), and E. coli RNase HI (PDB code 1G15), all of which are from the retroviral integrase superfamily. Active-site residues are shown as sticks, and the Mn2+ and Mg2+ ions are shown as deep blue and magenta spheres. (b) Schematic of Tn5-assisted tagmentation of RNA/DNA hybrids. (c) Gel pictures (left) and peak pictures (right) represent size distributions of HEK293T mRNA-derived RNA/DNA hybrid fragments after incubation without Tn5 transposome, with Tn5 transposome, and with inactivated Tn5 transposome. The blue and orange patches denote small and large fragments, respectively. (d) qPCR amplification curve of tagmentation products of HEK293T mRNA-derived RT samples with Tn5 treatment, with inactivated Tn5 treatment, or without Tn5 treatment. Average Ct values of two technical replicates are 18.06, 26.25 and 26.41, respectively. (e) qPCR amplification curve of tagmentation products of HEK293T mRNA-derived RT products samples and gDNA samples under different conditions. (Average Ct values of three technical replicates: RT products sample without Tn5 treatment = 30.38; RT products sample with PEG200 = 21.94; RT products sample without PEG200 = 25.23; gDNA sample without Tn5 treatment = 30.71; gDNA sample with PEG200 = 21.15; gDNA sample without PEG200 = 21.19).

Figure 1—source data 1

qPCR Ct values of tagmentation products of samples under different conditions in Figure 1d and e.

https://cdn.elifesciences.org/articles/54919/elife-54919-fig1-data1-v2.xlsx

Results

To test whether Tn5 transposase has tagmentation activity on RNA/DNA hybrids, we prepared RNA/DNA duplexes by performing mRNA reverse transcription. We first validated the efficiency of reverse transcription and the presence of RNA/DNA duplexes using a model mRNA sequence (IRF9,~1000 nt) as template (Figure 1—figure supplement 1a). We then subjected the prepared RNA/DNA hybrids from 293T mRNA to Tn5 transposome, heat-inactivated Tn5 transposome and a blank control (without Tn5), respectively (see Methods). The hybrids were then recovered and their length distribution was analyzed by Fragment Analyzer (Figure 1c). Comparing with the heat-inactivated Tn5 sample or the blank control sample, the Tn5 transposome sample exhibited a modest but clear smear signal corresponding to small fragments ranging from ~30–650 base-pair (bp) (the blue patches in Figure 1c). Consistent with the fragmentation event, we also observed a down shift of large fragments ranging from ~700–4000 bp (the orange patches in Figure 1c). In addition, the fragmentation efficiency increased in a dose-dependent manner with the transposome, suggesting that fragmentation of RNA/DNA hybrids is dependent on Tn5 (Figure 1—figure supplement 1b).

We next asked whether RNA/DNA hybrids are tagged by Tn5 and performed quantitative polymerase chain reaction (qPCR) quantification for the three samples. We observed that cycle threshold (Ct) value of the Tn5 transposome sample is about eight cycles smaller than the heat inactivated Tn5 sample or the control sample, indicating approximately 256 times more amplifiable products (Figure 1d). We also tested different buffer conditions and found that the performance of Tn5 remained similar, indicating the robustness of the Tn5 tagmentation activity (Figure 1—figure supplement 1c). Using Sanger sequencing, we validated that the adaptor sequences are indeed ligated to the insert sequences (Figure 1—figure supplement 1d).

To compare Tn5 tagmentation efficiency between RNA/DNA hybrids and dsDNA, we performed tagmentation and qPCR on equal amount of mRNA RT products and genomic DNA (gDNA). Average Ct value of the hybrids samples was about four cycles more than gDNA samples, indicating the efficiency of Tn5 toward hybrids is about 1/16 of that of dsDNA (Figure 1e). It is known that natural RNA/DNA hybrids favor A-form conformation. Interestingly, in the presence of PEG200, hybrids were found to favor B-form conformation (Pramanik et al., 2011), which we expected to make the hybrids a better substrate of Tn5. Indeed, addition of PEG200 diminishes this difference by greatly improving the Tn5 tagmentation efficiency towards hybrids (Figure 1e). This result indicates that the conformation of substrates certainly affects the preference of Tn5. We also ruled out the possibility of gDNA contamination in RT products (Figure 1—figure supplement 1e). Taken together, under optimized conditions, Tn5 shows significantly improved efficiency towards RNA/DNA hybrids.

As reverse transcriptase could produce dsDNA from RNA/DNA hybrids, we next designed an experiment by eliminating the RT component and directly assess tagmentation activity using annealed RNA/DNA hybrids where no dsDNA is possible. We annealed in vitro transcribed and purified ssRNA (CLuc, 150 nt, GC% = 51%) with chemically synthesized complementary ssDNA. We confirmed the successful production and purity of the RNA/DNA hybrids by dot-blot assay and native-PAGE (Figure 1—figure supplement 1f and g). A 8-cycle difference between Tn5 transposome sample (Ct = 22.68) and the control sample (Ct = 30.40) was reproducibly observed (Figure 1—figure supplement 1h). As a positive control, we also annealed two complementary ssDNA strands of the same 150bp-CLuc sequence to produce dsDNA and observed that a Ct value of 18.08 for the dsDNA sample (Figure 1—figure supplement 1h). While it is unclear this difference in tagmentation efficiency obtained from short oligos can be applied to long oligos, this result clearly demonstrates that Tn5 has a direct tagmentation activity towards RNA/DNA hybrids.

Having demonstrated the tagmentation activity of Tn5 on RNA/DNA hybrids, we then thought about its potential applications. RNA/DNA duplexes can be found in many in vivo scenarios, including but not limited to R-loop and chromatin-bound lncRNAs (Santos-Pereira and Aguilera, 2015; Li and Fu, 2019). Under in vitro conditions, RNA/DNA hybrids are also key intermediates in various molecular biology and genomics experiments. For instance, RNA has to be first reverse transcribed into cDNA in a traditional RNA-seq experiment so as to construct a library for sequencing. Because traditional RNA-seq library construction involves many laborious and time-consuming steps, including mRNA purification, fragmentation, reverse transcription, second-strand synthesis, end-repair and adaptor ligation, we attempted to replace the process using the tagmentation activity towards RNA/DNA duplexes. With the help of TRACE-seq, these steps are replaced with a ‘one-tube’ protocol (Figure 2a), which uses total RNA as input material and involves just three seamless steps (reverse transcription, tagmentation and strand extension and PCR), without the need for a second strand synthesis step. We first conducted TRACE-seq with 200 ng total RNA as input and tested several enzymes and conditions (Supplementary file 1); we observed very high correlation in gene-expression levels among three replicates, indicating TRACE-seq is highly reproducible (Figure 2b). To test the robustness of TRACE-seq, we performed the experiments with 20 ng and 2 ng total RNA. TRACE-seq results are again highly reproducible among replicates (Figure 2—figure supplement 1a,b). More importantly, gene expression levels measured using different amount of starting materials remain consistent with each other (Figure 2c).

Figure 2 with 1 supplement see all
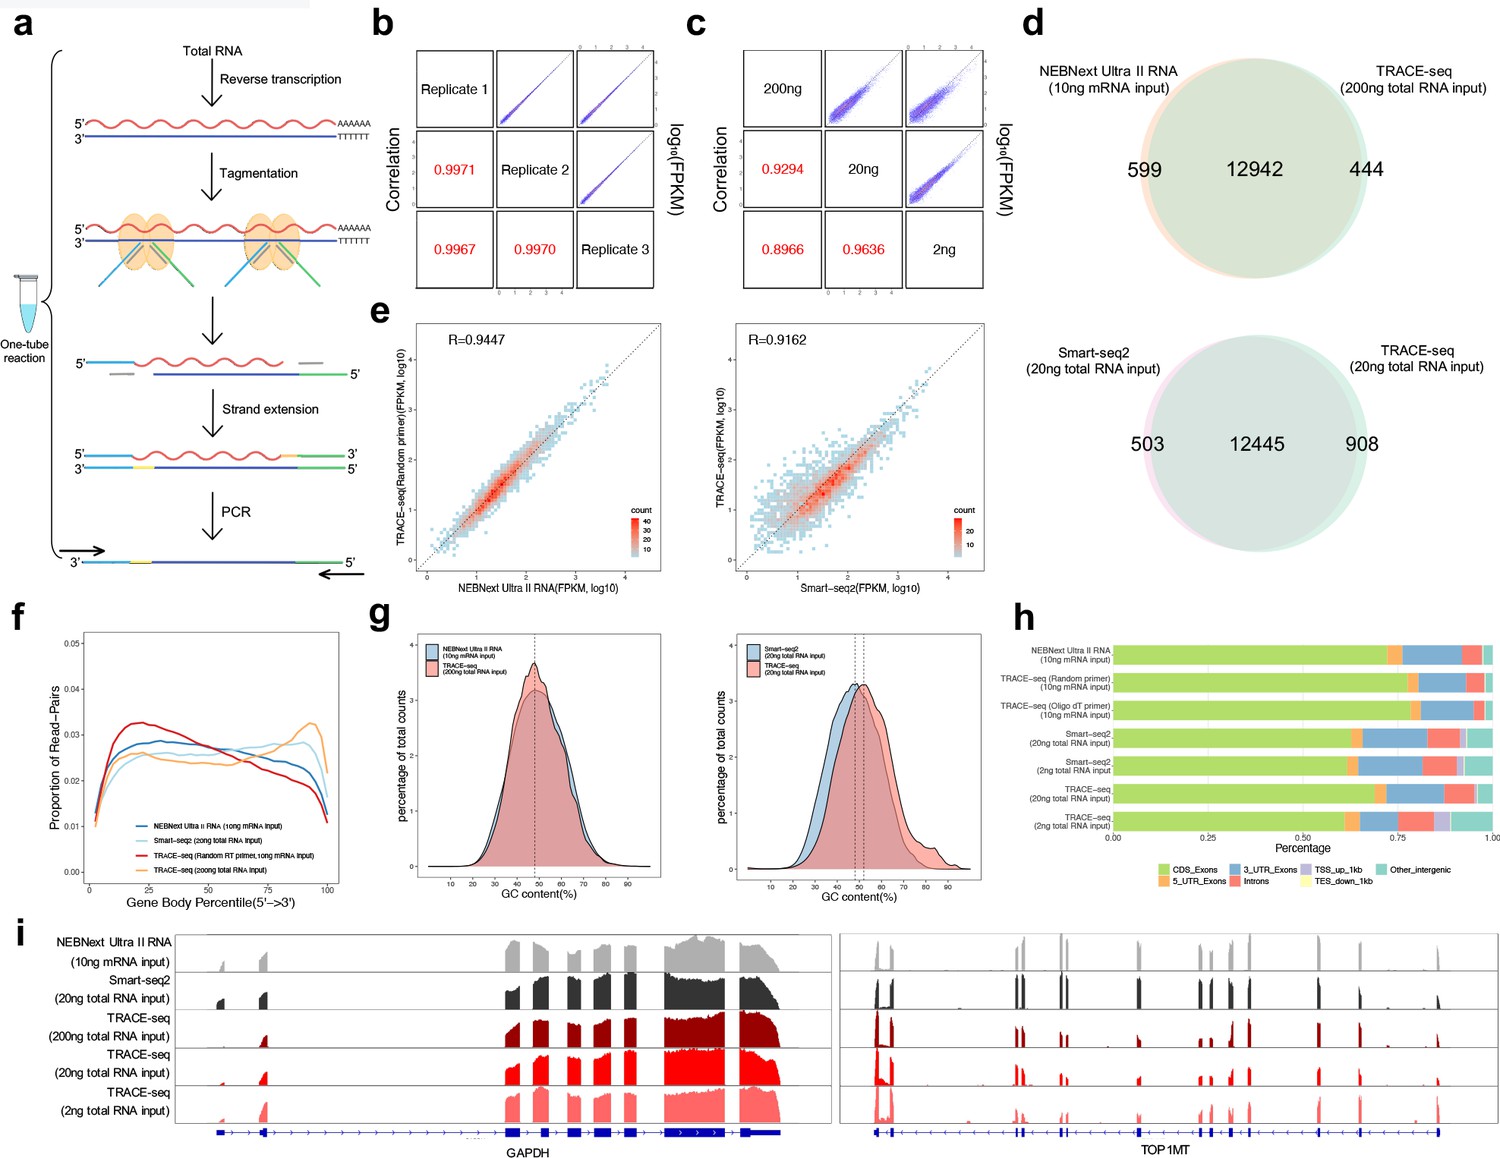
Workflow and evaluation of TRACE-seq.

(a) Workflow of TRACE-seq. (b) Gene expression, measured by three technical replicates of TRACE-seq with 200 ng total RNA as input, are shown as scatter plots in the upper right half. Pearson's product-moment correlations are displayed in the lower left half. (c) Gene expression, measured by TRACE-seq using 200 ng, 20 ng and 2 ng total RNA as input, are shown as scatter plots in the upper right half. Pearson's product-moment correlations are displayed in the lower left half. (d) Venn diagrams of gene numbers detected by TRACE-seq with 200 ng total RNA as input and NEBNext Ultra II RNA kit with 200 ng mRNA as input (top) and by TRACE-seq with 20 ng total RNA as input and Smart-seq2 with 20 ng mRNA as input (below). (e) Scatterplots showing a set of housekeeping gene expression values for TRACE-seq and NEBNext Ultra II RNA kit with 10 ng mRNA as input (left), and for TRACE-seq with 10 ng mRNA as input and Smart-seq2 with 20 ng total RNA as input (right). Pearson's product-moment correlation is displayed in the upper left corner. (f) Comparison of read coverage over gene body for NEBNext Ultra II RNA kit, Smart-seq2 and TRACE-seq with different amount of RNA as input. The read coverage over gene body is displayed along with gene body percentile from 5’ to 3’ end. (g) Distribution of GC content of all mapped reads from TRACE-seq library with 200 ng total RNA as input and NEBNext Ultra II RNA library with 10 ng mRNA as input (left) or Smart-seq2 library with 20 ng total RNA as input (right). The vertical dashed lines indicate 48% (left) and 48% and 51% respectively (right). (h) Comparison of the distribution of reads across known genome features for NEBNext Ultra II RNA kit, Smart-seq2 and TRACE-seq with different amount of RNA as input. (i) IGV tracks showing the coverage of two representative transcripts (GAPDH and TOP1MT). The data come from NEBNext Ultra II RNA kit, Smart-seq2 and three sets of TRACE-seq with different amount of total RNA as input.

Figure 2—source data 1

Distribution of reads across known genome features for NEBNext Ultra II RNA kit, Smart-seq2 and TRACE-seq with different amount of RNA as input.

https://cdn.elifesciences.org/articles/54919/elife-54919-fig2-data1-v2.xls

We then compared the library quality between TRACE-seq and NEBNext Ultra II RNA library prep kit, a commonly used kit for RNA-seq library construction. In addition, we conducted a comparison to Smart-seq2, which is a similar method in its use of oligo(dT) primed cDNA synthesis and Tn5 tagmentation. The HEK293T RNA used in these libraries was all from the same batch of cells. We found that TRACE-seq libraries exhibited similar percentage of reads mapped to annotated transcripts, rRNA contamination and gene numbers to NEBNext data when mRNA was used as input, but a higher rRNA contamination when total RNA was used as input (~9%, Supplementary file 2). In addition, a similar percentage of rRNA contamination was also observed in Smart-seq2 libraries (Supplementary file 3). Most of the genes detected by TRACE-seq overlap with that of NEBNext and Smart-seq2 (Figure 2d). In addition, TRACE-seq showed comparable performance in terms of gene expression measurement, using either a set of housekeeping genes (Figure 2e) or all genes (Figure 2—figure supplement 1c). The insert size of TRACE-seq library was moderately shorter (Figure 2—figure supplement 1d); in the meanwhile, TRACE-seq shows a higher coefficient of variation of gene coverage (0.54–0.70 vs 0.42–0.44, Figure 2—figure supplement 1e). We further found that TRACE-seq showed a slight tendency to 3’ end of the gene body (Figure 2f, Figure 2—figure supplement 1f). When transcripts were grouped according to annotated lengths, we found comparable gene body coverage for transcripts shorter than 1 kb among TRACE-seq, NEBNext kit and Smart-seq2 libraries. For transcripts with length between 1 and 4 kb, a slight 3’ end bias was observed in TRACE-seq library, while for transcripts longer than 4 kb, the central regions of transcripts were less covered by both TRACE-seq and Smart-seq2. We also performed TRACE-seq by using rRNA depletion together with random-primed cDNA synthesis. While this solved the 3’ end bias, a 5’ end bias appeared, which is a common phenomenon when using random primers during reverse transcription (Figure 2—figure supplement 1f). In spite of the gene body coverage bias, GC content (Figure 2g) and library complexity (Figure 2—figure supplement 1g) are unnoticeably affected. In addition, the gene expression measurement (Figure 2e) is also unaffected here because of the use of RNA with high quality (RIN: 9.5, Figure 2—figure supplement 1h); yet, cautions might be taken when the quality of RNA is compromised. Further inspection of reads distribution of TRACE-seq over genome features revealed similar pattern for that of NEBNext and Smart-seq2 (Figure 2h). Coverages of some representative transcripts are shown in Figure 2i.

One of the most important goals of RNA-seq is to detect differentially expressed genes among different samples. Having assessed the library quality of TRACE-seq, we next compared the performance of TRACE-seq in detecting differentially expressed genes between undifferentiated and differentiated mESCs to NEBNext Ultra II RNA library prep kit. As shown in Figure 3a, TRACE-seq successfully detected 4577 differentially expressed genes (3264 up-regulated genes and 1313 down-regulated genes), while NEBNext detected 4452 differentially expressed genes (3157 up-regulated genes and 1295 down-regulated genes). The overlapping gene number is 4,071, showing very high consistency between methods (Figure 3b). Besides, the fold change of the 4071 overlapping genes is highly correlated between the two methods (R > 0.99, Figure 3c). Therefore, TRACE-seq shows excellent performance in differential gene expression analysis.

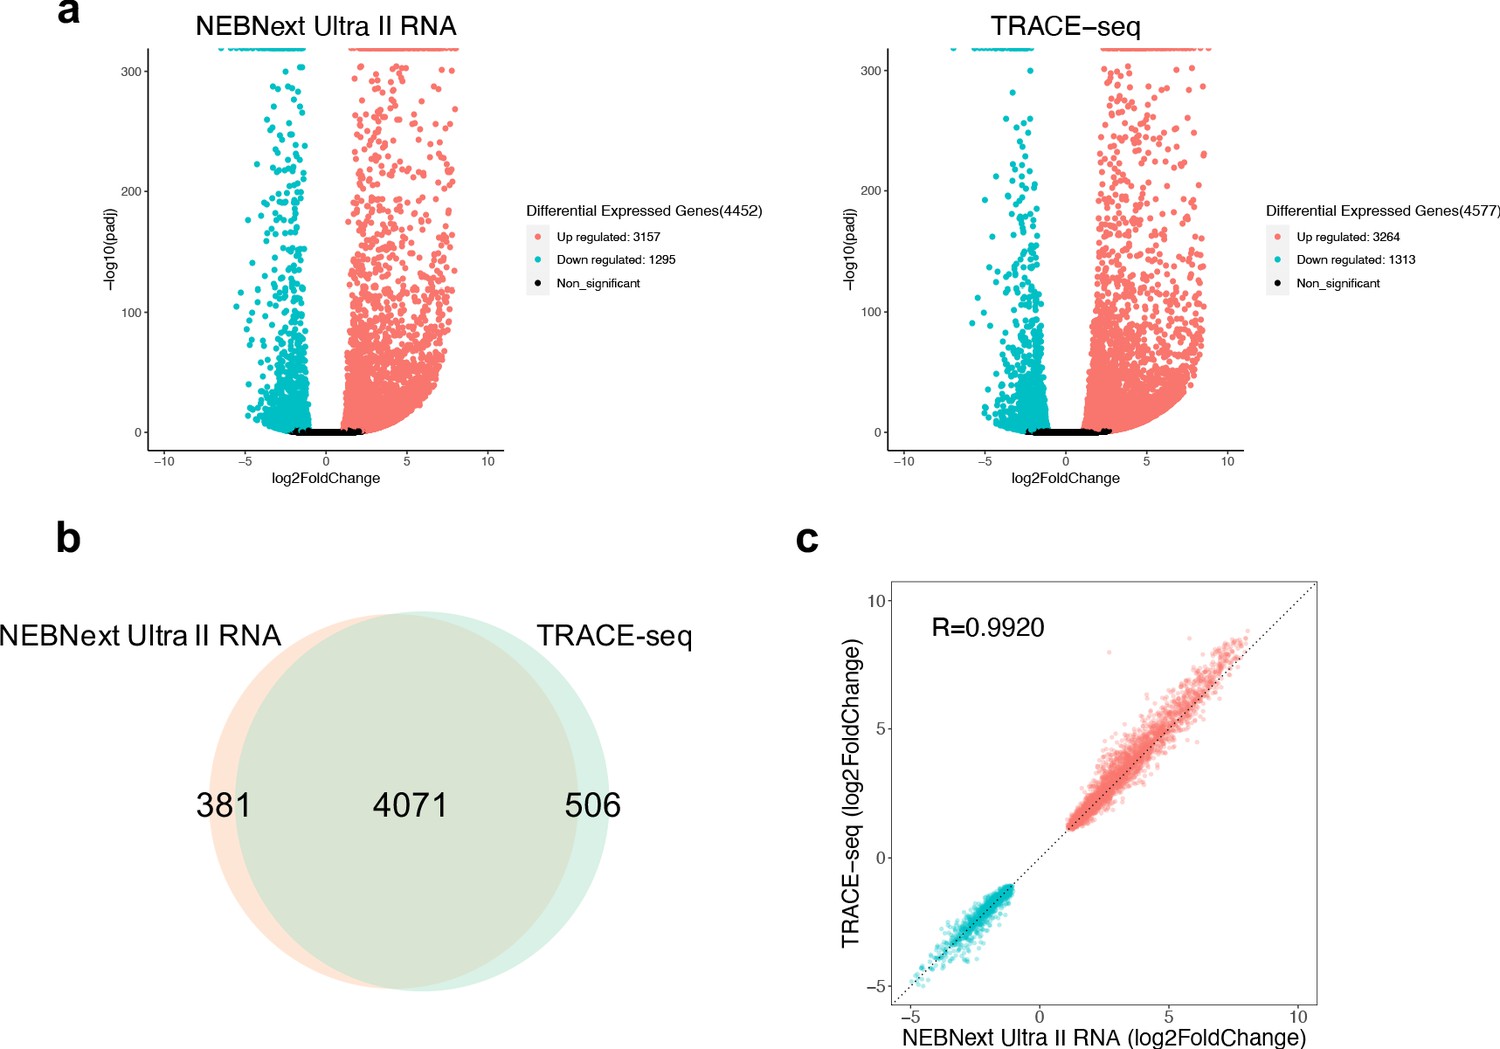
Performance of TRACE-seq in differential expression analysis.

(a) Volcano plot showing differential expressed genes between undifferentiated and differentiated mESCs detected by NEBNext Ultra II RNA kit and TRACE-seq. Significantly up-regulated and down-regulated expressed genes (padj <0.05, |log2FoldChage| > 1) are highlighted in red and blue, respectively. (b) Venn diagram of differentially expressed gene numbers detected by TRACE-seq and NEBNext Ultra II RNA kit. (c) Correlation between the fold change of the 4071 differentially expressed genes that overlap between NEBNext Ultra II RNA and TRACE-seq library.

Previous studies found that Tn5 exhibits a slight insertion bias on dsDNA substrates (Goryshin et al., 1998; Green et al., 2012; Lodge et al., 1988). To further investigate whether potential bias exists for TRACE-seq, we thus characterized sites of Tn5-catalyzed adaptor insertion by calculating nucleotide composition of the first 30 bp of each sequence read per library. Similar to dsDNA substrates, we also observed an apparent insertion signature on RNA/DNA hybrids (Figure 2—figure supplement 1i). Nevertheless, per-position information contents were extremely low, suggesting such insertion bias is less likely to affect gene body coverage (Figure 2—figure supplement 1j). Overall, in spite of gene body coverage bias, TRACE-seq allows construction of high complexity RNA libraries and demonstrates similar performance as traditional RNA library preparation methods in terms of detected genes (97% and 93% overlapped with NEBNext and Smart-seq2 library respectively), gene expression measurement (R > 0.90) and differential expression analysis (R > 0.99), but outcompetes the traditional methods in terms of speed, convenience and cost.

Discussion

Based on substrate diversity and the conserved catalytic domain of the retroviral integrase superfamily including the Tn5 transposase, we envision in this study that Tn5 may be able to directly tagment RNA/DNA hybrid duplexes, in addition to its canonical dsDNA substrates. Having validated such in vitro tagmentation activity, we developed TRACE-seq, which enables one-tube, low-input and low-cost library construction for RNA-seq experiments and demonstrates excellent performance in DE analysis. Compared to conventional RNA-seq methods, TRACE-seq does not need to pre-extract mRNA and synthesize a second DNA chain after mRNA reverse transcription. Therefore, TRACE-seq bypasses laborious and time-consuming processes, is compatible with low input, and reduces reagent cost (Supplementary file 4). During the preparation of this paper, an independent study also reported the similar finding and developed a RNA-seq method named SHERRY (Di et al., 2020). The major conclusions are very consistent between the two studies.

Despite its unique advantages, there is room to further improve TRACE-seq. For instance, the libraries generated by TRACE-seq in its current form are not strand-specific, which is a significant drawback for RNA-Seq experiments. Yet, TRACE-seq should be able to be converted to 5’ RNA-seq or 3’ RNA-seq, which can directionally preserve the 5’ or 3’ end information of transcripts (Cole et al., 2018; Pallares et al., 2020). In addition, TRACE-seq could be used in multiplex profiling when utilizing Tn5 transposase containing barcoded adaptors (Cusanovich et al., 2015; Zhu et al., 2019). Besides, if home-made Tn5 can be used (as have done in Picelli et al., 2014a; Kia et al., 2017; Kaya-Okur et al., 2019), the costs will be further cut down. The in vitro tagmentation efficiency of Tn5 on RNA/DNA hybrids could also be further improved. We have shown that the addition of PEG200 substantially enhanced the tagmentation efficiency of hybrids. It is also tempting to speculate that hyperactive mutants towards RNA/DNA hybrids could also be obtained through screening and protein engineering, as wild-type Tn5 transposase has been engineered to obtain hyperactive forms (Goryshin and Reznikoff, 1998; Wiegand and Reznikoff, 1992; Weinreich et al., 1994; Zhou and Reznikoff, 1997). Such hyperactive mutants are expected to have immediate utility in single-cell RNA-seq experiments, for instance. Moreover, Tn5 transposition in vivo has been harnessed to profile chromatin accessibility in ATAC-seq (Buenrostro et al., 2013); it remains to be seen whether or not an equivalent version may exist to enable in vivo detection of R-loop, chromatin bound long non-coding RNA and epitranscriptome analysis (Santos-Pereira and Aguilera, 2015; Li and Fu, 2019; Li et al., 2016; Song et al., 2020). To summarize, TRACE-seq manifests a ‘cryptic’ activity of the Tn5 transposase as a powerful tool, which may have broad biomedical applications in the future.

Materials and methods

Cell culture

Request a detailed protocol

HEK293T cells (RRID:CVCL_1926) used in this study were daily maintained in DMEM medium (GIBCO) supplemented with 10% FBS (GIBCO) and 1% penicillin/streptomycin (GIBCO) at 37°C with 5% CO2. We have confirmed no mycoplasma contamination using TransDetect PCR Mycoplasma Detection Kit (TransGen).

Nucleic acids isolation

Request a detailed protocol

Total RNA was extracted from cells with TRIzol (Invitrogen), according to the manufacturer’s instructions. The resulting total RNA was treated with DNase I (NEB) to avoid genomic DNA contamination. Phenol/chloroform extraction and ethanol precipitation were then performed to purify and concentrate total RNA. For mRNA isolation, two successive rounds of poly(A)+ selection were performed using oligo(dT)25 dynabeads (Invitrogen). Genomic DNA (gDNA) from HEK293T cells was purified using genomic DNA purification kit (Qiagen) according to the manufacturer’s instructions.

RNA integrity number (RIN) assessment

Request a detailed protocol

Assessment of RNA integrity was performed with RNA 6000 Pico kits (Agilent Technologies). HEK293T total RNA sample was analyzed by Agilent 2100 Bioanalyzer (Agilent Technologies), and RIN was calculated using the supplied 2100 software.

Preparation of RNA/DNA hybrids

Request a detailed protocol

A model mRNA (IRF9,~1000 nt) was in vitro transcribed from PCR products and purified by urea-PAGE. The model mRNA, HEK293T total RNA and mRNA were reverse transcribed into RNA/DNA hybrids by SuperScript IV reverse transcriptase (Invitrogen), according to the manufacturer’s protocol, with several modifications: 1) Instead of oligo d(T)20 primer, oligo d(T)23VN primer (NEB) was annealed to template RNA; 2) Instead of SS IV buffer, SS III buffer supplemented with 7.5% PEG8000 was added to the reaction mixture; 3) The reaction was incubated at 55°C for 2 hr. To test the presence of RNA/DNA hyrids, IRF9 RT products were treated by DNase I (NEB) and RNase H (NEB) respectively according to the manufacturer’s instructions followed by urea-PAGE analysis.

To generate the 150 bp RNA/DNA hybrid, the CLuc DNA template used for in vitro transcription (5’-TTAGCTTCACAGGAAGTTGGAACTGTGTTTGGTGGATCAGGTTCGTAAGGACAGTCCTGGCAATGAACAGTGGCGCAGTAGACTAATGCAACGGCAAGAATTAAGGTCTTCATGGTGGCGGATCCGAGCTCGGTACCAAGCTTGGGTCTC-3’) was first amplified by PCR from CLuc Control plasmid (NEB) with forward primer (5’-TAATACGACTCACTATAGGG-3’) and reverse primer (5’-TTAGCTTCACAGGAAGTTGG-3’). RNA was produced from CLuc DNA template using in vitro transcription reaction by MAXIscript T7 Transcription Kit (Invitrogen). The resulting 150 nt RNA was treated by DNase I (NEB) and further purified by 6% urea-PAGE. Annealing between the purified in-vitro transcribed RNA and the synthesized complementary CLuc ssDNA sequence was conducted under two different conditions. 400 ng and 240 ng RNA was annealed with 200 ng DNA in group 1 and 2 respectively in the annealing buffer (50 mM Tris–HCl pH 7.6, 250 mM NaCl and 5 mM EDTA). The samples were first incubated for 5 min at 94°C and then cooled down slowly (1°C per minute) to room temperature. The annealed products were then purified using 2.2X Agencourt RNAClean XP beads (Beckman Coulter).

Preparation of annealed dsDNA

Request a detailed protocol

To generate a 150 bp dsDNA, two complementary ssDNA strands were chemically synthesized and purified by 10% urea-PAGE. The resulting forward and reverse ssDNA strands were annealed under two different conditions. 400 ng and 240 ng forward ssDNA was annealed with 200 ng reverse ssDNA in group 1 and 2 respectively in the same annealing buffer as above. The annealing and purification procedure were performed as above.

Characterization of 150 bp RNA/DNA hybrids by PAGE and Dot blot

Request a detailed protocol

The presence of RNA/DNA hybrids in the CLuc annealed products were confirmed by dot blot assay. Nitrocellulose membrane (Amersham Hybond-N+, GE) was marked and spotted with mRNA RT products, 150 bp CLuc annealed products and 150 bp dsDNA (negative control). The membrane was air dried for 5 min before UV-crosslink (2X auto-crosslink, 1800 UV Stratalinker, STRATAGENE). After crosslinking, the membrane was blocked by 5% non-fat milk in 1X TBST at room temperature for 1 hr. Then the membrane was incubated with anti-hybrid S9.6 antibody (Kerafast, #ENH001, RRID:AB_2687463, 1:2000 dilution in 5% milk) for 1 hr at room temperature, followed by washing three times with 1X TBST. Lastly, the membrane was incubated with HRP linked anti-mouse secondary antibody (CWBiotech, RRID:AB_2736997) for 1 hr at room temperature. Signals were detected with ECL Plus Chemiluminescent reagent (Thermo Pierce).

The purity of RNA/DNA hybrids in the 150 bp CLuc annealed products were confirmed by 10% native-PAGE. Samples were loaded in an equal volume of native loading buffer (30% (v/v) glycerol, 80 mM HEPES-KOH (pH 7.9), 100 mM KCl, 2 mM magnesium acetate) and electrophoresed in 0.5 X TBE buffer at 180 V for 1.5 hr.

gDNA contamination detection qPCR experiments were performed to assess potential gDNA contamination. After DNase treatment, RNA samples were subjected to reverse transcription (RT). Two other groups (without RT enzyme and without RNA) were set as negative controls. These groups were subjected to qPCR with three pairs of primers respectively, using the method described above. The qPCR primers were designed within exons near the 3' end of three representative housekeeping genes:

  • GAPDH-qFWD: 5’-GCATCCTGGGCTACACTGAG-3’;

  • GAPDH-qRVS: 5’-AAAGTGGTCGTTGAGGGCAA-3’;

  • ACTB-qFWD: 5’-AGTCATTCCAAATATGAGATGCGTT-3’;

  • ACTB-qRVS: 5’-TGCTATCACCTCCCCTGTGT-3’;

  • CYC1-qFWD: 5’-CACCATAAAGCGGCACAAGT-3’;

  • CYC1-qRVS: 5’-CAGGATGGCAAGCAGACACT-3’.

Tn5 in vitro tagmentation on RNA/DNA hybrids

View detailed protocol

Partial double-stranded adaptor A and B were obtained by separately annealing 10 μM Tn5ME-A oligonucleotides (5’-TCGTCGGCAGCGTCAGATGTGTATAAGAGACAG-3’) and Tn5ME-B oligonucleotides (5’-GTCTCGTGGGCTCGGAGATGTGTATAAGAGACAG-3’) with equal amounts of mosaic-end oligonucleotides (5’-CTGTCTCTTATACACATCT-3’) in annealing buffer (10 mM Tris–HCl pH 7.5, 10 mM NaCl). Samples were incubated for 5 min at 94°C and then cooled down slowly (1°C per minute) to 10°C. Assembly of Tn5 (TruePrep Tagment Enzyme, Vazyme, #S601-01) with equimolar mixture of annealed Adaptor A and B was performed according to the manufacturer’s protocol (Vazyme). The resulting assembled Tn5 was stored at −20°C until use.

Tagmentation reaction was set up by adding RNA/DNA hybrids (RT products or CLuc annealed products) or gDNA, 12 ng/μl assembled Tn5 and 1 U/μl SUPERase-In RNase Inhibitor (Invitrogen) to the reaction buffer containing 10 mM Tris-HCl, pH = 7.5, 5 mM MgCl2, 8% PEG8000% and 5% PEG200. The reaction was performed at 55°C for 30 min, and then SDS was added to a final concentration of 0.04% and Tn5 was inactivated for 5 min at room temperature.

Assays of tagmentation activity of Tn5 on RNA/DNA hybrids

View detailed protocol

The concentrations of RNA/DNA hybrids and dsDNA were first determined by PicoGreen quantification kit (Invitrogen). For testing tagmentation activity of Tn5 on RNA/DNA hybrids, reactions were carried out as above, with mRNA derived RT products or CLuc annealed products as substrate. The tagmentation products were then purified using 1.8X Agencourt RNAClean XP beads (Beckman Coulter) to remove Tn5 and excess free adaptors and eluted in 6 μl nuclease-free water. The size distribution of RNA/DNA hybrids after tagmentation was assessed by a Fragment Analyzer Automated CE System with DNF-474 High Sensitivity NGS Fragment Analysis Kit (AATI).

For testing tagmentation activity of Tn5 on RNA/DNA hybrids by quantitative polymerase chain reaction (qPCR), tagmentation products purified as above (100X-diluted) was firstly strand-extended with 0.32 U/μl Bst 3.0 DNA Polymerase (NEB) and 1X AceQ Universal SYBR qPCR Master Mix (Vazyme) at 72°C for 15 min, and then Bst 3.0 Polymerase was inactivated at 95°C for 5 min. After adding 0.2 μM qPCR primers (5’-AATGATACGGCGACCACCGAGATCTACACTCGTCGGCAGCGTC-3’; 5’-CAAGCAGAAGACGGCATACGAGATGTCTCGTGGGCTCGG-3’), qPCR was performed in a LightCycler (Roche) with a 5 min pre-incubation at 95°C followed by 40 cycles of 10 s at 95°C and 40 s at 60°C. For testing the effect of different buffers on tagmentation activity of Tn5 on RNA/DNA hybrids, buffers used were as follows: 1) Tagment buffer L (Vazyme); 2) Buffer with 8% PEG8000 (10 mM Tris-HCl at pH 7.5, 5 mM MgCl2 and 8% PEG8000); 3) Buffer with 10% DMF (10 mM Tris-HCl at pH 7.5, 5 mM MgCl2 and 10% DMF); 4) Buffer with 5% PEG200% and 8% PEG8000 (10 mM Tris-HCl at pH 7.5, 5 mM MgCl2, 5% PEG200% and 8% PEG8000).

Sanger sequencing

Request a detailed protocol

The PCR products following RNA/DNA hybrid tagmentation and strand extension were ligated to a blunt-end cloning vector using pEASY-Blunt Zero Cloning Kit (TransGen), followed by chemical transformation. Then, several single colonies were picked and sequenced with the forward primers of T7 and T3 promoters.

TRACE-seq library preparation and sequencing

View detailed protocol

For TRACE-seq library preparation, all reactions were performed in one tube. Reverse transcription and tagmentation reactions were carried out as above. Strand extension reaction was performed by directly adding 0.32 U/μl Bst 3.0 DNA Polymerase and 1X NEBNext Q5 Hot Start HiFi PCR Master Mix (NEB) to tagmentation products and incubating at 72°C for 10 min, followed by Bst 3.0 DNA Polymerase inactivation at 95°C for 5 min. Next, 0.2 μM indexed primers were added to perform enrichment PCR as follows: 30 s at 98°C, and then n cycles of 10 s at 98°C, 75 s at 65°C, followed by the last 10 min extension at 65°C. The PCR cycles ‘n’ depends on the amount of purified total RNA input (200 ng, n = 11; 20 ng, n = 14; 2 ng, n = 18). After enrichment, the library was purified twice using 1X Agencourt AMPure XP beads (Beckman Coulter) and eluted in 10 μl nuclease-free water. The concentration of resulting libraries was determined by Qubit 2.0 fluorometer with the Qubit dsDNA HS Assay kit (Invitrogen) and the size distribution of libraries was assessed by a Fragment Analyzer Automated CE System with DNF-474 High Sensitivity NGS Fragment Analysis Kit (AATI). Finally, libraries were sequenced on the Illumina Hiseq X10 platform which generated 2 × 150 bp of paired-end raw reads.

NEBNext and Smart-seq2 library preparation

Request a detailed protocol

NEBNext Ultra II RNA libraries were constructed using NEBNext Ultra II RNA Library Prep Kit for Illumina (NEB, #E7770S) according to the manufacturer’s instructions. Smart-seq2 libraries were performed according to the previously published protocol (Picelli et al., 2014b).

Data analysis

View detailed protocol

Raw reads from sequencing were firstly subjected to Trim Galore (v0.6.4_dev, RRID:SCR_011847) (http://www.bioinformatics.babraham.ac.uk/projects/ trim_galore/) for quality control and adaptor trimming. The minimal threshold of quality was 20, and the minimal length of reads to remain was set as 20 nt. In terms of differential gene expression analysis, we down-sampled reads per library to 60 million. Otherwise, we down-sampled reads per library to 30 million. Then reads were mapped to human genome (hg19) and transcriptome using STAR (v2.7.1a, RRID:SCR_015899) (Dobin et al., 2013), and the transcriptome was prepared based on the Refseq annotation of human (hg19) downloaded from the table browser of UCSC database. rRNA contamination was determined through directly mapping to the dataset of human rRNA sequence downloaded from NCBI (NR_003286.2, NR_003287.2, NR_003285.2, and X71802.1) by bowtie2 (v2.2.9, RRID:SCR_005476) (Langmead and Salzberg, 2012). Performances related to the processing of sam/bam file were done with the help of Samtools (v1.9, RRID:SCR_002105) (Li et al., 2009). The FPKM value for annotated genes was calculated by cuffnorm (v2.2.1, RRID:SCR_014597) (Trapnell et al., 2010), and genes with FPKM >0.5 were considered to be expressed. Log-transformed FPKM values of housekeeping genes (Supplementary file 5, list from Eisenberg and Levanon, 2013) were plotted when comparison of gene expression measurement among TRACE-seq2, NEBNext and Smart-seq2 libraries. Gene body coverage and nucleotide composition for each position of the first 30 bases of each sequence read per library were calculated by QoRTs (v1.1.6, RRID:SCR_018665) (Hartley and Mullikin, 2015). Reads distribution and GC content distribution of mapped reads were calculated by RseQC (v2.6.4, RRID:SCR_005275) (Wang et al., 2012), and median coefficient of variation of gene coverage over the 1000 most highly expressed transcripts per library and insert size of library were calculated by Picard Tools (v2.20.6, RRID:SCR_006525) (http://broadinstitute.github.io/picard/). Library complexity was calculated by Preseq (v2.0.0, RRID:SCR_018664) (Daley and Smith, 2013). The sequence conservations of Tn5 insertion sites on RNA/DNA hybrids were analyzed by WebLogo (v2.8.2, RRID:SCR_010236) (https://weblogo.berkeley.edu/). Reads Coverage was visualized using the IGV genome browser (v2.4.16, RRID:SCR_011793) (Robinson et al., 2011). Differential gene expression analysis was conducted using DESeq2 (v1.26.0, RRID:SCR_015687) (Love et al., 2014) with gene count data generated by HTSeq (v 0.11.2, RRID:SCR_005514) (Anders et al., 2015). And all corresponding graphs were plotted using R scripts by RStudio (v1.2.5033, RRID:SCR_000432) (https://rstudio.com/).

Appendix 1

Appendix 1—key resources table
Reagent type
(species) or resource
DesignationSource or
reference
IdentifiersAdditional
information
Cell line (Homo-sapiens)HEK293TAmerican Type Culture CollectionCat#: CRL-11268, RRID:CVCL_1926
AntibodyMouse anti-DNA-RNA Hybrid [S9.6] AntibodyKerafastCat#: ENH001, RRID:AB_26874631:2000
AntibodyAntibody Anti-mouse-IgG-HRPCWBiotechCat#: CW0102, RRID:AB_27369971:3000
Recombinant DNA reagentCLuc Control Template NEBCat#: E2060S
Sequence-based reagentCLuc Control_FThis paperPCR primersTAATACGACTCACTATAGGG
Sequence-based reagentCLuc Control_RThis paperPCR primersTTAGCTTCACAGGAAGTTGG
Sequence-based reagentGAPDH-qFWDThis paperPCR primersGCATCCTGGGCTACACTGAG
Sequence-based reagentGAPDH-qRVSThis paperPCR primersAAAGTGGTCGTTGAGGGCAA
Sequence-based reagentACTB-qFWDThis paperPCR primersAGTCATTCCAAATATGAGATGCGTT
Sequence-based reagentACTB-qRVSThis paperPCR primersTGCTATCACCTCCCCTGTGT
Sequence-based reagentCYC1-qFWDThis paperPCR primersCACCATAAAGCGGCACAAGT
Sequence-based reagentCYC1-qRVSThis paperPCR primersCAGGATGGCAAGCAGACACT
Sequence-based reagentTn5ME-Adoi: 10.1186/gb-2010-11-12-r119Transposon adaptor oligonucleotidesTCGTCGGCAGCGTCAGATGTGTATAAGAGACAG
Sequence-based reagentTn5ME-Bdoi: 10.1186/gb-2010-11-12-r119Transposon adaptor oligonucleotidesGTCTCGTGGGCTCGGAGATGTGTATAAGAGACAG
Sequence-based reagentTn5MErevdoi: 10.1186/gb-2010-11-12-r119Transposon adaptor oligonucleotidesCTGTCTCTTATACACATCT
Sequence-based reagentTn5_qFWDThis paperPCR primersAATGATACGGCGACCACCGAGATCTACACTCGTCGGCAGCGTC
Sequence-based reagentTn5_qRVSThis paperPCR primersCAAGCAGAAGACGGCATACGAGATGTCTCGTGGGCTCGG
Sequence-based reagentTSOdoi:10.1038/nprot.2014.006Template switch primerAAGCAGTGGTATCAACGCAGAGTACATrGrG+G
Sequence-based reagentISPCR oligodoi:10.1038/nprot.2014.006PCR primersAAGCAGTGGTATCAACGCAGAGT
Sequence-based reagentoligo dT(23)VN primerNEBCat#: S1327S
Sequence-based reagentRandom primer mixNEBCat#: S1330S
Sequence-based reagentN501 primerIlluminaPCR primers for sequencing
Sequence-based reagentN701-N712 primersIlluminaPCR primers for sequencing
Commercial assay or kit TRIzolInvitrogen Cat#: 15596018
Commercial assay or kitBlood & Cell Culture DNA Midi KitQiagen Cat#: 13343
Commercial assay or kitMAXIscript T7 Transcription KitInvitrogenCat#: AM1314M
Commercial assay or kitSUPERase-In RNase InhibitorInvitrogen Cat#: AM2696
Commercial assay or kitQuant-iT PicoGreen dsDNA Assay KitInvitrogenCat#: P11496
Commercial assay or kitAceQ Universal SYBR qPCR Master MixVazymeCat#: Q511-02
Commercial assay or kitpEASY-Blunt Zero Cloning KitTransGenCat#: CB501-01
Commercial assay or kitNEBNext Q5 Hot Start HiFi PCR Master MixNEBCat#: M0544
Commercial assay or kitAgencourt AMPure XP beadsBeckman CoulterCat#: A63882
Commercial assay or kitRNAClean XP beadsBeckman CoulterCat#: A63987
Commercial assay or kitQubit dsDNA HS Assay kitInvitrogenCat#: Q33230
Commercial assay or kitDNF-474 High Sensitivity NGS Fragment Analysis KitAgilentCat#: DNF-473-1000
Commercial assay or kitNEBNext Ultra II RNA Library Prep Kit for IlluminaNEBCat#: E7770S
Commercial assay or kitDynabeads Oligo(dT)25InvitrogenCat#: 61005
Commercial assay or kitKAPA HiFi HotStart ReadyMixKAPA BiosystemsCat#: KK2601
Commercial assay or kitTransDetect PCR Mycoplasma Detection KitTransGenCat#: FM311-01
Commercial assay or kitRNA 6000 Pico kits (Agilent TechnologiesAgilentCat#: 5067-1513
Peptide, recombinant protein DNase INEBCat#: M0303S
Peptide, recombinant proteinSuperScript IV reverse transcriptaseInvitrogen Cat#: 12594100
Peptide, recombinant proteinSuperScript II reverse transcriptaseInvitrogenCat#: 18064022
Peptide, recombinant proteinRNase HNEBCat#: M0297
Peptide, recombinant proteinTruePrep Tagment EnzymeVazymeCat#: S601-01
Peptide, recombinant proteinBst 3.0 DNA PolymeraseNEBCat#: M0374S
Chemical compound, drugPEG200SigmaCat#: 88440
Chemical compound, drugPEG8000SigmaCat#: 89510
Software, algorithmTrim Galorehttp://www.bioinformatics.babraham.ac.uk/projects/trim_galore/RRID:SCR_011847v0.6.4_dev
Software, algorithmSTARPMID:23104886RRID:SCR_015899v2.7.1a
Software, algorithmbowtie2https://doi.org/10.1038/nmeth.1923RRID:SCR_005476v2.2.9
Software, algorithmSamtoolshttp://samtools.sourceforge.net/RRID:SCR_002105v1.9
Software, algorithmcuffnormPMID:20436464RRID:SCR_014597v2.2.1
Software, algorithmQoRTshttps://doi.org/10.1186/s12859-015-0670-5RRID:SCR_018665v1.1.6
Software, algorithmRseQCPMID:22743226RRID:SCR_005275v2.6.4
Software, algorithmPicard Toolshttp://broadinstitute.github.io/picard/RRID:SCR_006525v2.20.6
Software, algorithmPreseqPMID:23435259RRID:SCR_018664v2.0.0
Software, algorithmRStudiohttps://rstudio.com/RRID:SCR_0004321.2.5033
Software, algorithmIntegrative Genomics Viewerhttp://software.broadinstitute.org/software/igv/RRID:SCR_011793v2.4.16

Data availability

High-throughput sequence data has been deposited in GEO under accession code GSE143422.

The following data sets were generated
    1. Lu B
    2. Dong L
    3. Yi D
    4. Zhang M
    5. Yi C
    (2020) NCBI Gene Expression Omnibus
    ID GSE143422. Transposase assisted tagmentation of RNA/DNA hybrid duplexes.

References

    1. Lodge JK
    2. Weston-Hafer K
    3. Berg DE
    (1988)
    Transposon Tn5 target specificity: preference for insertion at G/C pairs
    Genetics 120:645–650.

Decision letter

  1. Kevin Struhl
    Senior Editor; Harvard Medical School, United States
  2. Martha L Bulyk
    Reviewing Editor; Dana-Farber Cancer Institute, United States
  3. Andrew C Adey
    Reviewer; Oregon Health & Science University, United States
  4. Bart Deplancke
    Reviewer; EPFL, Switzerland

In the interests of transparency, eLife publishes the most substantive revision requests and the accompanying author responses.

Acceptance summary:

Your revised manuscript addresses the reviewers' prior concerns. We anticipate your new TRACE-Seq method will be of interest to readers as an efficient, lower cost alternative to traditional library construction methods for RNA-Seq.

Decision letter after peer review:

Thank you for sending your article entitled "Transposase assisted tagmentation of RNA/DNA hybrid duplexes" for peer review at eLife. Your article is being evaluated by three peer reviewers, and the evaluation is being overseen by a Reviewing Editor and Kevin Struhl as the Senior Editor.

As noted in our prior communications about the competing study that has now been published in PNAS, please be sure to mention that published study appropriately in your revised manuscript and to cite it in the main text.

Also, with regard to the name of your method, I agree with reviewer #1 that ATRAC-Seq does not make sense as an abbreviation and may be confused with ATAC-Seq, and recommend naming it something else.

Reviewer #1:

In Lu et al. the authors describe a strategy for producing RNA-seq libraries by the direct tagmentation of RNA-DNA hybrids. This method "ATRAC-seq" is very similar to "SHERRY" recently published in PNAS ("RNA sequencing by direct tagmentation of RNA/DNA hybrids") relying on what appears to be transposition activity of the Tn5 transposase into RNA/DNA hybrids. Overall the paper does a good job characterizing the RNA-seq libraries; however, like the PNAS publication, the authors do not have any experiments that explicitly test the RNA/DNA transposition efficiency. Neither the published work or the manuscript presented here take into account the various efficiencies of RT enzymes / mixes to produce dsDNA, varying based on the RNase H efficiency. It is worth noting that this is irrelevant for producing a simplified assay – it does not matter if the Tn5 is inserting into dsDNA product after the first strand synthesis or to the RNA/DNA hybrids, as both produce a simplified workflow for producing RNA-seq libraries. The issue is that any publication claiming this phenomenon without direct evidence in a controlled setting could result in misguided assumptions to the field. A properly controlled test would eliminate the RT component and directly assess hybrid constructs where no dsDNA is possible. It may be that the efficiency is high, which drives this result and not the dsDNA after RT; however, it needs to be directly demonstrated.

Other than the RNA-DNA transposition assumptions, the rest of the manuscript is a test of the RNA-seq libraries that were generated when compared to standard techniques, which are fairly standard and properly assessed.

Reviewer #2:

The manuscript "Transposase assisted tagmentation of RNA/DNA hybrid duplexes" by Lu et al. describes a new approach involving direct tagmentation of RNA/DNA heteroduplexes for a "one tube" mRNA-seq library preparation protocol called ATRAC-seq. Involving fewer steps, this workflow is allowing the generation of transcriptomics data with a seemingly similar quality as a conventional RNA-seq workflow and is reportedly faster and cheaper.

Indeed, as a novel approach, direct tagmentation of RNA/DNA hybrids looks very interesting and can potentially provide new grounds for improving a number of existing RNA-seq protocols allowing to bypass the second strand synthesis step.

The major concern, however, is the novelty of this work. A paper describing very similar results and a comparable transcriptomics approach have just been published recently as a peer-review article (Da et al., PNAS) and last November 2019 as a preprint. Importantly, some authors from the current Lu et al. work seem to be affiliated with the same departments as the co-authors on Da et al., namely the Tsinghua-Peking Center for Life Sciences and College of Chemistry and Molecular Engineering, Peking University. This might be considered as merely an unlucky coincidence, but the overall similarity of the two works is truly puzzling and thus suggests this might not be the case. It involves obvious parallels in the overall flow of the manuscript and its structure: 1) rationale for attempting the tagmentation of hybrids with Tn5; 2) experimental approach; 3) workflow for mRNA-seq benchmarking; 4) figure layouts look (i.e. Figure 1 in both works show protein domain structure similarity between RNAse H superfamily members). The actual RNA-seq method ATRAC-seq described by the authors is apparently identical to SHERRY from Da et al., with slight variations such as the enzyme (Superscript II vs Superscript IV; Bst2 vs Bst3) and tagmentation buffer composition (9% PEG8000 vs 8% PEG8000). In brief, one may think that a number of merely esthetical changes were introduced in the work of Lu et al. to make it appear distinct from Da et al., 2020. That being said, the work of Da et al. also provides more details and mechanistic insights concerning tagmentation of hybrids.

Finally, the benchmarking is rather meager, as at a minimum, differential gene expression should be included as well as other parameters as for example detailed in Levin et al., Nat Meth, 2010; Alpern et al., Genome Biology, 2019; Pallares et al., 2020.

Other comments:

• How does the 256-fold increase in number of amplifiable fragments after tagmentation with active Tn5 vs inactive with RNA/DNA hybrids compare when dsDNA is used as a substrate? In this regard, what the authors may have addressed is the basis of tagmentation efficiency of RNA/DNA hybrids and dsDNA. It would be interesting to know what drives the preference of the Tn5 for tagmenting one substrate over another.

• The RNA samples might be contaminated with gDNA, which will presumable serve as a better substrate for Tn5, did the authors check this possibility experimentally or by checking the resulting sequencing reads?

• What was the reason of using Bst polymerase? Have the authors compared this to the results obtained with the conventional tagmentation protocol involving PCR amplification as described in the protocol of Picceli et al., 2014? This also relates to the shallow benchmarking already mentioned above.

Reviewer #3:

General Assessment:

This manuscript presents a new method termed "ATRAC-seq," which uses Tn5 to fragment RNA/cDNA hybrids to streamline RNA-Seq library construction. This is an interesting advancement, though the standard methods are not that difficult or time-consuming (contrary to the authors' statements). For this method to be widely adopted, the authors would need to show more data about quality and address issues such as Tn5 sequence specificity and 3' coverage bias. Note that essentially the same method has been published on January 27, 2020 as "SHERRY" -- https://www.pnas.org/content/early/2020/01/24/1919800117.

Numbered summary of any substantive concerns.

1) One key problem with the manuscript is that the authors do not use a standard sample for which the expression values are known, so that the comparison with the NEBNext Ultra II RNA library prep kit is inconclusive. It's not possible to know whether there is "comparable performance" as written about Figure 2E without a known standard or another control. The authors should add a new series of experiments with standard samples, such as "the well-characterized reference RNA samples A (Universal Human Reference RNA) and B (Human Brain Reference RNA) from the MAQC consortium, adding spike-ins of synthetic RNA from the External RNA Control Consortium (ERCC)" as published by the SEQC/MAQC-III Consortium in Nature Biotechnology 32:903-914 (2014). In that paper, the authors compare to qRT-PCR data as well as RNA-Seq. Moreover, Figure 2E shows R=0.6970 between the NEB and ATRAC-seq libraries – that is not particularly good correlation.

2) In addition, it would be interesting to see a comparison to Smart-seq2, which is a similar method in its use of oligo(dT) primed cDNA synthesis and Tn5 tagmentation. This method is much closer to ATRAC-seq than the NEB kit.

3) The authors need to more explicitly address 3' end bias (as shown in Figure 2F), as it relates to sequence coverage of genes based on their length. Analysis could be presented as in Figure 1 of Ramsköld et al. Nature Biotechnology 30:777-782 (2012). The 3' end bias was also observed in Di et al. PNAS (Figure S11 and page 7). How will this affect expression level measurements and downstream analysis? One possible solution is to use rRNA depletion together with random-primed cDNA synthesis?

4) Other analyses that should be considered are evenness of coverage along a transcript (coefficient of variation) and the ability to identify differentially expressed genes (Figure 3B in Di et al.).

5) The authors should explain further the "per-position" analysis (Figure 1—figure supplement 1F) as it is not clear what is being shown or how it was calculated.

6) There are experimental and computational details missing from this manuscript. The authors should add the following:

a) Were the ATRAC-seq and NEB libraries prepared from the same RNA?

b) What was the RIN score of RNA used in each experiment?

c) How was the NEB library constructed? This is not mentioned in the Materials and methods section.

d) How is the annealing done for Tn5 oligos (concentration, time, temperature, buffers)?

e) What is the full name and catalog # for the Tn5 purchased from Vazyme?

f) How many reads are there for each library? Analyses should be done with the same number of raw reads per library by down-sampling.

g) Accession #'s for human rRNA should be listed.

[Editors' note: further revisions were suggested prior to acceptance, as described below.]

Thank you for submitting your article "Transposase assisted tagmentation of RNA/DNA hybrid duplexes" for consideration by eLife. Your article has been reviewed by three peer reviewers, and the evaluation has been overseen by a Reviewing Editor and Kevin Struhl as the Senior Editor. The following individuals involved in review of your submission have agreed to reveal their identity: Bart Deplancke (Reviewer #2).

The reviewers have discussed the reviews with one another and the Reviewing Editor has drafted this decision to help you prepare a revised submission.

We would like to draw your attention to changes in our revision policy that we have made in response to COVID-19 (https://elifesciences.org/articles/57162). Specifically, when editors judge that a submitted work as a whole belongs in eLife but that some conclusions require a modest amount of additional new data, as they do with your paper, we are asking that the manuscript be revised to either limit claims to those supported by data in hand, or to explicitly state that the relevant conclusions require additional supporting data.

Our expectation is that the authors will eventually carry out the additional experiments and report on how they affect the relevant conclusions either in a preprint on bioRxiv or medRxiv, or if appropriate, as a Research Advance in eLife, either of which would be linked to the original paper.

Summary:

The revisions have addressed most of the concerns raised previously by the reviewers. Some additional revisions need to be carried out before the manuscript is acceptable for publication.

Revisions expected in follow-up work:

1) See comment by reviewer #1 regarding a missing positive control and comparisons of efficiency for DNA/RNA hybrids versus dsDNA.

2) A number of concerns made by reviewer #3 regarding the presentation in the manuscript. None of these concerns require additional experiments.

Reviewer #1:

I appreciate that the authors went to a good deal of work to test the synthetic constructs that they describe. They note Ct values of 24 (active Tn5), 28 (inactivated Tn5), and 29 (negative control); however, they neglect to include a positive control. I am surprised, as this would be an easy addition – annealing a ssDNA to the other ssDNA template as opposed to RNA. As it stands, the ct of 24 seems very late for transposed product. Comparing to dsDNA will give a sense of the difference in efficiency between DNA/RNA hybrids and dsDNA. The other edits are fine, this is the last component I believe needs to be addressed.

Reviewer #2:

The authors have adequately addressed our major concerns. No further comments.

Reviewer #3:

General Assessment:

The revised manuscript is much improved. It was good to see the addition of the Smart-seq2 and rRNA depletion with TRACE-seq experiments. It is understandable that the authors could not add an experiment with a standard reference sample or spike-ins due to the COVID-19 outbreak. There are still issues remaining with respect to analysis, presentation, and conclusions.

Numbered summary of any substantive concerns.

1) The authors' use of housekeeping genes to assess correlation in gene expression measurements between different methods is acceptable, but these issues should be addressed.

a) The use of a set of housekeeping genes should be clearly identified in the Results section and the figure legends

b) The actual names of the housekeeping genes used should be listed in a Supplementary table rather than "list from Eisenberg and Levanon, 2013)" as in the Materials and methods section.

c) They should also present the analysis with all the genes – noting that one example is shown in the authors' response to reviewers' comments.

2) In several places, the authors minimize the underperformance of their TRACE-seq method. In each place, the authors should modify the text and include the actual numbers for the readers in the text. Finally, the text should be modified from "are comparable", "demonstrates comparable performance", and "shows comparable performance" to something more measured that lists the advantages and disadvantages.

a) Coefficient of Variation is actually much worse (Figure 2—figure supplement 1D) not "slightly higher coefficient of variation".

b) 5' to 3' bias. This issue is not apparent here because of the use of high quality RNA (RIN 9.5), but with lower quality "real world" samples, the bias becomes more of an issue and the gene expression measurements will be affected. This should be noted in relation to the statement "In spite of the gene body coverage bias, the gene expression measurement (Figure 2E).… [is] unnoticeably affected."

c) rRNA-aligned reads is actually ~100x worse for 200ng total RNA than for 10ng mRNA. That is not "slightly higher but acceptable". It is probably acceptable, but that's a judgement for the reader to make.

d) Strandedness. The authors now do mention this, but this is actually a significant drawback for RNA-Seq experiments.

3) The authors' explanation of the "per-position" analysis (Figure 2—figure supplement 2I) as still not clear about what is being shown or how it was calculated.

4) The cost comparison between NEBnext and TRACE-seq is good, but the Smart-seq2 should be included and it is likely less expensive than either method ($10-15/library).

https://doi.org/10.7554/eLife.54919.sa1

Author response

Reviewer #1:

In Lu et al. the authors describe a strategy for producing RNA-seq libraries by the direct tagmentation of RNA-DNA hybrids. This method "ATRAC-seq" is very similar to "SHERRY" recently published in PNAS ("RNA sequencing by direct tagmentation of RNA/DNA hybrids") relying on what appears to be transposition activity of the Tn5 transposase into RNA/DNA hybrids. Overall the paper does a good job characterizing the RNA-seq libraries; however, like the PNAS publication, the authors do not have any experiments that explicitly test the RNA/DNA transposition efficiency. Neither the published work or the manuscript presented here take into account the various efficiencies of RT enzymes / mixes to produce dsDNA, varying based on the RNase H efficiency. It is worth noting that this is irrelevant for producing a simplified assay – it does not matter if the Tn5 is inserting into dsDNA product after the first strand synthesis or to the RNA/DNA hybrids, as both produce a simplified workflow for producing RNA-seq libraries. The issue is that any publication claiming this phenomenon without direct evidence in a controlled setting could result in misguided assumptions to the field. A properly controlled test would eliminate the RT component and directly assess hybrid constructs where no dsDNA is possible. It may be that the efficiency is high, which drives this result and not the dsDNA after RT; however, it needs to be directly demonstrated.

We thank this reviewer for the suggestion. To address this question, we directly tested Tn5 tagmentation activity on RNA/DNA hybrids produced independently of reverse transcription reaction. Between homopolymers (for instance, poly[rA:dT] or poly[rI:dC]) and base-diversified hybrids, we chose the latter since it is a better mimic of real substrates for RNA-seq experiments. Because the limit of ssDNA length produced by commercially available solid-state chemical synthesis is about 150 nt, we aimed to produce 150 bp RNA/DNA hybrids independently of reverse transcription. We first produced ssRNA model sequence (CLuc, 150 nt, GC%=51%) by in vitro transcription reaction from PCR products. Then we annealed the IVT ssRNA with a 150 nt synthesized complementary ssDNA to produce a RNA/DNA hybrid. We confirmed the successful production of annealed CLuc RNA/DNA hybrids by dot-blot assay and the purity of the resulting hybrids was further examined by native-PAGE (Figure 1—figure supplement 1E and 1F). We then subjected the prepared RNA/DNA hybrids to Tn5 transposome, heat-inactivated Tn5 transposome and a blank control (without Tn5) followed by qPCR quantification. We observed that cycle threshold (Ct) value of the Tn5 transposome sample (Ct=24.86) is about 4 cycles smaller than the heat inactivated Tn5 sample (Ct=28.89) or the control sample (Ct=29.25), indicating that Tn5 has direct tagmentation activity towards RNA/DNA hybrids (Figure 1—figure supplement 1G). We have incorporated all the above results into the revised manuscript (Figure 1—figure supplement 1E, 1F and 1G, Results section).

Other than the RNA-DNA transposition assumptions, the rest of the manuscript is a test of the RNA-seq libraries that were generated when compared to standard techniques, which are fairly standard and properly assessed.

We thank the reviewer for the positive comment.

Reviewer #2:

The manuscript "Transposase assisted tagmentation of RNA/DNA hybrid duplexes" by Lu et al. describes a new approach involving direct tagmentation of RNA/DNA heteroduplexes for a "one tube" mRNA-seq library preparation protocol called ATRAC-seq. Involving fewer steps, this workflow is allowing the generation of transcriptomics data with a seemingly similar quality as a conventional RNA-seq workflow and is reportedly faster and cheaper.

Indeed, as a novel approach, direct tagmentation of RNA/DNA hybrids looks very interesting and can potentially provide new grounds for improving a number of existing RNA-seq protocols allowing to bypass the second strand synthesis step.

The major concern, however, is the novelty of this work. A paper describing very similar results and a comparable transcriptomics approach have just been published recently as a peer-review article (Da et al., PNAS) and last November 2019 as a preprint. Importantly, some authors from the current Lu et al. work seem to be affiliated with the same departments as the co-authors on Da et al., namely the Tsinghua-Peking Center for Life Sciences and College of Chemistry and Molecular Engineering, Peking University. This might be considered as merely an unlucky coincidence, but the overall similarity of the two works is truly puzzling and thus suggests this might not be the case. It involves obvious parallels in the overall flow of the manuscript and its structure: 1) rationale for attempting the tagmentation of hybrids with Tn5; 2) experimental approach; 3) workflow for mRNA-seq benchmarking; 4) figure layouts look (i.e. Figure 1 in both works show protein domain structure similarity between RNAse H superfamily members). The actual RNA-seq method ATRAC-seq described by the authors is apparently identical to SHERRY from Da et al., with slight variations such as the enzyme (Superscript II vs Superscript IV; Bst2 vs Bst3) and tagmentation buffer composition (9% PEG8000 vs 8% PEG8000). In brief, one may think that a number of merely esthetical changes were introduced in the work of Lu et al. to make it appear distinct from Da et al., 2020. That being said, the work of Da et al. also provides more details and mechanistic insights concerning tagmentation of hybrids.

We thank this reviewer for pointing out the competing study. We did not know about it when we designed our project; despite the fact that some the authors of PNAS are our colleagues, we did not talk about the projects throughout the entire study and the two studies are independently performed. When we were about to submit our work at the end of 2019, we did then notice their paper posted on bioRxiv. To expedite our study, we quickly prepared our manuscript and also indicated the competing study in our initial cover letter to eLife. Thus, since the initial submission of our work, we aimed to make all the information we have as transparent as possible to the editorial office and reviewers. Now that their work published in PNAS, we have properly cited the study in the Discussion section of our revised manuscript.

With regard to the similarity of figure layout and experimental details of our method (renamed to “TRACE-seq” per the request of reviewer #1) with SHERRY: we acknowledge that the two methods have similar concept and thus similar reagents that are key to the success of the tagmentation activity on RNA/DNA hybrids. This could be further magnified by the simplified library preparation procedure, which now contain greatly reduced steps comparing to traditional library preparation procedure. This is especially the case in terms of some key reagents. For example, PEG8000 is a known crowding agent that effectively increased the efficiency of tagmentation reaction (Picelli et al., 2014). Nevertheless, these independently developed conditions and chosen reagents demonstrate that Tn5-mediated tagmentation activity is reproducible and robust.

In order to provide more details and mechanistic insights concerning tagmentation of hybrids, we have performed multiple experiments during the revision. For instance, we have provided evidence that Tn5 has direct tagmentation activity towards RNA/DNA hybrids (Figure 1—figure supplement 1G). This is achieved by assessing Tn5-mediated tagmentation activity on RNA/DNA hybrids obtained without reverse transcriptase, which could produce dsDNA from RNA/DNA hybrids. We designed an experiment by eliminating the RT component and directly assess annealed RNA/DNA hybrid constructs where no dsDNA is possible. We confirmed the successful production and purity of annealed RNA/DNA hybrids by dot-blot assay and native-PAGE (Figure 1—figure supplement 1E and 1F), and observed activity of Tn5 on such RNA/DNA hybrids substrate. Secondly, during revision we discovered a new component that greatly improves Tn5 tagmentation efficiency towards RNA/DNA hybrids (Figure 1E). The addition of PEG200 in the tagmentation condition, which we believe enables the RNA/DNA hybrids to favor B-form conformation (Pramanik et al., 2011), makes hybrids a better substrate of Tn5 and thus significantly improves the tagmentation reaction and quality of libraries. With this key invention, the current correlation between NEB and TRACE-seq (R=0.9072, All genes) is much better than the data in the original manuscript. Third, we have performed additional differential gene expression analysis using differentiated and undifferentiated mESCs. All of these results are unique to this study and have been incorporated into the revised manuscript (see Figure 1E, Figure 1—figure supplement 1E,1F,1G and Figure 3 A-C, Results section).

Finally, the benchmarking is rather meager, as at a minimum, differential gene expression should be included as well as other parameters as for example detailed in Levin et al., Nat Meth, 2010; Alpern et al., Genome Biology, 2019; Pallares et al., 2020.

We thank the reviewer for the suggestion and pointing out these references. Because it is well known that there are many differentially expressed genes between undifferentiated and differentiated mESCs (Bhattacharya et al., 2004; Hailesellasse Sene et al., 2007; Palmqvist et al., 2005), during revision, we chose them as inputs for differential gene expression analysis using TRACE-seq procedure and the traditional NEB procedure, respectively.

As shown in Figure 3A, TRACE-seq successfully detected 4,577 differentially expressed genes (3,264 up-regulated genes and 1,313 down-regulated genes), while NEB detected 4,452 differentially expressed genes (3,157 up-regulated genes and 1,295 down-regulated genes). The overlapping gene number is 4,071 (Figure 3B), showing very high consistency between methods. Besides, the fold change of the 4,071 overlapping genes is highly correlated between methods (R> 0.99, Figure 3C). Therefore, TRACE-seq shows excellent performance in differential gene expression analysis.

We also assessed the performance of TRACE-seq in terms of library complexity and evenness of coverage as mentioned in previous work (Levin et al., 2010). TRACE-seq (using random RT primer) library has high complexity, which is highly consistent with NEB library. What’s more, TRACE-seq library complexity maintains at high level with a small input material (Figure 2—figure supplement 1G). As for evenness of coverage, compared to NEB and Smart-Seq2 libraries, TRACE-seq libraries show a slightly higher coefficient of variation of gene coverage (Figure 2—figure supplement 1D). These results have been incorporated into the revised manuscript (Figure 2—figure supplement 1D and 1F, Results section).

Other comments:

• How does the 256-fold increase in number of amplifiable fragments after tagmentation with active Tn5 vs inactive with RNA/DNA hybrids compare when dsDNA is used as a substrate? In this regard, what the authors may have addressed is the basis of tagmentation efficiency of RNA/DNA hybrids and dsDNA. It would be interesting to know what drives the preference of the Tn5 for tagmenting one substrate over another.

We thank this reviewer for the question. To answer this question, we performed tagmentation experiment on equal amount of gDNA and mRNA RT products (quantified by PicoGreen assay) followed by qPCR experiment to quantify amplifiable fragments. We found that average Ct value (Ct=25.23) of the hybrids samples was about 4 cycles more than gDNA samples (Average Ct value=21.19), indicating the efficiency of Tn5 towards hybrids is about 1/16 of that of dsDNA.

It is known that natural RNA/DNA hybrids favor A-form conformation. Interestingly, in the presence of PEG200, hybrids were found to favor B-form conformation (Pramanik et al., 2011), which we expected to make the hybrids a better substrate of Tn5. Indeed, addition of PEG200 diminishes this difference by greatly improving the Tn5 tagmentation efficiency towards hybrids (Ct=21.94), while having no influence on dsDNA (Ct=21.15). This result indicates that the conformation of substrates certainly affects the preference of Tn5. In addition, this finding also significantly improves the tagmentation reaction and provides a condition that greatly improves the quality of libraries. These results have been incorporated into the revised manuscript (Figure 1E, Results section).

• The RNA samples might be contaminated with gDNA, which will presumable serve as a better substrate for Tn5, did the authors check this possibility experimentally or by checking the resulting sequencing reads?

We appreciate the reviewer’s thoroughness. During revision, we have performed qPCR experiments to assess potential gDNA contamination. After DNase treatment, RNA samples were subjected to reverse transcription (RT). Two other groups (without RT enzyme and without RNA) were set as negative controls. Then we utilized primer pairs within an exon of three represented housekeeping genes to perform qPCR for these groups, respectively. In this way, potential gDNA contamination in the RNA sample and the cDNA generated by RT can be amplified simultaneously.

We found that for all the three genes, the RT groups have small Ct numbers, while the two negative control groups have very large (>35) or even not detectable (N.D.) Ct numbers, similar with qPCR result of blank control (water) (Figure 1—figure supplement 1H). Therefore, it is the newly generated cDNA via RT that is detected by qPCR, and we found no sign of gDNA contamination.

Meanwhile, we have also performed bioinformatic analysis of the reads distributions. One would expect to observe many reads from intron if the library were prepared from potential gDNA contamination. On the contrary, as shown in Figure 2H, TRACE-seq libraries starting from purified mRNA showed high exon distribution rates (94.04% from Random primer, and 95.99% from Oligo dT primer) and low intron distribution rates (4.88% and 2.91%). We thus conclude that the library is constructed from RNA/DNA hybrids after RT, not potential gDNA contamination. These results have been incorporated into the revised manuscript (Figure 1—figure supplement 1H, Figure 2H, Results section).

• What was the reason of using Bst polymerase? Have the authors compared this to the results obtained with the conventional tagmentation protocol involving PCR amplification as described in the protocol of Picceli et al., 2014? This also relates to the shallow benchmarking already mentioned above.

Per you request, we have constructed libraries using Bst 3.0 DNA polymerase and SS IV reverse transcriptase respectively and analyzed the sequencing data, so as to compare the strand extension catalytic performance of the enzymes. We found that the Bst 3.0 DNA polymerase showed higher mapping ratio (Supplementary file 1); we thus think Bst 3.0 may be a better choice for strand extension in TRACE-seq.

We have also constructed libraries using Q5 DNA polymerase and KAPA DNA polymerase (used in the protocol of Picceli et al., 2014) respectively to compare their PCR amplification performance. The mapping ratio of Q5 DNA polymerase library was significantly higher than KAPA DNA polymerase library. The results showed that Q5 DNA polymerase performed better than KAPA DNA polymerase during amplification of TRACE-seq (Supplementary file 1). In addition, due to addition of both PEG200 and DMF to tagmentation reaction, the mapping ratios of these libraries were overall lower than that of libraries tagmented without DMF. Thus, we choose to only add PEG200 to conventional tagmentation buffer in the final recipe to achieve greatly improved tagmentation efficiency.

Further benchmarking has been conducted during revision, including differential gene expression analysis, assessment of library complexity and evenness of coverage, which are incorporated into the revised manuscript (Figure 3, Figure 2—figure supplement 1D and 1G, Results section).

Reviewer #3:

General Assessment:

This manuscript presents a new method termed "ATRAC-seq," which uses Tn5 to fragment RNA/cDNA hybrids to streamline RNA-Seq library construction. This is an interesting advancement, though the standard methods are not that difficult or time-consuming (contrary to the authors' statements). For this method to be widely adopted, the authors would need to show more data about quality and address issues such as Tn5 sequence specificity and 3' coverage bias. Note that essentially the same method has been published on January 27, 2020 as "SHERRY" -- https://www.pnas.org/content/early/2020/01/24/1919800117.

Numbered summary of any substantive concerns.

1) One key problem with the manuscript is that the authors do not use a standard sample for which the expression values are known, so that the comparison with the NEBNext Ultra II RNA library prep kit is inconclusive. It's not possible to know whether there is "comparable performance" as written about Figure 2E without a known standard or another control. The authors should add a new series of experiments with standard samples, such as "the well-characterized reference RNA samples A (Universal Human Reference RNA) and B (Human Brain Reference RNA) from the MAQC consortium, adding spike-ins of synthetic RNA from the External RNA Control Consortium (ERCC)" as published by the SEQC/MAQC-III Consortium in Nature Biotechnology 32:903-914 (2014). In that paper, the authors compare to qRT-PCR data as well as RNA-Seq. Moreover, Figure 2E shows R=0.6970 between the NEB and ATRAC-seq libraries – that is not particularly good correlation.

We agree with the reviewer that a more standard sample would give us more accurate information about the performance of TRACE-seq. Unfortunately, due to the outbreak of COVID-19, neither Universal Human Reference RNA, Human Brain Reference RNA nor ERCC was available at the moment. Instead of external spike-in RNA, internal control genes were also frequently used to normalize gene expression data (de Kok et al., 2005). Thus, we chose a series of endogenous control genes, i.e. housekeeping genes (list from Trends Genet 29, 569-574(2013)), to compare the performance of TRACE-seq and NEB kit in terms of gene expression measurement, and found a high correlation between NEB and TRACE-seq for endogenous control genes (R=0.9447). Thus, we believe TRACE-seq demonstrates comparable performance to the NEB kit. These results have been incorporated into the revised manuscript (Figure 2E, Results section).

In the meanwhile, we have significantly optimized the tagmentation condition during revision. Now, as shown below, the correlation between NEB and TRACE-seq (R=0.9072, All genes) is much better than the data in the original manuscript. This is due to the addition of PEG200 in the tagmentation condition, which we believe enables the RNA/DNA hybrids to favor B-form conformation and thus a better substrate of Tn5 (Pramanik et al., 2011). This finding significantly improves the tagmentation efficiency and provides a condition that greatly improves the quality of libraries. These results have been incorporated into the revised manuscript (Figure 1E, Result section).

2) In addition, it would be interesting to see a comparison to Smart-seq2, which is a similar method in its use of oligo(dT) primed cDNA synthesis and Tn5 tagmentation. This method is much closer to ATRAC-seq than the NEB kit.

We thank the reviewer for the suggestion. During revision, we have performed additional RNA-seq library construction by both TRACE-seq and Smart-seq2, and then compared their performance in terms of gene number, gene expression analysis, gene body coverage, evenness of coverage, library complexity, etc. in the revised manuscript. Most of the genes (~93%) detected by TRACE-seq overlap with that of Smart-seq2, with slightly more genes detected by TRACE-seq. In addition, TRACE-seq showed comparable performance to Smart-seq2 in terms of gene expression measurement. When the gene body coverage across all transcripts is concerned, TRACE-seq showed a slightly more 3’ end bias than Smart-seq2, consistent with the observation that TRACE-seq shows a slightly higher coefficient of variation of gene coverage. Nevertheless, TRACE-seq library complexity is similarly high when compared to NEB and Smart-seq2 library.

3) The authors need to more explicitly address 3' end bias (as shown in Figure 2F), as it relates to sequence coverage of genes based on their length. Analysis could be presented as in Figure 1 of Ramsköld et al. Nature Biotechnology 30:777-782 (2012). The 3' end bias was also observed in Di et al. PNAS (Figure S11 and page 7). How will this affect expression level measurements and downstream analysis? One possible solution is to use rRNA depletion together with random-primed cDNA synthesis?

Per the request of the reviewer, transcripts were grouped according to annotated lengths and the gene body coverage was analyzed separately. As shown in Figure 2 —figure supplement 1F, the gene body coverage was comparable among TRACE-seq, NEB kit and Smart-seq2 libraries for transcripts shorter than 1kb. For transcripts with length between 1kb and 4kb, a 3’ end bias was observed in TRACE-seq libraries (using oligo dT RT primer); for transcripts with length between 4kb and 15kb, the central regions of transcripts were less covered by TRACE-seq (using oligo dT RT primer), which is also a known phenomenon in Smart-seq2 libraries (Xiao et al., 2018). We also performed TRACE-seq by using rRNA depletion together with random-primed cDNA synthesis. While this indeed solved the 3’ end bias of TRACE-seq, we appear to observe a 5’ end bias. Nevertheless, this library shows a higher correlation with NEB kit (R=0.9447). In spite of these gene body coverage bias, the gene expression measurement and differential gene expression analysis is almost unaffected, as shown in Figure 2E and Figure 3.

4) Other analyses that should be considered are evenness of coverage along a transcript (coefficient of variation) and the ability to identify differentially expressed genes (Figure 3B in Di et al.).

We thank the reviewer for the suggestion. We have calculated the median coefficient of variation of coverage over the 1000 most highly expressed transcripts by Picard Tools in the revised manuscript. Compared to NEB and Smart-seq2 libraries, TRACE-seq libraries show a slightly high coefficient of variation of coverage (Figure 2 —figure supplement 1D).

In addition, comparison of the performance in terms of differential gene expression analysis between NEB and TRACE-seq libraries have been conducted in the revised manuscript. Because it is well known that there are many differentially expressed genes between undifferentiated and differentiated mESCs (Bhattacharya et al., 2004; Hailesellasse Sene et al., 2007; Palmqvist et al., 2005), during revision we performed DE analysis using TRACE-seq procedure and the traditional NEB procedure, respectively.

As shown in Figure 3A, TRACE-seq successfully detected 4,577 differentially expressed genes (3,264 up-regulated genes and 1,313 down-regulated genes), while NEB detected 4,452 differentially expressed genes (3,157 up-regulated and 1,295 down-regulated genes). The overlapping gene number is 4,071 (Figure 3B), showing very high consistency between methods. Besides, the fold change of the 4,071 overlapping genes is highly correlated between methods (R> 0.99, Figure 3C). Therefore, TRACE-seq shows excellent performance in differential gene expression analysis.

5) The authors should explain further the "per-position" analysis (Figure 1—figure supplement 1F) as it is not clear what is being shown or how it was calculated.

We apologize for not making this clear in the original main text. In the revised manuscript, we calculated nucleotide composition of the first 30 bases of each sequencing read per library by QoRTs to characterize the potential insertion bias of Tn5 (Figure 2—figure supplement 1H, I). The detailed description can be found in the Results section.

6) There are experimental and computational details missing from this manuscript. The authors should add the following:

a) Were the ATRAC-seq and NEB libraries prepared from the same RNA?

Yes, we extracted RNA from cultured HEK293T cells and then used it in parallel to construct NEB, TRACE-seq and Smart-seq2 library. The newly updated results are shown in Figure 2 and Figure 2—figure supplement 1.

b) What was the RIN score of RNA used in each experiment?

We have performed experiment to assess the RIN score. The HEK293T RNA samples used in experiments are from the same batch. The RIN score of the batch is high as shown in Figure 2—figure supplement 1E, so the RNA integrity is assured.

c) How was the NEB library constructed? This is not mentioned in the Materials and methods section.

The NEB library was constructed according to the manufacturer’s instructions (NEB #E7770S). We have added several sentences in the revised manuscript (see the Materials and methods).

d) How is the annealing done for Tn5 oligos (concentration, time, temperature, buffers)?

10μM synthetic Tn5ME-A adapter or 10μM Tn5ME-B adapter were mixed with equal amount of Tn5ME-Rev oligos in annealing buffer (10 mM Tris–HCl pH 7.5, 10 mM NaCl). The two samples were both incubated in a PCR block starting at 95°C for 5min followed by decreasing gradient of 1°C per minute until 10°C. We have added several sentences in our revised manuscript (see the Materials and methods).

e) What is the full name and catalog # for the Tn5 purchased from Vazyme?

The full name of Vazyme Tn5 is “TruePrep Tagment Enzyme” and the catalog number is #S601-01 (see the Materials and methods).

f) How many reads are there for each library? Analyses should be done with the same number of raw reads per library by down-sampling.

Indeed, our analyses were done with the same number of reads per library. In terms of differential gene expression analysis, we down-sampled reads per library to 60 million. Otherwise, we down-sampled reads per library to 30 million.

g) Accession #'s for human rRNA should be listed.

We apologize for the missing information. The accession numbers for human rRNA we used are NR_003286.2, NR_003287.2, NR_003285.2, and X71802.1.

[Editors' note: further revisions were suggested prior to acceptance, as described below.]

Reviewer #1:

I appreciate that the authors went to a good deal of work to test the synthetic constructs that they describe. They note Ct values of 24 (active Tn5), 28 (inactivated Tn5), and 29 (negative control); however, they neglect to include a positive control. I am surprised, as this would be an easy addition – annealing a ssDNA to the other ssDNA template as opposed to RNA. As it stands, the ct of 24 seems very late for transposed product. Comparing to dsDNA will give a sense of the difference in efficiency between DNA/RNA hybrids and dsDNA. The other edits are fine, this is the last component I believe needs to be addressed.

We thank this reviewer for the suggestion. Per your request, we bought commercially available 150nt ssDNA strands and produced dsDNA by annealing the two strands. The 150 bp-hybrid was prepared as previously mentioned. We then subjected the prepared RNA/DNA hybrids and dsDNA to Tn5 transposome, and a blank control (without Tn5) followed by qPCR quantification. We observed that cycle threshold (Ct) value of the hybrid sample with Tn5 transposome treatment (Ct=22.68) is about 8 cycles smaller than the control sample (Ct=30.4), indicating that Tn5 has direct tagmentation activity towards RNA/DNA hybrids. We also observed that cycle threshold (Ct) value of the dsDNA sample with Tn5 transposome treatment (Ct=18.08) is about 4 cycles smaller than the hybrid sample with Tn5 transposome treatment (Ct=22.68), indicating that the efficiency of Tn5 towards hybrids is about 1/16 of that of dsDNA (Figure 1—figure supplement 1G). It should be noted that we previously conducted qPCR assay with templates diluted 1:600, which might be over-diluted and led to the previously observed Ct value (24.86). Now we are conducting the assay with templates diluted 1:100. We have incorporated all the above results into the revised manuscript (Figure 1—figure supplement 1G and 1H, Results section).

Reviewer #3:

General Assessment:

The revised manuscript is much improved. It was good to see the addition of the Smart-seq2 and rRNA depletion with TRACE-seq experiments. It is understandable that the authors could not add an experiment with a standard reference sample or spike-ins due to the COVID-19 outbreak. There are still issues remaining with respect to analysis, presentation, and conclusions.

Numbered summary of any substantive concerns.

1) The authors' use of housekeeping genes to assess correlation in gene expression measurements between different methods is acceptable, but these issues should be addressed.

a) The use of a set of housekeeping genes should be clearly identified in the Results section and the figure legends

We have included the words “a set of housekeeping genes” in the Results section and the figure legends in the revised manuscript.

b) The actual names of the housekeeping genes used should be listed in a Supplementary table rather than "list from Eisenberg and Levanon, 2013)" as in the Materials and methods section.

We have listed the names of the housekeeping genes in the Supplementary file 6.

c) They should also present the analysis with all the genes – noting that one example is shown in the authors' response to reviewers' comments.

We have presented the scatterplots with all genes as Figure 2—figure supplement 1C in the revised manuscript.

2) In several places, the authors minimize the underperformance of their TRACE-seq method. In each place, the authors should modify the text and include the actual numbers for the readers in the text. Finally, the text should be modified from "are comparable", "demonstrates comparable performance", and "shows comparable performance" to something more measured that lists the advantages and disadvantages.

We have modified the corresponding text to avoid the vague descriptions in the revised manuscript.

a) Coefficient of Variation is actually much worse (Figure 2—figure supplement 1D) not "slightly higher coefficient of variation".

We have modified the text and included the actual numbers of coefficient of variation in the revised manuscript.

b) 5' to 3' bias. This issue is not apparent here because of the use of high quality RNA (RIN 9.5), but with lower quality "real world" samples, the bias becomes more of an issue and the gene expression measurements will be affected. This should be noted in relation to the statement "In spite of the gene body coverage bias, the gene expression measurement (Figure 2E).… [is] unnoticeably affected.".

We have modified the text and reminded the readers to pay attention to the quality of RNA in the revised manuscript.

c) rRNA-aligned reads is actually ~100x worse for 200ng total RNA than for 10ng mRNA. That is not "slightly higher but acceptable". It is probably acceptable, but that's a judgement for the reader to make.

We have modified the text and included the actual percentage of rRNA contamination in the revised manuscript.

d) Strandedness. The authors now do mention this, but this is actually a significant drawback for RNA-Seq experiments.

We have modified the text to explicitly point out this drawback in the current version of TRACE-seq. We also discussed a potential approach to preserve the strand information.

3) The authors' explanation of the "per-position" analysis (Figure 2—figure supplement 2I) as still not clear about what is being shown or how it was calculated.

We apologize for the missing information. We have included more detailed information in the figure legend of Figure 2—figure supplement 1J in the revised manuscript.

4) The cost comparison between NEBnext and TRACE-seq is good, but the Smart-seq2 should be included and it is likely less expensive than either method ($10-15/library).

Firstly, we apologize for a mistake in the cost calculation of TRACE-seq in our previous manuscript. The cost of Tn5 per reaction of TRACE-seq should be $5.43 instead of $27.16. We previously divided the total price of Tn5 by the wrong number of rxn. The actual total cost of TRACE-seq should be $12.68 per reaction. Secondly, we found that the cost of Smart-seq2 in our lab should be $29.12, based on the commercially available reagents in China. This price is close to the cost ($35) previously reported (Supplementary table 5, Picelli S, Björklund Å K, Faridani O R, et al. Smart-seq2 for sensitive full-length transcriptome profiling in single cells[J]. Nature methods, 2013, 10(11): 1096-1098.). Overall, TRACE-seq is more cost-effective than NEBNext kit and Smart-seq2. We have included the cost of Smart-seq2 in the revised Supplementary file 4.

https://doi.org/10.7554/eLife.54919.sa2

Article and author information

Author details

  1. Bo Lu

    1. State Key Laboratory of Protein and Plant Gene Research, School of Life Sciences, Peking University, Beijing, China
    2. Peking-Tsinghua Center for Life Sciences, Peking University, Beijing, China
    Contribution
    Conceptualization, Validation, Investigation, Visualization, Methodology, Writing - original draft
    Contributed equally with
    Liting Dong, Danyang Yi and Meiling Zhang
    Competing interests
    No competing interests declared
    ORCID icon "This ORCID iD identifies the author of this article:" 0000-0002-5852-0477
  2. Liting Dong

    1. State Key Laboratory of Protein and Plant Gene Research, School of Life Sciences, Peking University, Beijing, China
    2. Peking-Tsinghua Center for Life Sciences, Peking University, Beijing, China
    Contribution
    Validation, Investigation, Visualization, Methodology, Writing - original draft
    Contributed equally with
    Bo Lu, Danyang Yi and Meiling Zhang
    Competing interests
    No competing interests declared
    ORCID icon "This ORCID iD identifies the author of this article:" 0000-0001-8396-374X
  3. Danyang Yi

    State Key Laboratory of Protein and Plant Gene Research, School of Life Sciences, Peking University, Beijing, China
    Contribution
    Validation, Investigation, Visualization, Methodology, Writing - original draft
    Contributed equally with
    Bo Lu, Liting Dong and Meiling Zhang
    Competing interests
    No competing interests declared
  4. Meiling Zhang

    State Key Laboratory of Protein and Plant Gene Research, School of Life Sciences, Peking University, Beijing, China
    Contribution
    Validation, Investigation, Methodology, Writing - review and editing
    Contributed equally with
    Bo Lu, Liting Dong and Danyang Yi
    Competing interests
    No competing interests declared
  5. Chenxu Zhu

    State Key Laboratory of Protein and Plant Gene Research, School of Life Sciences, Peking University, Beijing, China
    Contribution
    Conceptualization
    Competing interests
    No competing interests declared
    ORCID icon "This ORCID iD identifies the author of this article:" 0000-0003-4216-6562
  6. Xiaoyu Li

    State Key Laboratory of Protein and Plant Gene Research, School of Life Sciences, Peking University, Beijing, China
    Contribution
    Investigation
    Competing interests
    No competing interests declared
  7. Chengqi Yi

    1. State Key Laboratory of Protein and Plant Gene Research, School of Life Sciences, Peking University, Beijing, China
    2. Peking-Tsinghua Center for Life Sciences, Peking University, Beijing, China
    3. Department of Chemical Biology and Synthetic and Functional Biomolecules Center, College of Chemistry and Molecular Engineering, Peking University, Beijing, China
    Contribution
    Conceptualization, Supervision, Funding acquisition, Project administration, Writing - review and editing
    For correspondence
    chengqi.yi@pku.edu.cn
    Competing interests
    No competing interests declared
    ORCID icon "This ORCID iD identifies the author of this article:" 0000-0003-2540-9729

Funding

National Natural Science Foundation of China (31861143026)

  • Chengqi Yi

National Natural Science Foundation of China (91740112)

  • Chengqi Yi

Ministry of Science and Technology of the People's Republic of China (2019YFA0110900)

  • Chengqi Yi

Ministry of Science and Technology of the People's Republic of China (2019YFA0802201)

  • Chengqi Yi

National Natural Science Foundation of China (21825701)

  • Chengqi Yi

The funders had no role in study design, data collection and interpretation, or the decision to submit the work for publication.

Acknowledgements

The authors would like to thank Drs. Peng Du and Zhifang Zhang, Ms. June Liu for assistance with experiments and Mr. Dongsheng Bai for discussions. We thank National Center for Protein Sciences at Peking University in Beijing, China, for assistance with quantification of RNA/DNA hybrids, evaluation of tagmentation efficiency and library size distribution. Part of the analysis was performed on the High Performance Computing Platform of the Center for Life Science (Peking University). This work was supported by the National Natural Science Foundation of China (nos. 31861143026, 91740112 and 21825701 to CY) and Ministry of Science and Technology of China (nos. 2019YFA0110900 and 2019YFA0802201 to CY)

Senior Editor

  1. Kevin Struhl, Harvard Medical School, United States

Reviewing Editor

  1. Martha L Bulyk, Dana-Farber Cancer Institute, United States

Reviewers

  1. Andrew C Adey, Oregon Health & Science University, United States
  2. Bart Deplancke, EPFL, Switzerland

Publication history

  1. Received: January 6, 2020
  2. Accepted: July 22, 2020
  3. Accepted Manuscript published: July 23, 2020 (version 1)
  4. Version of Record published: August 4, 2020 (version 2)

Copyright

© 2020, Lu et al.

This article is distributed under the terms of the Creative Commons Attribution License, which permits unrestricted use and redistribution provided that the original author and source are credited.

Metrics

  • 11,667
    Page views
  • 1,146
    Downloads
  • 24
    Citations

Article citation count generated by polling the highest count across the following sources: Crossref, PubMed Central, Scopus.

Download links

A two-part list of links to download the article, or parts of the article, in various formats.

Downloads (link to download the article as PDF)

Open citations (links to open the citations from this article in various online reference manager services)

Cite this article (links to download the citations from this article in formats compatible with various reference manager tools)

  1. Bo Lu
  2. Liting Dong
  3. Danyang Yi
  4. Meiling Zhang
  5. Chenxu Zhu
  6. Xiaoyu Li
  7. Chengqi Yi
(2020)
Transposase-assisted tagmentation of RNA/DNA hybrid duplexes
eLife 9:e54919.
https://doi.org/10.7554/eLife.54919

Further reading

    1. Biochemistry and Chemical Biology
    Liam P Coyne, Xiaowen Wang ... Xin Jie Chen
    Research Article Updated

    Mitochondrial biogenesis requires the import of >1,000 mitochondrial preproteins from the cytosol. Most studies on mitochondrial protein import are focused on the core import machinery. Whether and how the biophysical properties of substrate preproteins affect overall import efficiency is underexplored. Here, we show that protein traffic into mitochondria can be disrupted by amino acid substitutions in a single substrate preprotein. Pathogenic missense mutations in ADP/ATP translocase 1 (ANT1), and its yeast homolog ADP/ATP carrier 2 (Aac2), cause the protein to accumulate along the protein import pathway, thereby obstructing general protein translocation into mitochondria. This impairs mitochondrial respiration, cytosolic proteostasis, and cell viability independent of ANT1’s nucleotide transport activity. The mutations act synergistically, as double mutant Aac2/ANT1 causes severe clogging primarily at the translocase of the outer membrane (TOM) complex. This confers extreme toxicity in yeast. In mice, expression of a super-clogger ANT1 variant led to neurodegeneration and an age-dependent dominant myopathy that phenocopy ANT1-induced human disease, suggesting clogging as a mechanism of disease. More broadly, this work implies the existence of uncharacterized amino acid requirements for mitochondrial carrier proteins to avoid clogging and subsequent disease.

    1. Biochemistry and Chemical Biology
    Ngozi D Akingbesote, Brooks P Leitner ... Rachel J Perry
    Research Article

    Metabolic scaling, the inverse correlation of metabolic rates to body mass, has been appreciated for more than 80 years. Studies of metabolic scaling have largely been restricted to mathematical modeling of caloric intake and oxygen consumption, and mostly rely on computational modeling. The possibility that other metabolic processes scale with body size has not been comprehensively studied. To address this gap in knowledge, we employed a systems approach including transcriptomics, proteomics, and measurement of in vitro and in vivo metabolic fluxes. Gene expression in livers of five species spanning a 30,000-fold range in mass revealed differential expression according to body mass of genes related to cytosolic and mitochondrial metabolic processes, and to detoxication of oxidative damage. To determine whether flux through key metabolic pathways is ordered inversely to body size, we applied stable isotope tracer methodology to study multiple cellular compartments, tissues, and species. Comparing C57BL/6 J mice with Sprague-Dawley rats, we demonstrate that while ordering of metabolic fluxes is not observed in in vitro cell-autonomous settings, it is present in liver slices and in vivo. Together, these data reveal that metabolic scaling extends beyond oxygen consumption to other aspects of metabolism, and is regulated at the level of gene and protein expression, enzyme activity, and substrate supply.