Lactoferricins impair the cytosolic membrane of Escherichia coli within a few seconds and accumulate inside the cell

  1. Enrico F Semeraro  Is a corresponding author
  2. Lisa Marx
  3. Johannes Mandl
  4. Ilse Letofsky-Papst
  5. Claudia Mayrhofer
  6. Moritz PK Frewein
  7. Haden L Scott
  8. Sylvain Prévost
  9. Helmut Bergler
  10. Karl Lohner
  11. Georg Pabst  Is a corresponding author
  1. University of Graz, Institute of Molecular Biosciences, NAWI Graz, Austria
  2. BioTechMed Graz, Austria
  3. Field of Excellence BioHealth – University of Graz, Austria
  4. Institute of Electron Microscopy and Nanoanalysis and Center for Electron Microscopy, Graz University of Technology, NAWI Graz, Austria
  5. Center for Electron Microscopy, Austria
  6. Institut Laue-Langevin, France
  7. Center for Environmental Biotechnology, University of Tennessee, United States
  8. Shull Wollan Center, Oak Ridge National Laboratory, United States

Abstract

We report the real-time response of Escherichia coli to lactoferricin-derived antimicrobial peptides (AMPs) on length scales bridging microscopic cell sizes to nanoscopic lipid packing using millisecond time-resolved synchrotron small-angle X-ray scattering. Coupling a multiscale scattering data analysis to biophysical assays for peptide partitioning revealed that the AMPs rapidly permeabilize the cytosolic membrane within less than 3 s—much faster than previously considered. Final intracellular AMP concentrations of ∼80–100 mM suggest an efficient obstruction of physiologically important processes as the primary cause of bacterial killing. On the other hand, damage of the cell envelope and leakage occurred also at sublethal peptide concentrations, thus emerging as a collateral effect of AMP activity that does not kill the bacteria. This implies that the impairment of the membrane barrier is a necessary but not sufficient condition for microbial killing by lactoferricins. The most efficient AMP studied exceeds others in both speed of permeabilizing membranes and lowest intracellular peptide concentration needed to inhibit bacterial growth.

Editor's evaluation

This article presents groundbreaking data on the effects of a family of antimicrobial peptides on bacterial cells, obtained by time-resolved small-angle X-ray and neutron scattering experiments coupled to stopped-flow mixing. Application of this approach to cells is highly innovative. The main result is that the peptides reach the cytosol in a few seconds, where their accumulation at high concentrations finally kills the bacteria.

https://doi.org/10.7554/eLife.72850.sa0

Introduction

Progress in designing antibiotics with novel key-lock mechanisms is not keeping pace with the worldwide growing number of (multi) resistant bacterial strains, encouraging significant research efforts in promising alternatives such as antimicrobial peptides (AMPs) (Lohner, 2001). AMPs are part of the natural innate immune system and provide a first line of defense against pathogens. Their advantage compared to conventional antibiotics relies on a rapid impairment of the barrier function of the bacterial envelope by unspecific physical interactions, often coupled to an ensuing targeting of bacterial DNA or ribosomes (for review, see, e.g., Wimley and Hristova, 2011; Lohner, 2017; Malanovic et al., 2020; Stella et al., 2021).

Membrane-active AMPs contain specific sequences of cationic and apolar amino acids, granting high affinity to the hydrophobic core of lipid membranes and selectivity toward the negatively charged surfaces of bacterial envelopes. However, despite intense research for several decades, a comprehensive understanding of the specific series of events that pertain to the bactericidal or bacteriostatic activity of AMPs is still elusive. To a large extent, this is due to the persisting challenge of merging results from in vitro studies with those obtained from lipid membrane mimics, often leading to significant controversies (Wimley and Hristova, 2011). This is nurtured, on the one hand, by difficulties in engineering lipid model systems of sufficiently high complexity to mimic the diverse physicochemical properties of bacterial membranes. On the other hand, the complexity of live bacteria challenges experimental and computational techniques to obtain quantitative results on the molecular level. For example, cryogenic transmission electron microscopy (TEM) provides high subcellular spatial resolution, but might give misleading information due to artifacts that potentially originate from staining or invasive sample preparation. Moreover, structural kinetics occurring in the seconds time scale are yet not accessible to cryo-TEM on cells, but would be needed to unravel the sequence of events induced by AMP activity. Kinetic experiments, using high-speed atomic force microscopy, for example, showed an AMP-induced corrugation of the bacterial outer surface within the first 13 s after addition of the AMP, but were limited by the intrinsic time resolution of the technique (Fantner et al., 2010). Additionally, such topological experiments do not provide insight into concurring intracellular changes. Video microscopy, combined with fluorescence labeling schemes for peptides or cellular content, in turn provided the appropriate spatiotemporal resolution to differentiate AMP activity in different cells within several tens of seconds (see Choi et al., 2016 for review). Importantly, such experiments reported that AMPs often reach the cytoplasm within a few minutes, suggesting that the final target for arresting bacterial growth or killing is not the cytoplasmic membrane (Sochacki et al., 2011). However, fluorescence labeling may easily tweak the delicate balance of macromolecular interactions and thus affect experimental observations.

Elastic X-ray and neutron scattering experiments are well-established noninvasive techniques to interrogate the structural properties of biological or biobased matter without the need to resort to any bulky labels. However, quantitative analysis of complex biologically relevant systems is challenging and has hampered progress in applying these techniques to live cells (Semeraro et al., 2021a). To this end, a full analysis of cells necessitates to account for structural features at diverse hierarchical levels. We recently refined an analytical multiscale scattering model of live Escherichia coli, making extensive use of the different sensitivities of X-rays and neutrons to matter, including H/D contrast variation (Semeraro et al., 2021b). This allowed us to detail the bacterial hierarchical structure on length scales bridging four orders of magnitude, that is, spanning from bacterial size to the molecular packing of lipopolysaccharides (LPS) in the outer leaflet of the outer membrane. Here, we use this model, taking advantage of the fact that the full breadth of structural information is encoded in a single scattering pattern, and exploit millisecond time-resolved synchrotron (ultra) small-angle X-ray scattering (USAXS/SAXS) to study the response of E. coli to three well-characterized lactoferricin-derived AMPs: LF11-215 (FWRIRIRR-NH2), LF11-324 (PFFWRIRIRR-NH2), and O-LF11-215 (octanoyl-FWRIRIRR-NH2) (Zweytick et al., 2011; Zweytick et al., 2014; Sánchez-Gómez et al., 2015; Marx et al., 2021b).

Joining these elastic scattering experiments with TEM and assays for determining peptide partitioning as a function of peptide activity enabled us to gain unprecedented insight into the peptide-induced sequence of events. We observed that the studied peptides are able to cause a loss of cytoplasmic content just within a few seconds. Coupling this finding to the derived final (after 1 hr) intracellular peptide concentrations at full bacterial growth inhibition (~80-100 mM) suggests a peptide uptake on similar time scales, and hence much faster than previously reported for other AMPs, such as rhodamine-labeled LL-37 (Sochacki et al., 2011). The most effective AMP presently studied, LF11-324, excelled others by most swiftly permeabilizing the cytoplamic membrane and killing the bacteria at the lowest cytosolic/periplasmic concentration. Consistent with previous studies on these AMPs (Zweytick et al., 2011), we also observed severe damage of the bacterial cell envelope—here defined in terms of loss of LPS packing, loss of positional correlations between outer and inner membranes and vesiculation/tubulation. Interestingly, this structural impairment of the bacterial envelope also occurred at peptide concentrations far below the minimum inhibitory concentration (MIC), but on different (slower) time scales than leakage. Leakage kinetics increased with peptide concentration up to the MIC. Yet, the overall loss of cytoplasmic molecules was not affected by AMP concentration, that is, it was equal at MIC and below (even at 1% growth inhibition!). The primary cause of bactericidal or bacteriostatic activity of the presently studied peptides is thus not a damage of the structural integrity of the cell wall, but appears to be due to a fast and efficient impairment of a series of here not further detailed physiological processes occurring within the intracellular space.

Results

Defining structural reference states of AMP activity in E. coli

Unraveling the timeline of structural events occurring in E. coli due to lactoferricin activity by USAXS/SAXS necessitates a detailed prior characterization of two reference states: (i) neat bacteria before AMP administration (‘initial state’) and (ii) AMP-affected/killed bacteria (‘end state’). Here, end state refers to 1 hr of incubation of bacteria at a given AMP concentration. Both states can be treated as quasi equilibrium structures, enabling a detailed characterization through a joint application of X-ray and neutron scattering. This allowed us to constrain parameters in the analysis of the time-resolved USAXS/SAXS data described further below. We have recently reported initial-state structures of E. coli ATCC 25922 (and other strains) at different hierarchical length scales—including size of bacteria, distance between inner and outer membranes, and LPS packing density—in terms of a multiscale analytical model using joint USAXS/SAXS and (very) small-angle neutron scattering (VSANS)/SANS experiments (Semeraro et al., 2021b). Importantly, while this analysis revealed a sensitivity of X-rays/neutrons to structural features of the cellular envelope or bacteria size, we also found that neither flagella or fimbriae, nor macromolecules located in the cytosol (DNA, ribosomes, proteins, etc.) contribute discernible scattering patterns and hence can be detected.

The same methodological concept was applied here to reveal the end-state structure of E. coli. Further, and analogously to Semeraro et al., 2021b, we coupled the USAXS/SAXS and SANS analysis to TEM in order to remove ambiguities in adjustable parameters originating from ensemble averaging (Figure 1). In order to couple scattering experiments to AMP susceptibility assays, it is important to scale peptide concentrations appropriately. Firstly, because SAXS/SANS experiments require up to 104 times higher bacterial concentrations than standard growth-inhibition experiments. Secondly, because the total number of AMPs partitioning into bacteria (and hence also their antimicrobial activity) depends on cell concentration in a nontrivial manner (Marx et al., 2021b). We consequently determined the MICs of all here-studied AMPs as a function of cell number density prior to scattering experiments; the corresponding data are reported in Figure 1—figure supplement 1.

Figure 1 with 4 supplements see all
Overview of combined X-ray scattering and electron-microscopy measurements.

(A) Mapping the main structural changes in E. coli ATCC 25922 (green symbols) upon 1 hr incubation with LF11-324 (red symbols) as observed by (ultra) small-angle X-ray scattering (USAXS/SAXS) and transmission electron microscopy (TEM). Scattering data of E. coli ATCC 25922 are from Semeraro et al., 2021b and have been obtained at 10-fold higher sample concentration, leading to the observed offset of scattered intensities. Black lines are the best fits using Equation 6. OMV: outer membrane vesicle formation; CWD: cell-wall damaging; SNR: phase separation of the nucleoid region. Error bars are given by the experimental error of the measurements. (B) TEM examples of membrane detachment and OMV formation due to LF11-324, and respective ensemble results from scattering data analysis for the distance distribution between inner and outer membranes. (C) Bacteria upon 1 hr incubation with O-LF11-215, showing the formation of tube-like protrusions.

Small-angle scattering (SAS) patterns of initial and end states showed distinct differences, which are highlighted in Figure 1—figure supplement 2E and F. Figure 1—figure supplement 2E, in particular, demonstrates a decrease of intensity at very low q-values (as approximation of forward scattering), and a faster intensity decay at high q for the end state, coupled to a loss of two intensity wiggles at q0.1nm-1 and q0.3nm-1 (see also Figure 1A). The comparison of SANS data at 90% D2O (Figure 1—figure supplement 2F) instead shows a smoothening of an intensity shoulder at q0.13nm1 coupled to a slight peak-shift toward lower q-values for the end state. The application of our previously developed analytical model for E. coli (Semeraro et al., 2021b) allowed us to gain detailed insight into the ultrastructural changes pertaining to these differences in scattered intensities. To achieve this goal, we jointly analyzed USAXS/SAXS and SANS data at five different contrasts (10, 30, 40, 50, and 90% D2O; see Figure 1—figure supplement 2). Taking AMP-induced changes of bacterial ultrastructure as observed by TEM into account then leads to the following observations.

Membrane ruffling, mainly originating from increased fluctuations of cytoplasmic membranes clearly seen by TEM, can be modeled by changing the average distance between inner and outer membranes and its fluctuation (Figure 1B), which readily accounts for the above-described change of the SANS feature in Figure 1—figure supplement 2F. Consistent with previous reports (Sochacki et al., 2011), we also observed an overall shrinking of bacterial size. This correlates with a loss of periplasmic or cytosolic material. Both effects explain the changes in USAXS intensity at very low q-values (Figure 1—figure supplement 2E).

The scattering shoulder in USAXS/SAXS data at q0.07nm1 originates from positional correlations between LPS oligosaccharide cores, as revealed by our previous in-depth analysis (Semeraro et al., 2021b). Its smearing out in the presence of peptide consequently indicates a loss of LPS packing correlations, either because of a decrease of the number of LPS molecules on the outer surface or due to increased membrane roughness or waviness. This effect occurs on sub-nanometer length scales and is thus hidden from TEM. Notably, the end-state scattering patterns in the presence of either LF11-324 or LF11-215 were identical, despite their distinct MIC values (data not shown). Modeling their scattering data revealed an additional contribution, which we could associate with the help of TEM to the formation of outer membrane vesicles (OMVs), having an average diameter of ~30 nm (Figure 1A and B, Figure 1—figure supplement 2E). Instead, the separation of the nucleotide region from the nucleotide-free cytosol revealed by TEM (Figure 1A), and in agreement with a previous report on same AMPs (Zweytick et al., 2011), is not observed in our scattering data. As noted above, SAS is not sensitive to macromolecules and aggregates thereof inside the cell (Semeraro et al., 2021b). Finally, O-LF11-215 led to additional effects. First of all, O-LF11-215, because of its increased hydrophobicity, forms aggregates in buffer as clearly shown by SAXS (Appendix 1). In particular, incubating O-LF11-215 with bacteria at concentrations needed for SAS experiments led to the formation of macroscopic aggregates, which impeded the measurements of end states by SAS. TEM experiments, however, showed the formation of extramembranous tubes (Figure 1C).

All end-state SAS data were fitted with our analytical model using a Monte Carlo genetic-selection algorithm; see Figure 1—figure supplement 4 for a graphical scheme of all adjustable parameters. Compared to standard least-square algorithms, this allowed us to obtain robust parameter values from probability density functions and to judge possible parameter correlations (for details, see ‘Materials and methods’). Based on our previous modeling of neat E. coli (Semeraro et al., 2021b), the individual SANS contrasts (Figure 1—figure supplement 2A) are motivated as follows: (i) the distance between the inner and outer membranes ΔOM and its fluctuations, σOM, is accentuated at 90, 50, and 40% D2O; (ii) 30–50% D2O highlight the scattering length density (SLD) balance between the cytosol ρCP, periplasm ρPP, and the peptidoglycan layer ρPG; and (iii) 10% D2O yields a similar contrast than X-ray and thus provides a direct and independent control for USAXS/SAXS experiments. Table 1 summarizes the results of this analysis for LF11-324 by listing the changes between initial and end states. As discussed above, our analysis also reports overall bacterial size changes. E. coli are reasonably well represented in reciprocal space using an ellipsoid with multiple shells to account for the different compartments (Semeraro et al., 2021b). Since our smallest probed scattering vector, qmin3×10-3nm-1 (corresponding to distances of about 2 µm), does not allow to probe the full length of the bacteria, we report size changes in terms of changes of the minor radius of the ellipsoid and, in particular, that of the cytoplasmic space R. The major radius was coupled to R by fixing the major to minor radius ratio, ε, to a value of 2 (see Table 2). Finally, the USAXS/SAXS scattering shoulder at q0.07 nm1 reports on positional correlations between LPS oligosaccharide cores (Semeraro et al., 2021b). In our analytical model, this is captured by the number of oligosaccharide cores (OS), NOS. To characterize the peptide-induced changes, we define the LPS packing parameter, pLPS=NOS/NOS0, as the ratio between the number of OS (i.e., LPS) in the current and initial state (NOS0). Other parameters of the analytical model, such as the thicknesses of the hydrophobic and hydrophilic layers of the cytoplasmic and outer membranes, as well as their average SLDs, the thickness of the peptidoglycan layer, and the radius of gyration of the oligosaccharides, were fixed at the same values as reported in Semeraro et al., 2021b (see also Tables 2 and 3). We additionally checked for contributions of peptides to the SLDs of each bacterial compartment, including cytoplasmic (CM) and outer membranes (OM). However, the associated changes were found to be insignificant.

Table 1
Change of E. coli structure due to LF11-324 ([P]MIC) as observed from USAXS/SAXS/SANS data analysis.

Values are the difference between end- and initial state. See a graphical scheme of the adjustable parameters in Figure 1—figure supplement 4, and Semeraro et al., 2021b for a more detailed schematic.

ParametersValuesDescription
ΔρCP×104(nm2)–0.17 ± 0.02*; –0.14 ± 0.05†ρCP → SLD of cytoplasmic space
ΔρPP×104(nm2)0.18 ± 0.06*; 0.12 ± 0.04†ρPP → SLD of periplasmic space
ΔΔOM(nm)6 ± 3ΔOM → inter-membranes distance
ΔσOM(nm)3.4 ± 1.7σOM→ SD around ΔOM
ΔρPG×104(nm2)–0.27 ± 0.07*; –0.59 ± 0.14†ρPG→ SLD of peptidoglycan layer
ΔpLPS–0.44 ± 0.08*; –0.26 ± 0.11pLPS → LPS packing parameter
ΔR(nm)–27 ± 7R → minor radius of the cytoplasmic space
  1. Differences in X-ray and neutron SLDs are due to different physical interactions with matter. In case of pLPS, this originates from a biological variation of different bacterial cultures.

  2. USAXS/SAXS: (ultra) small-angle X-ray scattering; SANS: small-angle neutron scattering; SLD: scattering length density; LPS: lipopolysaccharide.

  3. *

    From SAXS.

  4. From SANS (SLDs were obtained by extrapolating to 0 wt% D2O); see Figure 1—figure supplement 2B–D.

The observed LF11-324-induced changes to E. coli show, upon the application of our model, a decrease of ρCP, along with the increase of ρPP, signifying leakage of mainly low-weight molecules and ions from the cytoplasm (Figure 1—figure supplement 2B and C), whose scattering dominate both ρCP and ρPP (Semeraro et al., 2021b). Surprisingly, final ρCP and ρPP values did not depend on peptide concentration, that is, were equal within experimental uncertainty at MIC and sub-MICs (see Figure 2B). The overall increase of the distance between inner and outer membranes, ΔOM, corresponds to about 18%; its fluctuations σOM increase by almost a factor of two. The associated disorder in the periplasm then also accounts for the drop of the contrast of the peptidoglycan layer ρPG by about 2.6%. The LPS packing parameter, pLPS, instead drops dramatically by 30–40%. Finally, the observed cell shrinkage amounts to ∼5%, which leads to a decrease of cell surface of approximately 2 ×10⁶ nm2. Apparently this is at least in part compensated by OMV formation; indeed the overall cell-surface decrease is on the same order of magnitude as the estimate of the total surface of all OMVs of (2-6)×106 nm2 as obtained from analyzing SAS data (see Appendix 2).

Figure 2 with 6 supplements see all
Kinetics of the bacterial structural response upon addition of peptide.

(A–F) Kinetics of the bacterial structural response to attack by LF11-324; results for three different peptide concentrations are shown. Lipopolysaccharide (LPS) packing (A); cytoplasm and periplasm scattering length density (SLD) (B); minor radius of the cell (C); intermembrane distance (∼ periplasm thickness) (D) and its deviation (E); and peptidoglycan SLD (F). (G–I) Bacterial response to O-LF11-215 at two concentrations. LPS packing (G); cytoplasm and periplasm SLDs (H); and minor ellipsoidal radius of the cell (I). Thick gray bands mark the degree of confidence from bacterial systems w/o peptides (see Table 1 and Semeraro et al., 2021b), except for (C) and (I), where they refer to the average of the current cell radii at Δt=0.0175s. Fluctuations of initial values can be due to biological diversity. The vertical gray grid (A, D–F) indicates the time range of local (A) and macroscopic (D–F) cell-wall damage. Note that this range does not depend on peptide concentration. Colored lines in (B) mark the concentration-dependent lower boundary for the onsets of leakage. Results at Δt=1 hr refer to end states, when available. Error bars are given by the associated standard deviations of the adjustable parameters obtained from the analysis of scattering curves.

Kinetics: Time-resolved USAXS/SAXS

The structural transitions from initial to end state were followed by USAXS/SAXS at millisecond time resolution. Stopped-flow mixing ensured thorough and rapid re-dispersion (mixing time of 50 ms) of peptides and bacteria (Figure 2—figure supplement 1) and led to immediate changes of scattering patterns. Using the initial and end-state values obtained for the adjustable parameters as constraints allowed us to fit kinetic scattering data as detailed in the ‘Materials and methods’. A close examination of the results obtained for the three LF11s (Figure 2, Figure 2—figure supplement 2, and Figure 2—figure supplement 3) allowed to discern AMP concentration-independent parameters (pLPS, ΔOM, σOM, and ρPG) from AMP concentration-dependent parameters (ρCP, ρPP, and R).

First, we focus on LF11-324 and AMP concentration-independent parameters. The packing of LPS started to decrease at Δt10s after mixing (Figure 2A). Changes of ΔOM, σOM, and ρPG in turn are largely decoupled from this remodeling of the outer membrane, with a common onset of 2–10 min after peptide addition (Figure 2D–F). AMP concentration-dependent parameters instead showed an increasing delay of changes upon decreasing the amount of administered peptide (Figure 2B and C). In particular, ρPP exhibited a pronounced increase already at Δt3s at highest peptide concentration shifting to Δt2 min at the presently lowest studied peptide concentration. The onset times of decrease of ρCP do not appear to be directly correlated with these changes, but also shifted progressively to later times with decreasing AMPs. Because of the dominant contribution of low-molecular-weight molecules and ions to both ρCP and ρPP (Semeraro et al., 2021b), we surmise that these changes are due to a leakage of inner and outer membranes. Briefly, the cytoplasmic content diffuses first in the periplasmic space and, simultaneously, material from the periplasm leaks out of the cell. This process leads to the rather simultaneous decrease of ρCP and increase of ρPP. Because of differences in the individual onsets of these trends at a given AMP concentration, we can only associate a time range for the beginning of permeation of the cytoplasmic membrane: 3–10 s at [P]=1.2×MIC, 10–20 s at [P]=0.7×MIC, and 50–120 s at [P]=0.3×MIC. Despite these differences, and as noted above, ρCP (and ρPP) reached the same final values for all three AMP concentrations. Finally, the drop of R started at 20–50 s for [P]=1.2×MIC and 0.7×MIC, and >10 min for [P]=0.3×MIC (Figure 2C).

Interestingly, LF11-215 led to almost identical kinetics for the concentration-independent parameters (ΔOM, σOM, and ρPG in Figure 2—figure supplement 2A–C and pLPS in Figure 2—figure supplement 3A). This suggests that LF11-215 and LF11-324 remodel the membranes and affect the macroscopic stability of the cell envelope in a very similar fashion, although we found no decrease of pLPS for LF11-215 at [P]=1.6×MIC (Figure 2—figure supplement 3A). Importantly, ρCP and ρPP started to change much later for this peptide (Δt2050s at 1.6×MIC, Figure 2—figure supplement 3B). The overall changes of ρCP and ρPP indicate, however, that the AMP concentration-induced loss of cytoplasmic content is a common feature of LF11-324 and LF11-215.

The kinetics of the cell-envelope damage caused by O-LF11-215 were found to proceed analogously to both LF11-324 and LF11-215 (Figure 2—figure supplement 2D–F). However, while changes of ρCP and ρPP occurred at about similar times than for LF11-324 (Figure 2B and H), pLPSt ~ 2 min, Figure 2G) and Rt ~ 10 min, Figure 2I) changed much later. The initial increase of pLPS is likely to be an artifact, probably due to the convolution of scattering originating from cells and peptide aggregates (see Figure 2—figure supplement 1D).

LF11-215/LF11-324-induced OMV formation was discernible for Δt > 1–2 min (Figure 3A) and appears to be peptide- and concentration-independent within the first 10 min. Finally, the peptide cluster term, introduced for the analysis of O-LF11-215 (see ‘Materials and methods’), enabled us to estimate that a large increase of peptide uptake starts after about 2 min, which, however, did not depend on peptide concentration (Figure 3B).

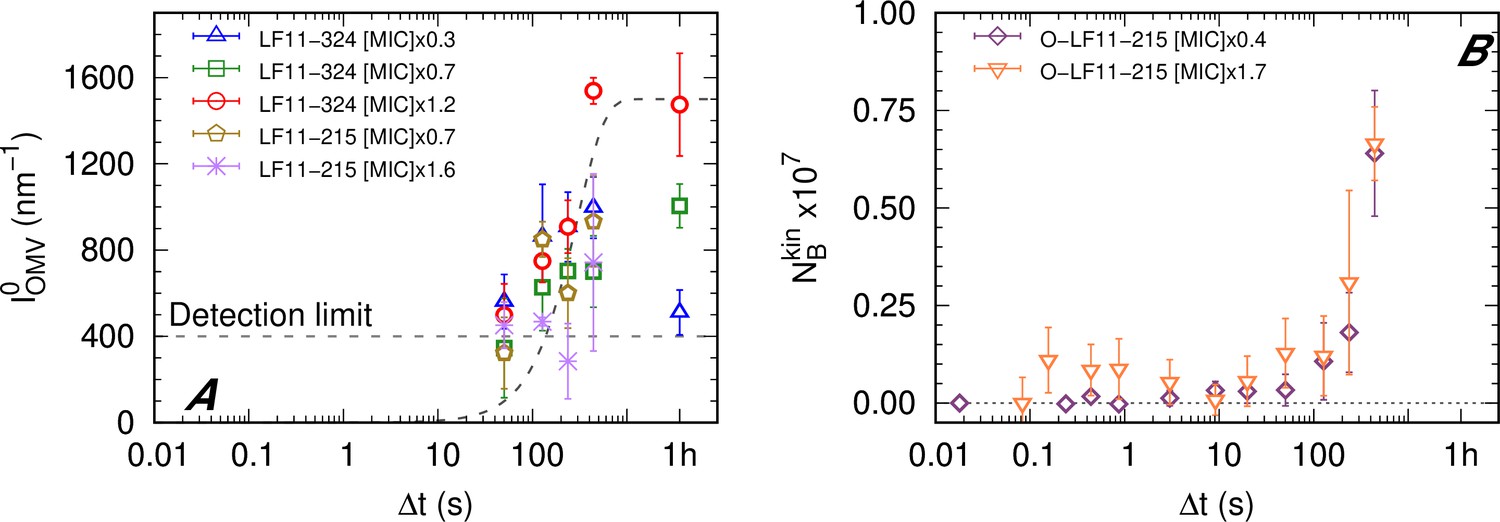
Kinetics of outer membrane vesicle formation and O-LF11-215 absorption.

(A) Kinetics of the forward intensity of outer membrane vesicle (OMV) scattering for different concentrations of LF11-324 and LF11-215. The dashed horizontal line represents the detection/’visibility’ limit, below which Icell(q)+IOMV(q)Icell(q) in the entire q-range. The dashed exponential curve is a guide for the eyes. (B) Evolution of the number of partitioned peptides per cell for two O-LF11-215 concentrations, as calculated from the analysis of Iclu. Error bars are derived from the associated standard deviations of the adjustable parameters obtained from the analysis of scattering curves.

Peptide partitioning and cooperativity

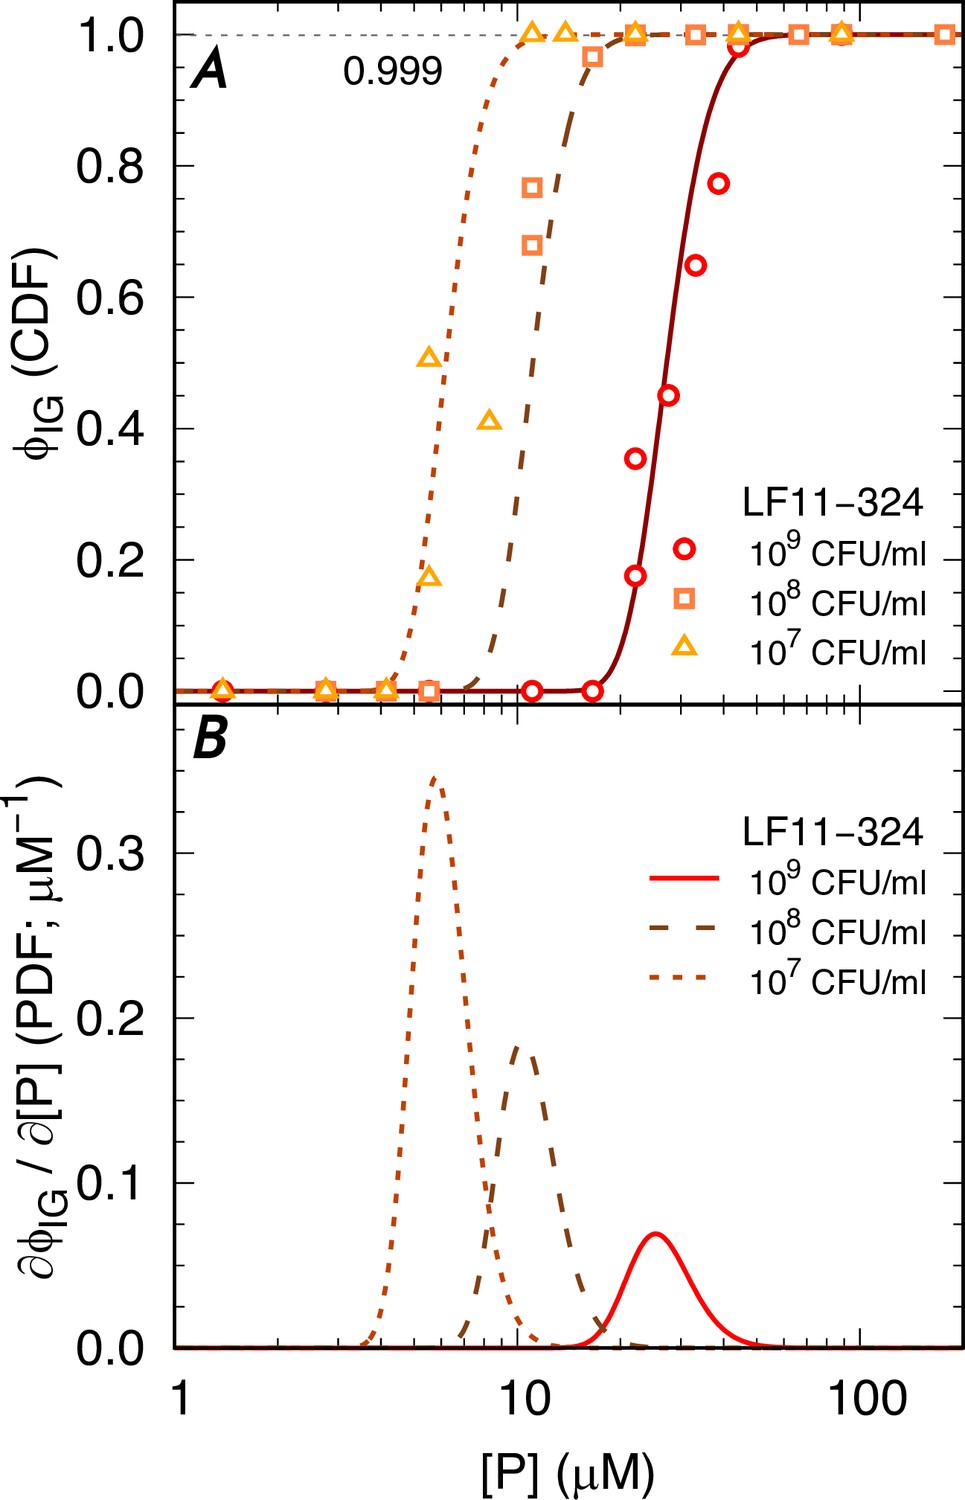
We applied a previously detailed assay for AMP partitioning in E. coli based on growth inhibition (Marx et al., 2021b). A statistical analysis of the corresponding data in terms of cumulative distribution functions (CDFs, see Appendix 3) allowed us to derive probability density functions (PDFs), describing bacterial growth inhibition as a function of cell concentration ncell, including the minimum AMP concentration needed for inhibiting a given percentage x of E. coli, ICx (Figure 4); note that MICIC99.9. We obtained Poisson-like PDFs of ‘killing’ events as a function of peptide concentration from the sigmoidal shapes of the measured CDFs (Appendix 3). Besides the specific mode of action of a peptide, the shape, width, and position of the PDFs are a result of intrinsic statistical variations and fluctuations of the systems’ properties, for example, bacterial size, stage of mitosis, local concentration of partitioned peptides, biological variability within the populations, etc.

Figure 4 with 1 supplement see all
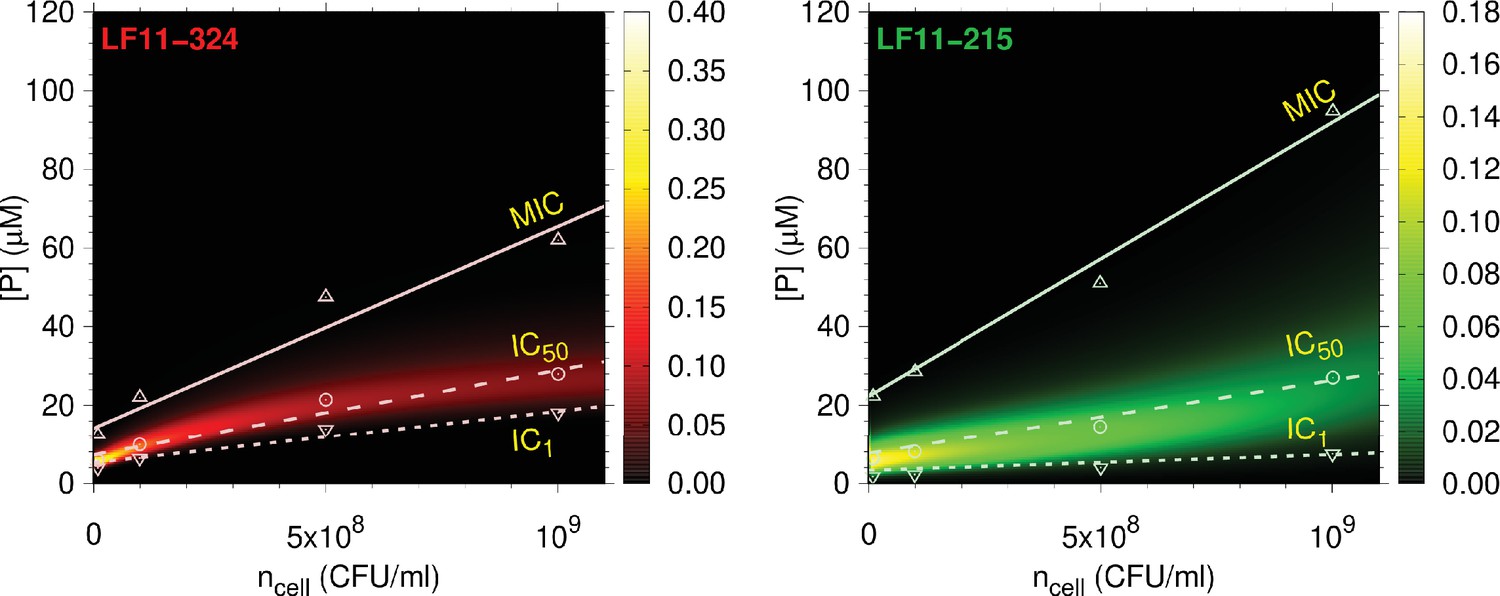
Full partitioning maps for LF11-324 and LF11-215.

Amount of LF11-324 or LF11-215 required to attain growth-inhibited fractions of either 0.999 (minimum inhibitory concentration [MIC], up triangles), 0.5 (circles), or 0.01 (down triangles) in E. coli ATCC 25922 as a function of ncell. Lines are fits with Equation 1. These data are overlaid with a surface plot of the associated killing probability density function. The color scales indicate the corresponding magnitudes.

In agreement with our previous report for E. coli K12 (Marx et al., 2021b), the MIC of LF11-324 is lower than that of LF11-215 at all cell concentrations. For O-LF11-215, MIC values matched those of LF11-324 at low cell concentrations, but increased strongly with ncell, finally superseding that of LF11-215 and becoming immeasurably high due to the above-described peptide aggregation (Figure 1—figure supplement 1). The growth inhibition probabilities for LF11-324 and LF11-215 peak close to the IC50s (Figure 4). The distributions are much sharper, that is, have a smaller full-width-at-half-maximum (FWHM) of the probability distributions, σ[P], for LF11-324 than for LF11-215. This suggests an increased ‘cooperativity’ of killing for LF11-324, in the sense of a two-state transition model between alive and dead bacteria (see Appendix 3). σ[P] increased with cell concentration, for example, from σ[P]2.6M at ncell=107 CFU/ml to σ[P]13M at ncell=109 CFU/ml for LF11-324. Significant noise levels in growth inhibition data for O-LF11-215 impeded a determination of killing probabilities at inhibitory concentrations <IC50. However, data retrieved at higher inhibitory concentrations suggest that the probability distributions roughly match those of LF11-324 at low cell concentrations, but become broader than that of LF11-215 at high cell content (Figure 4—figure supplement 1). This is a signature of loss of killing efficacy at high ncell, most likely due to peptide self-aggregation as discussed above.

Next, we derived for each IC x (or growth-inhibited fraction, ϕIG) the average number of cell-partitioned peptides, NB, and the effective partitioning coefficient, Keff, applying a previously reported thermodynamic formalism (Marx et al., 2021b; see also Equation 1). NB increased for all three peptides with ϕIG, although the changes of NB were smallest for LF11-324, followed by LF11-215 and O-LF11-215 (Figure 5A). These results were confirmed independently also by Trp-fluorescence spectroscopy (see Appendix 4).

Figure 5 with 2 supplements see all
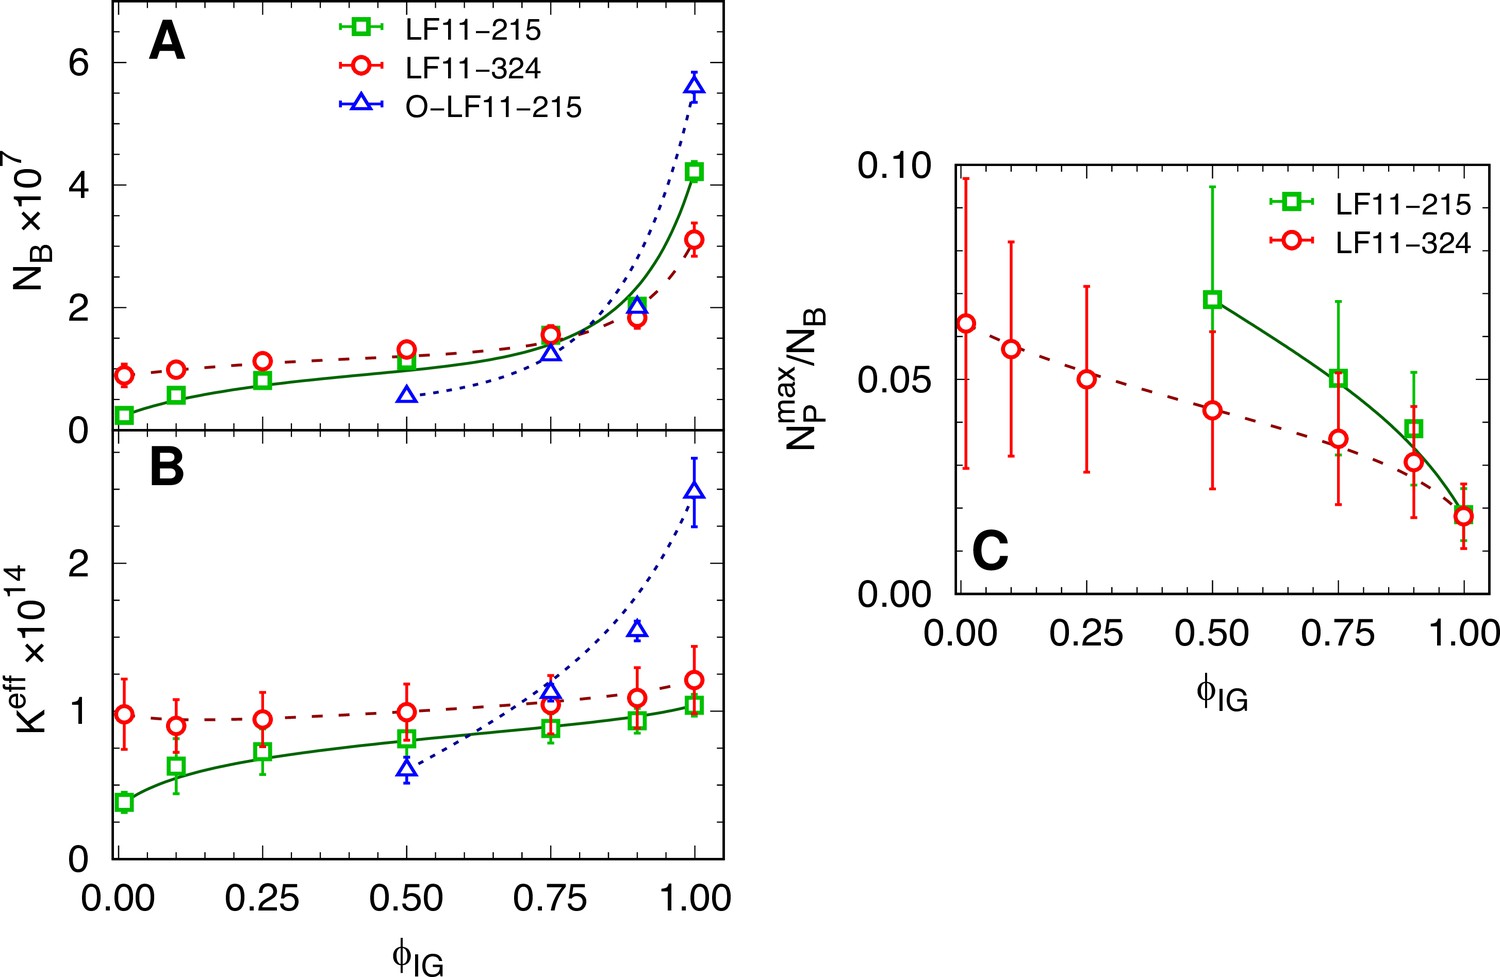
Partitioning parameters as a function of cell-growth inhibition.

(A, B) NB and Keff values as a function of inhibited fraction. In the case of O-LF11-215, NBNBeff. (C) Ratio between the maximum number of peptides on the outer leaflet and total number of partitioned peptides, NPmax/NB, as a function of inhibited fraction. Lines are guides for the eye. Error bars in panel (A and B) are given by the associated standard deviations of the adjustable parameters obtained from the analysis of the equi-activity assay. In panel (C) the errors are given by combining errors shown in panel (A) with the experimental error propagated from ζ-potential measurements (see Figure 5—figure supplement 1).

This partitioning behavior was also mirrored in the ϕIG dependence of Keff. Keff was nearly constant for LF11-324, increased only slightly for LF11-215, and showed the largest variation for O-LF11-215, reaching about 2.5 times higher levels than the other two peptides (Figure 5B). The approximate equal Keff values of LF11-324 and LF11-215 for ϕIG>0.5 demonstrate that both peptides partition about equally well into E. coli, not only at the MIC, but in a wide range of ϕIG values.

ζ-potential measurements were performed ∼5 min and 1 hr (end state) after adding AMPs. Results did not show significant differences for the two time points. This enabled us to further discriminate the activities of LF11-324 and LF11-215. We observed an initial increase of ζ/ζ0 (ζ0 refers to the reference system, i.e., neat bacteria) at low peptide concentrations, reaching plateau values of ζ/ζ0=0.80±0.16 for LF11-215 and ζ/ζ0=0.85±0.17 for LF11-324 for [P]0.3×MIC (Figure 5—figure supplement 1). As detailed in Marx et al., 2021b, these data allowed us to calculate the maximum number of peptides associated to the LPS leaflet, NPmax. We found NPmax=(8±2)×105 and (6±2)×105 for LF11-215 and LF11-324, respectively, in the ζ/ζ0 -plateau regions. Normalizing these results by the number of cell-partitioned peptides (NB) reveals an overall decrease of NPmax/NB with ϕIG (see Figure 5C). Note that the ζ-potential analysis provides (with the applied mathematical and physical constrains) upper-boundary values for NPmax/NB (see ‘Materials and methods’). That is, NPtrue/NBNPmax/NB. Thus, our conservative NPmax/NB ratio strikingly demonstrates that most of the peptides are located within the intracellular compartments of E. coli at the MIC. The fraction of outer-leaflet-partitioned peptides increased toward lower ϕIG, and somewhat stronger for LF11-215, but does not exceed 10%. An analogous analysis for O-LF11-215 was impeded by the peptide aggregates, whose sizes were in the same order or even larger than that of bacteria (Figure 5—figure supplement 2).

Discussion

The entire set of the above-detailed results reveals a complex scenario that needs to be evaluated with utmost care. To this end, we stress that all techniques used in this work report ensemble averages. That is, they account for the entire bacterial population within the samples. For example, an LPS packing value of pLPS0.55—observed for growth-inhibited fractions of 1%, as well as 99.9% after 1 hr (Figure 2A)—signifies that the ensemble average shows the same loss of LPS packing under both conditions, irrespective of individual differences in some isolated cells.

A particularly striking result for the LF11-215/LF11-324 end states is that the peptide-induced effects are similar and independent of peptide concentration (Figures 1 and 2). That is, even at growth-inhibited fractions of just 1%, we observed much the same cellular permeabilization and structural changes of the bacterial ultrastructure as at quasi fully growth-inhibited E. coli (see also Figure 4 and Figure 4—figure supplement 1). Here, it is important to bear in mind that, unlike our susceptibility assays, we did not add a growth medium after incubation with peptides in SAS experiments. Our combined SAS and growth inhibition data provide unambiguous evidence that bacteria are able to recover at sub-MIC concentrations from a severe collateral damage of their cell envelope. Consequently, this damage cannot be the primary killing cause of bacteria. Our structural studies only revealed peptide-specific and concentration-dependent effects for the kinetics of R, ρCP, and ρPP (Figure 2). It is unlikely though that antimicrobial activity is specific to the rate of bacteria size changes. In turn, the different onsets of changes of ρCP and ρPP may provide some clues to events that finally inhibit the growth of E. coli. In what follows, we will thus focus on the sequence of events that can be deduced from our study for LF11-324 and LF11-215. Before doing so, we note that also O-LF11-215 caused comparable variations of the abovementioned parameters on similar time scales. In this case, however, an equally detailed analysis was impeded by the propensity of O-LF11-215 to aggregate in buffer solution.

Figure 6 provides a scheme of the timeline of events revealed by this study, taking also into account our complementary experiments on peptide partitioning. Within a few seconds, LF11-324 and LF11-215 cause changes of the LPS packing density (Δt ~ 10 s), as well as periplasmic and cytoplasmic SLDs. Since ions and small molecules (<1 kDa) are the major contributors to its X-ray SLD (Semeraro et al., 2021b), the decrease of ρCP will be dominated by a leakage of these entities (e.g., ATP). Molecules leaking from the cytosol first diffuse into the periplasm and then further into extracellular space, leading to a net increase of ρPP. Leaking into extracellular space follows from the observation that final ρPP levels do not reach those of ρCP, despite the much larger reservoir for cytosolic molecules. Further, the initial SLDs of buffer and periplasm are comparable, also explaining why our technique is not directly detecting outer membrane leakage. Hence, either observed change of ρPP or ρCP is due to a permeabilization of both cytoplasmic and outer membranes.

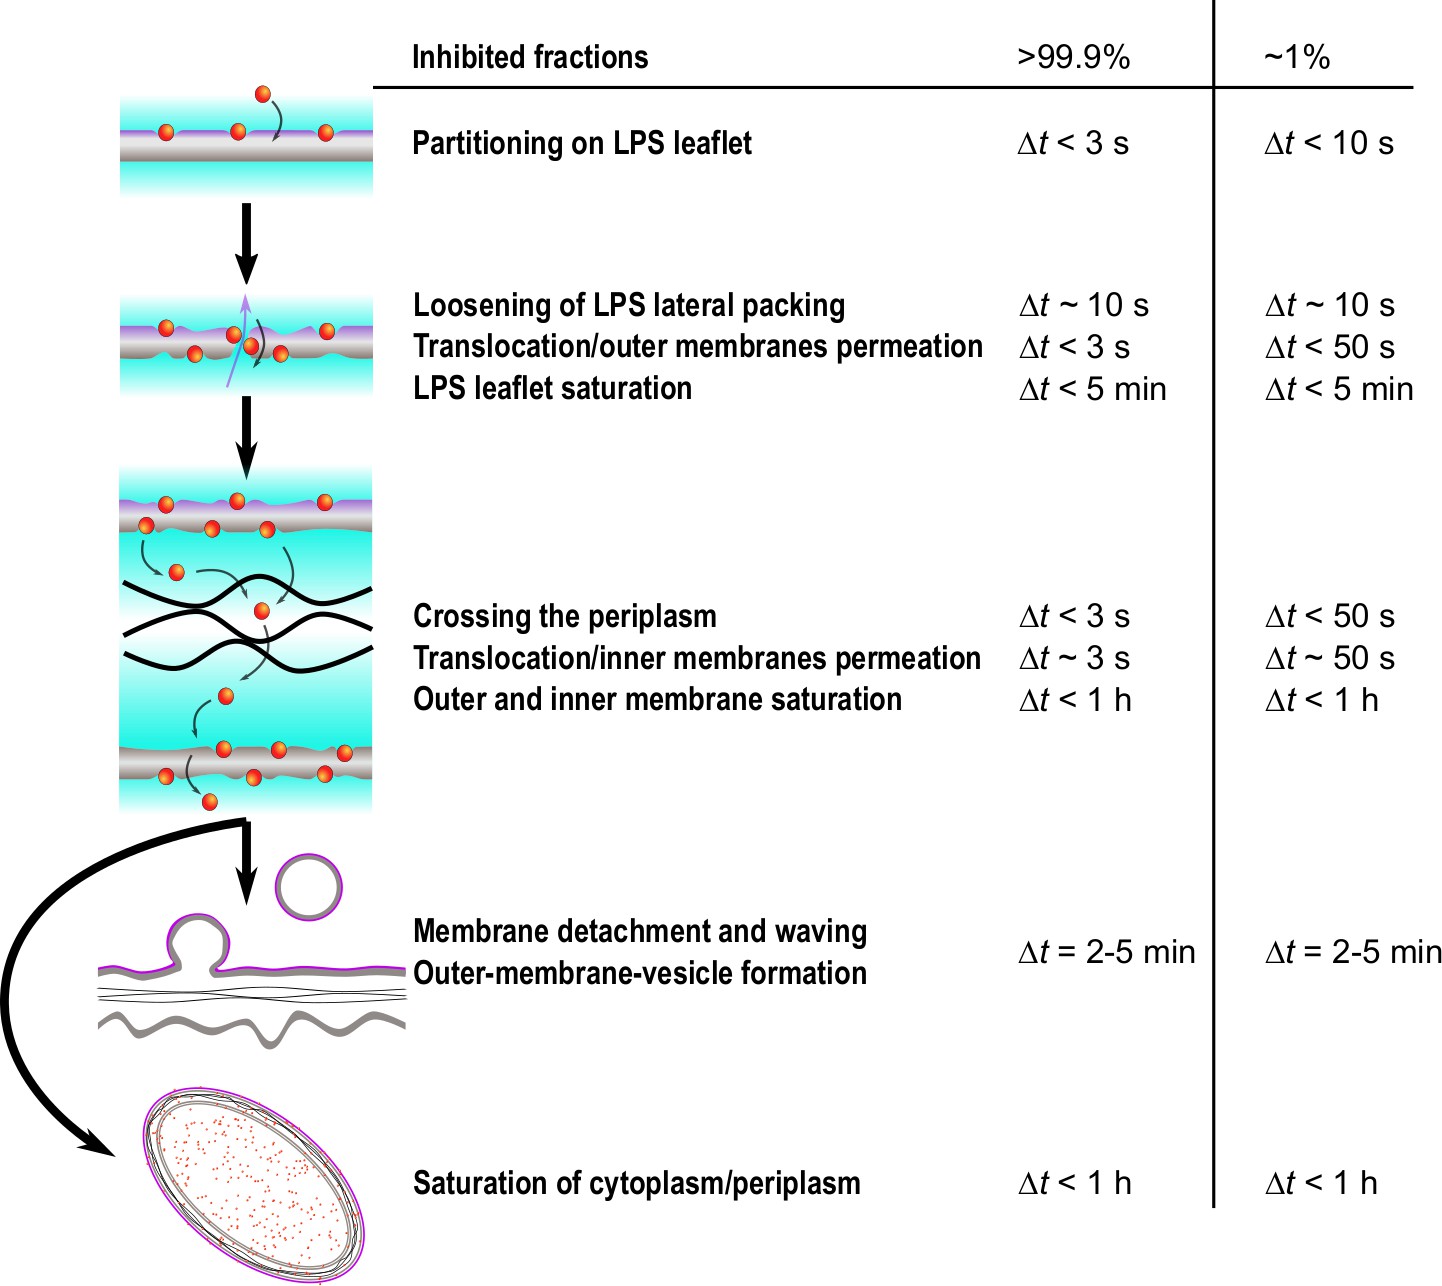
Simplified time sequence of LF11-215 and LF11-324 mode of action.

The measured time onsets and boundaries refers to LF11-324 at minimum inhibitory concentration (MIC) ×0.3 and MIC ×1.2, which correspond to measured inhibited fractions of ~1 and > 99.9%, respectively. The outer leaflet is affected by peptides within the first seconds after their attack. Then, depending on antimicrobial peptide (AMP) type and concentration, a number of rare translocation events, coupled with leakage, take places over a broad time range. When both membranes are saturated with peptides (exact time not determined), the cell wall breaks down, leading to outer membrane vesicle (OMV) formation (Δt>10s), detachment of outer and inner membranes and waving (Δt>25min). Simultaneously, AMPs accumulate in internal compartments and reach saturation levels within less than 1 hr.

For LF11-324, the permeabilization of the cytoplasmic membrane occurred as fast as 3–10 s after mixing at [P] = 1.2× MIC. Dropping peptide concentration led to a slowing down of this effect (10–20 s for [P] = 0.7× MIC, and 50–120 s for [P] = 0.3× MIC), but did not affect the final cytoplasmic density, that is, the overall loss of material (Figure 2). AMPs need to translocate all the way through the cell wall in order to induce such effects, implying that peptide translocation of the outer membrane proceeds on time scales faster than ΔρPP or ΔρCP. We stress that the usage of the term ‘translocate’ does not imply that AMPs are able to pass through inner and outer membranes without any noticeable effect on membrane structure, such as the transient formation of pores, nor does it exclude their presence. It merely refers to a generic, unspecified uptake of the peptides beyond the resolution of the present experiments. Further, since we are not able to discriminate membrane peptide adsorption kinetics from the onset of leakage of cellular content, we cannot comment on a potential ‘carpet mechanism,’ proposed from analogous AMP partitioning studies in bacteria (Roversi et al., 2014; Savini et al., 2020). We note, however, that LF11-215 was found to partition into artificial lipid membranes, without noticeable effects on lipid flip-flop (Marx et al., 2021a). We detail this discussion further below.

The drop of R is a natural consequence of the loss of cellular content, but occurs at somewhat later times. This delay is most likely due to the stored elastic energies of the peptidoglycan layer, which will initially resist rapid deformations (Yang et al., 2018). Note, however, that the peptidoglycan properties are likely affected by direct interactions with peptides (Zhu et al., 2019). Remarkably, cytoplasmic membrane leakage in the MIC range occurs ~1 min later for LF11-215 (Figure 2—figure supplement 3).

Pronounced differences between LF11-324 and LF11-215 were also observed from their efficacies as a function of cell concentration (Figure 4). At equal ncell, growth-inhibition probability distributions are much narrower for LF11-324. Apparently, this increased ‘cooperativity’ correlates with the peptide’s ability to permeabilize the cytoplasmic membrane faster. It is further illuminating to discuss the total amount of peptide penetrating into the intracellular space. Both peptides saturate the outer LPS leaflet already at concentrations lower than 0.3× MIC (Figure 5—figure supplement 1), corresponding to about one AMP per 4–5 LPS molecules as upper-bound value (see NPmax/NLPS0 in ‘Materials and methods’). Thus, consistent with Figure 2A and B, peptides penetrate the outer membrane already when the effects on bacterial growth are still very small. Assuming that the inner leaflet of the outer membrane, as well as the two leaflets of the inner membrane, host to first-order similar amounts of LF11-324 and LF11-215, we calculate that ≥92% of all peptides are located in the intracellular space at the respective MICs. Using our USAXS/SAXS/DLS data for the average cytoplasmic and periplasmic volumes, we further arrive at huge intracellular concentrations of ~80 mM for LF11-324 and ~100 mM for LF11-215. The relative difference in cytosolic/periplasmic concentrations between the two peptides corresponds to about the relative difference in MICs (Figure 1—figure supplement 1). Our finding that only a minor fraction of the peptides is located within the membranes remains valid even at sub-MIC values, offering an attractive explanation for the similar and concentration-independent average cell-wall damage-induced LF11-324 and LF11-215. Specifically, we propose that this damage (LPS packing, OMV formation, membrane ruffling and detachment) is a consequence of the small fraction of peptides that saturate the membranes and, possibly, the peptidoglycan layer. Following the thermodynamic principles of the partitioning framework and ζ-potential measurements, this small fraction is supposed to be rather constant above AMP concentrations of about 0.2× MIC. Along these lines, recent in-cell FRET experiments showed that only a small fraction of the peptides partitioned in a cell is actually interacting with the bacterial surface (Kaji et al., 2021).

About 10 years ago, Wimley, 2010 already discussed the consequences of having 107 to 109 AMPs per cell, suggesting a ‘reservoir’ of non-membrane-bound peptides that would outnumber proteins, ATP, and other metabolites. Cytosolic targets were also confirmed by our TEM data (and those of others; Hammer et al., 2010; Scheenstra et al., 2019) showing a collapsed nucleoid region (Figure 1). For instance, this could be due to a competition mechanism with polyamines as putative stabilizers of the functional architecture of the DNA ring (Hou et al., 2001). In support of the hypothesis of cytosolic targets, recent solid-state 31P-NMR measurements of E. coli in the presence of AMPs revealed increased dynamics of DNA and RNA phosphate groups correlated to TEM observations of collapsed nucleoid volume (Overall et al., 2019). In addition, however, AMP interactions with other negatively charged metabolites and macromolecules in the cytosol, such as ribosomes and proteins, should be considered as potentially detrimental to bacteria (Zhu et al., 2019). The about 1.4 times lower intracellular concentration of LF11-324 then is a signature of a higher potency compared to LF11-215, possibly hampering a number of physiological functions (Scocchi et al., 2016), or inducing an apoptosis-like mechanism (Dwyer et al., 2012) due to interactions with any of the above-named cytosolic molecules. The exact killing mechanism of the here-studied AMPs, however, evades current experimental design.

It follows from the considerations above that bacteria have an increased probability to recover from the peptides’ attack if the intracellular concentrations of LF11-324 and LF11-215 fall below those reported above (i.e., 80 and 100 mM, respectively). Thus, both the ability of LF11-324 to swiftly permeabilize the cytoplasmic membrane by translocating through the cell envelope and its higher propensity to interfere with physiological processes contribute to its higher ‘cooperativity’ in killing E. coli (Figure 4). Our experimental setup is not sensitive to directly observe either transient membrane pores or other membrane defects. Note, however, that previous studies in lipid-only mimics of bacterial membranes showed only weak membrane remodeling effects of lactoferricin derivatives compared to other peptides (Zweytick et al., 2011; Marx et al., 2021b). We propose that the here-studied LF11s follow the interfacial activity hypothesis, valid for both antimicrobial (Wimley, 2010) and cell-penetrating peptides (Kauffman et al., 2015). That is, they are able to locally and transiently induce disorder in the lipids’ hydrocarbon chain regime, which sufficiently affects the permeability barrier of the bilayer against ions, small polar molecules, and, eventually, the peptides themselves. This might be also a consequence of the rather short amino acid sequence of the lactoferricin derivatives, implying a too small length (~1 nm) to span the whole membrane thickness (3–4 nm). In turn, the highly flexible secondary structure and an amphipathic moment being aligned along the peptide’s backbone (Zorko et al., 2009; Zweytick et al., 2011; Zweytick et al., 2014) should allow LF11-324 and LF11-215 to translocate membranes at higher rates than observed for linear peptides (Ulmschneider, 2017; Kabelka and Vácha, 2018). Note that peptide translocation can also lead to transient membrane leakage events (Ulmschneider, 2017), even with negligible AMP-induced lipid flip-flop (Marx et al., 2021a). The higher hydrophobicity of O-LF11-215 should increase the likelihood of remaining membrane bound, which might build up differential membrane curvature stress and lead to the observed formation of membrane tubules. We also note that the different leakage kinetics for the LF11 peptides suggest a coupling to translocation kinetics, which in turn depends on membrane partitioning of the AMPs. Indeed, recently reported data for cytoplasmic membrane mimics of cardiolipin, phosphatidylethanolamine, and phosphatidylglycerol show a somewhat faster membrane partitioning for LF11-324 than for LF11-215 (Marx et al., 2021b).

In conclusion, the superior time resolution and sensitivity to ensemble averaged structural changes from cellular size to molecular packing of synchrotron USAXS/SAXS allowed us to demonstrate, upon combination with advanced data modeling and complementary techniques for peptide partitioning, that LF11-based AMPs are able to reach the cytosolic membrane of bacteria on the seconds time scale and subsequently accumulate at high concentrations (80–100 mM) in all bacterial compartments, including the cytosol. Based on differences observed for LF11-324 and LF11-215, two factors emerge as key components for their antimicrobial efficacy: (i) a fast translocation through inner and outer membranes, and (ii) an efficient shutdown of here not further detailed vital chemical/biochemical processes, that is the lower the number of ‘needed’ AMPs the better (here achieved by LF11-324). The latter conclusion is corroborated by the most striking fact that the final cell-wall damage does not depend on peptide concentration. That is, AMPs inhibiting only 1% of bacteria induce on average—besides some single isolated variations—as much membrane ruffling, detachment of inner and outer membranes, leakage, etc., as AMPs at full levels of growth inhibition. Hence, the collateral damage of the cell-wall structure, including leakage of cellular content, is a ‘by-product’ of AMP activity. Instead, we suggest that the primary cause of growth inhibition is driven by interactions of the AMPs with yet-to-be-determined cytosolic/periplasmic molecules. Most likely candidates are the polyanionic DNA, RNA, ribosomes, and proteins (Zhu et al., 2019), or charged metabolites. We strongly emphasize that the ability of the here-studied peptides to impair the barrier function of bacterial membranes remains an unquestioned highly important property. However, at the same time our study shows that this effect alone is not sufficient to explain all of our data.

It is currently not clear whether the present findings can also be extended to other AMPs. Yet, the importance of the cell-penetrating ability was similarly discussed for, for example, peptides Sub3 and LL-37 (Torcato et al., 2013; Zhu et al., 2019). Further, a number of AMPs have been reported to show partitioning behavior in bacteria and accumulation in the intracellular volume analogously to the here-studied lactoferricin derivatives (see, e.g., Sochacki et al., 2011; Zhu et al., 2019; Savini et al., 2020; Loffredo et al., 2021; Kaji et al., 2021, and references therein). Le et al., 2017 gave a more complete account of potential intracellular targets of AMPs—either of fundamental or secondary importance for bactericidal activity. We thus propose that the combination of membrane translocation speed and efficient impairment of physiological processes are generic factors that should be considered in designing future AMPs to combat infectious diseases. This also implies a widening of the pure focus on membrane activity of AMPs currently applied in many studies.

Materials and methods

Samples

E. coli ATCC 25922 were provided by the American Type Culture Collection (Manassas, VA). Freeze-dried peptide powders of LF11-215 (H-FWRIRIRR-NH2), LF11-324 (H-PFFWRIRIRR-NH2), and O-LF11-215 (octanoyl-FWRIRIRR-NH2), purity >95%, were purchased from the Polypeptide Laboratories (San Diego, CA). Lysogeny broth (LB)-agar and LB medium were obtained from Carl Roth (Karlsruhe, Germany). All the other chemicals were purchased from Sigma-Aldrich (Vienna, Austria).

Bacterial cultures

Request a detailed protocol

Bacterial colonies of E. coli ATCC 25922 were grown in LB-agar plates at 37°C. Overnight cultures (ONCs) were prepared by inoculating a single colony in 3 ml LB-medium in sterile polypropylene conical tubes (15 ml), allowing for growth under aerobic conditions for 12–16 hr in a shaking incubator at 37°C. Main cultures (MCs) were then prepared by diluting ONCs in 10 ml LB-medium in 50 ml sterile polypropylene conical tubes. Bacteria in the MCs grew under the same conditions applied to ONCs up to the middle of the exponential growth phase. Cells were then immediately washed twice and resuspended in nutrient-free and isotonic phosphate-buffered saline (PBS) solution (phosphate buffer 20 mM, NaCl 130 mM) at pH 7.4.

AMP samples

Request a detailed protocol

LF11-324 and O-LF11-215 peptides displayed a weak solubility in PBS. AMP stocks (including LF11-215) were then prepared by adding acetic acid and DMSO, up to 0.3 and 3% vol/vol, respectively. Peptide stock solutions were diluted for measurements yielding a final concentration of 0.01% acetic acid and 0.1% vol/vol dimethyl sulfoxide (DMSO) (final pH 7.2). Hence, possible effects of DMSO on the cell envelope, as observed for model membrane structures (Gironi et al., 2020), can be neglected. Control USAXS/SAXS experiments adding a similar amount DMSO and acetic acid to E. coli also showed no discernible effect of the organic solvent (data not shown). Similarly, control experiments were performed to exclude effects on bacterial growth. Stock concentrations were determined by measuring the absorption band of the Trp residues with the spectrophotometer NanoDrop ND-1000 (Thermo Fisher Scientific, Waltham, MA). Peptide stock solutions were stored in silanized glass tubes until use.

Antimicrobial activity and partitioning modeling

The antimicrobial activity of the AMPs on E. coli was tested in the bacterial concentration range of 5 × 10⁵ to 109 CFU/ml using a modified susceptibility microdilution assay (Jorgensen and Ferraro, 2009). Cell suspensions were incubated with AMPs in buffer at a given peptide and cell concentration for 2 hr at 37°C (control samples were incubated in buffer only). Cell growth was monitored upon addition of double concentrated LB-medium for about 20 hr using a Bioscreen C MBR (Oy Growth Curves Ab, Helsinki, Finland).

Partitioning modeling

Request a detailed protocol

The analysis of the inhibited fraction of cells, ϕIG, as a function of the total concentration of peptides, [P], enabled the extraction of ICx values as a function of ncell, as detailed in Appendix 3. Following previously reported methods to determine peptide partition in liposomes (White et al., 1998) or bacterial systems (Savini et al., 2017), we derived the number of cell partitioned AMPs for a given ICx value using

(1) [P](ncell)=NB[W]Keff[P]W+NBNAncell[P]B=NBNA(NA[W]Keff+ncell),

where [P]W and [P]B are the concentrations of AMPs dispersed in the aqueous phase and segregated into the cells, respectively; NA is the Avogadro’s constant; [W] is the concentration of water molecules in bulk (55.3 M at 37°C); Keff is the effective mole-fraction partitioning coefficient; and NB is the average number of peptide monomers that are partitioned within a single cell. Details of this analysis are reported in Marx et al., 2021b.

A similar approach was exploited in the case of O-LF11-215 peptide clusters in solution. In this case, the total peptide concentration is given by [P]=[P]W+[P]B+N[A], where [A] is the molar concentration of aggregates, each of them consisting of an average number of peptides N. We also define the aggregate fraction fA=N[A]/[P] and assume the equilibrium state N[P]W[A]. The definition of the molar partitioning coefficient KxKeff(Marx et al., 2021b) refers to the balance of concentration of free peptides in bulk and partitioned peptide into the cells. Hence, its bare definition is unaffected by the presence of clusters. Finally, it is trivial to show that in this case Equation 1 becomes

(2) [P](ncell)=NBNA(1-fA)(NA[W]Keff+ncell)=NBeffNA(NA[W]Keff+ncell),

where the fitting parameter NBeff is an upper boundary value for the actual number of partitioned peptides per cell NB=NBeff(1-fA).

ζ-potential, cell size, and outer leaflet distribution of peptides

Request a detailed protocol

ζ-potential and dynamic light scattering (DLS) measurements were carried out with the Zetasizer Nano ZSP (Malvern Panalytical, Malvern, UK). E. coli suspensions were incubated with different concentrations of AMPs in buffer for 1 hr at 37°C prior to each measurements. Control samples (no AMPs) were suspended and incubated in buffer. Measurements were also repeated just after mixing with peptides (about 5 min waiting time for sample loading, data not shown), exhibiting negligible variation from samples incubated for 1 hr. A concentration of 107 CFU/ml provides the optimal compromise between high signal-to-noise ratio and low multiple-scattering bias. The AMP concentrations were centered on the MIC values previously determined with the susceptibility microdilution assays, spanning from about 0.2× to 2.5× MIC. For ζ-potential measurements, the voltage for the electrodes was set to 4 V, such that currents did not exceed 1 mA, because of the high conductivity of the PBS buffer. Further, measurements were paused between repetitions for 180 s. This prevented heat productions, leading to sample denaturation and accumulation on the electrodes. The experiments were repeated three times, and, due to the low sensitivity of such a setup, each of them consisted of a minimum of six measurements (see also Marx et al., 2021b). For each system, ζ-potential values and associated errors were given by the medians and the median absolute deviations, respectively, averaging over at least 18 repetitions. The same number of scans was also used to obtain mean and standard deviation values for the hydrodynamic diameter, dH, of the cells.

From the measured ζ-potential values, we calculated the maximum number of peptides that partition into the outer LPS leaflet, NPmax, as reported recently (Marx et al., 2021b)

(3) NPmaxNLPS0(zLPSzP)(ζζ0SS0-1),

where zLPS=-6 (Wiese et al., 1998) and zP=+5 (Zweytick et al., 2011) are the nominal charges of LPS and LF11-215 or LF11-324 AMPs, respectively; ζ and S are the ζ-potential and total surface values of the system upon addition of peptides; and ζ0 and S0 are the respective reference values (no AMPs). NLPS00.9S0/ALPS is the estimated number of LPS molecules, where ALPS1.6nm2 (Kim et al., 2016; Micciulla et al., 2019) is the lateral area per LPS molecule. The prefactor originates from considering a maximum surface coverage of 90% by LPS molecules (Seltmann and Holst, 2002). S0 was derived from DLS measurements, approximating the bacterial shape by a cylinder dH/2(radius)2/2+(length)2/12, considering that the hydrodynamic radius is approximately equivalent to the radius of gyration for micron-sized objects. Then fixing the radius at ~400 nm (Semeraro et al., 2021b) and retrieving the length from the above relation for dH one obtains S05×106nm2.

Fluorescence spectroscopy

Fluorescence spectroscopy experiments were done with the Cary Eclipse Fluorescence Spectrophotometer (Varian/Agilent Technologies, Palo Alto, CA). The excitation wavelength was set to λ = 280 nm (which corresponds to the maximum intensity of the absorption/excitation band of Trp), and emission spectra were acquired in the λ-range between 290 and 500 nm, with the Trp emission band peak being expected to lie around 330–350 nm. Samples were loaded in quartz cuvettes of 1 cm path length. The background was subtracted from every Trp spectrum prior to further analysis.

Peptide solubility

Request a detailed protocol

Trp emission allowed determining whether LF11 peptides form aggregates or not in the MIC range. Spectra of LF11-only samples at [P] = 100 µg/ml were fitted with the log-normal-like function (Burstein and Emelyanenko, 1996; Ladokhin et al., 2000):

(4) I(I0,λ,Γ)={I0exp[ln2ln2αln2(1+(λλmax)yΓ)],λ>(λmaxyΓ)0,λ(λmaxyΓ)

where λmax and I0 are, respectively, wavelength and intensity of the emission peak; Γ is the FWHM of the band; α is a skewness parameter (fixed at an optimum value of 1.36 after testing; and y=α/(α2-1)).

Both LF11-215 and LF11-324 (see Appendix 1) showed a peak at about λmax353 nm and Γ63 nm. This is consistent with a location of the Trp residues in polar chemical environments having full mobility and thus suggests that these AMPs are monomeric (Burstein and Emelyanenko, 1996). In contrast, the acylated O-LF11-215 showed a significant blue shift related to a location of Trp within apolar surroundings (Ladokhin et al., 2000), indicating the formation of peptide aggregates.

Peptide partitioning

Request a detailed protocol

Analogously to the partitioning analysis performed for lipid-only membranes (Marx et al., 2021b), the Trp emission of bacteria/AMPs mixtures were treated as a two-component signal, one coming from the peptides in the aqueous phase, and the second one from AMPs interacting with the cells.

Bacterial suspensions were incubated with different concentrations of AMPs in buffer for 1 hr at 37°C (incubator Thermomixer C, Eppendorf, Germany). Reference samples (no AMPs) were suspended and also incubated in PBS. Experiments were performed at cell concentrations of 5 × 10⁷, 108, and 5 × 10⁸ CFU/ml, and AMPs amounts equal to 0.5×, 1×, and 2× MIC (each experiment was repeated three times). Fluorescence intensities were background-subtracted using the bacteria-only reference spectra at the corresponding concentrations. This enabled us to subtract the average signal from the aromatic residues in the cells, and the scattering arising from the high concentration of the cell suspensions. Emission spectra of bare bacterial systems surprisingly showed a single and clean Trp-emission band, peaking at λmax=334-336 nm (Γ65 nm). The peak intensity increased linearly from 4.9 (arb. units) at 107 cells/ml to 122 (arb. units) at 5 × 10⁸ cells/ml; then turbidity effects had to be accounted for. LF11-215 and LF11-324 showed peaks of comparable intensities even in the high cell-concentration regime, enabling us to retrieve background-subtracted spectra of optimal signal-to-noise ratio. Spectra were analyzed with a linear combination of two independent bands (see Equation 4) IW and IB, referring to AMPs in bulk (W) and partitioned into the lipid bilayer (B). λW and ΓW were fixed to the reference values obtained by analyzing spectra from pure AMPs, and I0W, I0B, λB, and ΓB were freely adjusted. LF11-only solutions were measured to calibrate their intensity dependence in buffer. Then, the retrieved I0W values were converted to the concentration of dissociated peptides [P]W. This allowed us to obtain the so-called peptide bound fraction as fB=1-[P]W/[P] (see Appendix 4). The aggregation of O-LF11-215 led to low λmaxW values (see Appendix 1) and precluded a similar analysis for these peptides.

Transmission electron microscopy

Request a detailed protocol

E. coli suspensions at 5 × 10⁸ CFU/ml were mixed with peptides at the corresponding MICs and 0.5× MICs in PBS, and incubated for 1 hr at 37°C (incubator Thermomixer C, Eppendorf, Germany). Control samples (no AMPs) were suspended and incubated in PBS. Cell suspensions were centrifuged at 1300 × g for 4 min in 1.5 ml Eppendorf tubes and resuspended (fixed) in 3% vol/vol glutaraldehyde and 0.1 M cacodylate buffer to bring the rapid cessation of biological activity and to preserve the structure of the cell. After fixation, the samples were washed and postfixed in 1% vol/vol OsO4 in 0.1 M cacodylate buffer. Dehydration was carried out in an ascending ethanol series followed by two steps with propylene oxide (Hayat, 1989) and embedded in Agar Low Viscosity Resin (Agar Scientific, Stansted, UK). Ultrathin sections (70–80 nm) were prepared on an Ultramicrotome UC6 (Leica Microsystems, Vienna, Austria) equipped with a 35° Ultra Diamondknife (Diatome, Nidau, Switzerland). The grids were poststained with Uranyless (Science Services, Munich, Germany) and lead citrate according to Reynolds (Hayat, 1989). TEM images were acquired with Tecnai T12 at 120 kV (TFS, Warmond, Netherlands).

Small-angle scattering

(Ultra-) small-angle X-ray scattering

Request a detailed protocol

USAXS/SAXS measurements were performed on the TRUSAXS beamline (ID02) at the European Synchrotron Research Facility (ESRF), Grenoble, France. The instrument uses a monochromatic beam (λ = 0.0995 nm) that is collimated in a pinhole configuration. Measurements were performed with sample-to-detector distances of 30.8 and 3.0 m, covering a q-range of 0.001–2.5 nm–1 (Narayanan et al., 2018). Two-dimensional scattering patterns were acquired on a Rayonix MX170 detector, normalized to absolute scale, and azimuthally averaged to obtain the corresponding one-dimensional USAXS/SAXS profiles. The normalized cumulative background from the buffer, sample cell, and instrument were subtracted to obtain the final I(q). Bacterial samples (ncell109 CFU/ml) were incubated with peptides in buffer for 1 hr at 37°C and directly measured in a quartz capillaries of 2 mm diameter (37°C), mounted on a flow-through setup in order to maximize the precision of the background subtraction. Time-resolved experiments were instead performed with a stopped-flow rapid mixing device (SFM-3/4 Biologic, Seyssinet-Pariset, France), with 50 ms mixing of bacterial and peptides stock suspensions (37°C), and enabling data acquisition after a kinetic time of about 2.5 ms (Narayanan et al., 2014). A total of 50 frames was recorded for each experiment with an exposure time of 0.05 s and a logarithmic time-spacing ranging from 17.5 ms to about 10 min. Radiation damage tests were performed on reference systems prior to setting this X-ray exposure times. The scattering intensities were further corrected for sedimentation and background scattering from the stopped-flow cell.

Contrast-variation small-angle neutron scattering

Request a detailed protocol

SANS experiments were performed on the D11 instrument at the Institut Laue-Langevin (ILL), Grenoble, France, with a multiwire 3He detector of 256 × 256 pixels (3.75 × 3.75 mm2). Four different setups (sample-to-detector distances of 2, 8, 20.5, and 39 m with corresponding collimations of 5.5, 8, 20.5, and 40.5 m), at a wavelength λ = 0.56 nm (Δλ/λ = 9%), covered a q-range of 0.014–3 nm–1. Two distinct E. coli suspensions were incubated with peptides LF11-215 and LF11-324 in buffer for 1 hr at 37°C. The bacterial concentration during the incubation was 109 CFU/ml, and both peptide concentrations were in the range of the measured MICs. Samples were then washed and resuspended in five different PBS solutions, containing 10, 30, 40, 50, or 90 wt% D2O. Samples (ncell1010 CFU/ml) were contained in quartz Hellma 120-QS banjo-shaped cuvettes of 2 mm pathway and measured at 37°C. Cuvettes were mounted on a rotating sample holder, which prevented the bacteria from sedimenting. Data were reduced with the Lamp program from ILL, performing flat field, solid angle, dead time, and transmission correction. Further data were normalized by the incident neutron flux (via a monitor) and corrected by the contribution from an empty cell. Experimental setup information and data are available at https://doi.ill.fr/10.5291/ILL-DATA.8-03-910 .

Note that the present experimental time (~2 hr) is much shorter than the onset of cell lysis (Zweytick et al., 2011). As control, SANS measurements were repeated at extended times after mixing with the AMP in order to test for sample stability (data not shown), in terms of shape, cell-wall structure, and densities. The scattering intensities after 2, 4, 6, and 8 hr were comparable (with the exception of a weak decrease of ρCP between 2 and 4 hr). Further, a comparison with TEM and SAXS data suggests that the peptide-induced cell damage does not progress any further after 1 hr.

Data analysis: Peptide clusters

Request a detailed protocol

Reference O-LF11-215 samples were measured in the MIC range to investigate the microstructure of the peptide clusters. The SAXS pattern of O-LF11-215 was fitted with the equation

(5) Iclu(q)=IAMP0e-(qRg)2/3(1+IPq-f),

where the term in brackets is related to the structure of the aggregates, and the exponential Guinier function accounts for the form factor of their subunits of radius of gyration Rg (Zemb and Lindner, 2002), and IAMP0 is forward scattering intensity. The function IPq-f is the Porod law that describes the high-q asymptotic trend of scattering signal from the aggregates (Glatter et al., 1982), where IP is a scaling factor that depends on the surface properties of the aggregates, and f is related to their fractal dimension (Sorensen, 2001; see Appendix 1).

Data analysis: Bacterial modeling

Request a detailed protocol

X-ray and neutron scattering data were jointly analyzed with a recently reported analytical scattering model (Semeraro et al., 2021b). USAXS/SAXS patterns of end states displayed an excess scattering contribution between q ∼ 0.1–0.2 nm–1 in the case of LF11-215 and LF11-324, not visible in the corresponding SANS patterns. Note that SANS experiments were conducted on samples that were washed and resuspended in different D2O-containing buffer, while SAXS data were acquired immediately after 1 hr incubation with peptides. Together with the observation of OMVs by TEM (Figure 1), this suggests that the additional scattering contribution in SAXS data could be due to freely diffusing OMVs in the suspension medium.

All scattering data were fitted with the analytical functions

(6) I(q)={Icell(q)[Neutron data]Icell(q)+ncellIOMV0[3j1(qROMV)]2[X-ray data]Icell(q)+Iclu(q)[O-LF11-215 data],

where Icell(q) is the scattering form factor for E. coli, as reported in Semeraro et al., 2021b, and 3j1(qROMV) is the form factor of a sphere of radius ROMV, with j1 being the normalized spherical Bessel function of order 1. The prefactor IOMV0=NOMVVOMV2ΔρOMV2 is the OMV forward scattering, where NOMV, VOMV, and ΔρOMV are, respectively, their number, volume, and SLD difference to the buffer. The choice of a simple spherical form factor was driven by its simplicity for checking whether bacteria and OMVs have to be considered as noninteracting scatterers or not. Tests using an interaction cross-term approximating budding OMVs by spheres decorating a larger surface (Larson-Smith et al., 2010) did not result in significant contributions, confirming the dominance of freely diffusing OMVs. Note also that the IOMV0 values were independent of the shape of the normalized form factor as they include our estimation of VOMV and ΔρOMV (Appendix 2). Finally, in the case of SANS data, instrumental smearing was taken into account. Data were fitted with a convolution of I(q) and a Gaussian function with q-dependent width values, as provided by the reduction tools at D11. In USAXS/SAXS data, the smearing effect was negligible.

After thorough testing, the analysis of SAS data (end states and kinetics) was conducted using only seven adjustable parameters describing Icell(q). These were the number of LPS molecules, NOS; the cytoplasm radius, R; the SLDs of the cytoplasmic, ρCP, and periplamic space, ρPP; the periplasmic average thickness, ΔOM, and its deviation, σOM; and the SLD of the peptidoglycan layer, ρPG. Additionally, IOMV0 and ROMV were fitted for scattering intensities in the presence of LF11-215 and LF11-324, while IAMP0 was used and adjusted in the case of O-LF11-215. Other parameters of Iclu(q) were fixed according to the O-LF11-215 alone systems (see Table 1). This allowed us to fully describe the scattering-pattern variations upon peptide activity. Other parameters, including those accounting for the structure of inner and outer membranes, were fixed to the references values (see complete description in Semeraro et al., 2021b; all fixed parameters are listed in Tables 2 and 3).

Table 2
List of fixed parameters for the combined analysis of USAXS/SAXS and contrast variation SANS data of E. coli.
DescriptionFixed parametersValues
Center-to-center distance between the head-group layers in the CMDCM(nm)3.73
Center-to-center distance between the head-group layers in the OMDOM(nm)3.33
Width of the head-group layers for both CM and OMWME(nm)0.75
Center-to-center distance between the PG layer and the OMΔPG(nm)16.7
Width of the PG layerWPG(nm)6.0
Average SLD of the tail group layer in the CMρTI(nm2)×1048.31*/0.022†
Average SLD of the tail group layer in the OMρTO(nm2)×1048.86*/0.012
Ratio between major and minor radiiϵ2.0
Effective radius of gyration of each OS coreRg,OS(nm)0.45
  1. USAXS/SAXS: (ultra) small-angle X-ray scattering; SANS: small-angle neutron scattering; SLD: scattering length density.

  2. CM: Cytoplasmic membrane; OM: Outer membrane; PG: peptidoglycan; OS: Oligosaccharides.

  3. *

    X-ray SLDs.

  4. Neutron SLDs.

Table 3
List of fixed and D2O-dependent parameters for the combined analysis of USAXS/SAXS and contrast variation SANS data of E. coli.

The average SLD of both CM and OM head-group layers, ρME, the SLD of the buffer solution, ρBF, and the product of the each OS core volume and its contrast relative to the buffer, βOS=VOSΔρOS.

Fixed parametersValues
Neutrons (wt% D2O)
X-rays1030405090
ρME(nm2)×10412.91.562.202.522.844.11
ρBF(nm2)×1049.4760.1351.542.202.815.54
βOS(nm)×10410.73.832.321.680.69–2.44
  1. USAXS/SAXS: (ultra) small-angle X-ray scattering; SANS: small-angle neutron scattering; SLD: scattering length density.

The scattering intensities of O-LF11-215-aggregates were comparable to that of bacteria in the high q-range (Figure 2—figure supplement 1D). While this affected the quality of the ultrastructural parameters, it enabled at the same time the investigation of the kinetics of the AMP uptake. Indeed, by assuming that O-LF11-215 is primarily forming aggregates in solution, IAMP0 at Δt=17.5 ms can be converted to the total known peptide concentration [P]. Hence, the further assumption that peptides leaving the clusters are directly partitioning into the cell allows to convert the difference [IAMP0(Δt)-IAMP0(0)] to [P]B(Δt). It follows that

(7) NBkin

where NBkin is the number of O-LF11-215 partitioned within the volume of a single cell that can be obtained time-resolved USAXS/SASX data.

Finally, time-resolved USAXS/SAXS data were fitted using the parameters of the initial (see Semeraro et al., 2021b) and end states as boundaries and guide to refine the χ2 minimization (see Figure 2—figure supplement 4). This was accomplished by means of a genetic selection algorithm exploiting >300 repetitions of converging fittings (see details in Semeraro et al., 2021b). Fit results were filtered using an ad hoc threshold of χ2<1.15χmin2, which enabled the exclusion of local minima. Filtered results were used to build up parameter distributions that in turn provided mean values, associated errors (standard deviation), and correlation coefficients. Exemplary distributions are shown in Figure 2—figure supplement 5 and Figure 2—figure supplement 6. Variations in ΔOM and σOM at Δt=17.5 ms are due to lower signal-to-noise ratio available in time-resolved measurements.

Appendix 1

Clusters of acylated peptide O-LF11-215

Peptide clusters formed by O-LF11-215 were investigated by Trp fluorescence and USAXS/SAXS. Trp spectra displayed a λmax336 nm and an FWHM of about 67 nm, which can be related to a heterogeneous distribution of Trp with apolar surroundings (Ladokhin et al., 2000). In addition, O-LF11-215 exhibited Trp phosphorescence emission at about 450 nm, which usually is not measurable due to its dynamic quenching by oxygen and impurities in aqueous suspensions (Cioni and Strambini, 2002). Its presence suggests that a significant portion of Trp residues are buried in hydrophobic cores, with no access to the solvent and with a local high viscosity.

Appendix 1—figure 1
Trp-fluorescence and SAXS analyis of O-LF11-215 clustering.

(A) Trp fluorescence data of LF11-215 (green squares) and O-LF11-215 (blue triangles) at 100 µg/ml (LF11-324 are not shown to avoid redundancy). Data were fitted with Equation 4. Arrows mark the maxima positions of the fluorescence and phosphorescence bands. (B) Small-angle X-ray scattering (SAXS) data of O-LF11-215 at 400 µg/ml. The fit was performed with Equation 5. Additional lines highlight the obtained intensity decay of slope –2.4 (solid line), typical of mass fractals, as opposed to –2.0 (dashed line), which would correspond to either Gaussian chains or planar structures. Note that the slope is conserved in a q-range larger than one order of magnitude.

USAXS/SAXS data in the low q-range (qmin ~ 0.005 nm–1) exhibited a featureless decay of intensity with a slope of f=2.4. This slope value is typical for mass fractals, that is, highly branched objects with high surface-to-volume ratio, while qmin suggests a minimum aggregate size of 2π/qmin>1μ. Furthermore, a Guinier term is needed to fit the shoulder at about q=0.2 nm–1 corresponding to an average radius of gyration Rg10 nm. Note that this feature also does not vanish for different choices of scaling constants for background subtraction. Interestingly, this value is way too high to describe O-LF11-215 monomers, whose expected radius of gyration would be lt1 nm. Possibly, peptide monomers create smaller aggregates of mean size Rg10 nm, which in turn form a heterogeneous and branched supramolecular structure with the characteristics of a mass fractal.

Appendix 2

Estimating the scattering contribution of OMVs

The prefactor of the scattering contribution from extracellular, independent objects used in Equation 6 is IOMV0=NOMVVOMV2ΔρOMV2, where NOMV is the number of OMVs, VOMV is the volume of an OMV, and ΔρOMV is average SLD difference to the buffer. This definition of forward scattering (per single cell) is valid for every noninteracting object. Hence, to validate the assumption that this scattering contribution is related to OMVs, it is interesting to calculate possible NOMV, VOMV, and ΔρOMV values. Note that even if modeling OMVs as homogeneous spheres appears as a crude first-order approximation, ROMV can be associated to its radius (within ∼10% confidence). Assuming the same lipid asymmetry as in the outer membrane, the inner leaflet of OMVs can be mimicked by a 3:1 mole mixture of palmitoyl-oleoyl-phosphatidylethanolamine (POPE) and palmitoyl-oleoyl-phosphatidylglygerol (POPG), respectively (De Siervo, 1969; Lohner et al., 2008; Leber et al., 2018). The SLD membrane profiles of these lipids have been thoroughly investigated (Kučerka et al., 2012, Kučerka et al., 2015). The outer leaflet might instead be dominated by LPS, whose lipid A possesses about six short C14:0 chains (Kim et al., 2016), and the polar region can be approximated as two PG units, in terms of molecular volume and SLD. In addition, LPS inner and outer core volumes and SLDs can be calculated from Heinrichs et al., 1998 and Müller-Loennies et al., 2003, neglecting O-antigen chains for simplicity. Gathering all this information, similarly to the membrane structure estimation in Semeraro et al., 2021b, the vesicles would have a membrane thickness of 4.1 nm and an average SLD of 1.1 × 10⁻³ nm–2 (volume-weighted averages). The lumen of OMVs can be quite diversely composed (Beveridge, 1999). We tentatively assigned the SLD of the periplasmic space of the end-state system, that is, 9.68 × 10⁻⁴ nm–2.

Together with a buffer SLD of 9.47 × 10⁻⁴ nm–2, a measured IOMV0= 1500 ± 200 nm and a ROMV= 15.4 ± 0.6 nm, for instance, then leads to the estimate NOMV= 1200 ± 400 and a total lipid surface (inner and outer leaflets of all OMVs) of (4 ± 2 )× 106 nm2.

Appendix 3

Statistics of bacterial inhibition

Assuming that the AMP-induced delayed bacterial growth is entirely due to a lower number density of survived cells (Marx et al., 2021b), the inhibited fraction of cells, ϕIG, as a function of peptide and cell concentrations was fitted with a heuristic approach. Specifically, we used the sigmoidal Gompertz function

(8) c

where [P] is the total peptide molar concentration, and b and c and are related, respectively, to the position and width of the sigmoidal. Physically this can be interpreted analogously to a transition between two states; alive and dead bacteria. The width of this transition is associated with its cooperativity, that is, the sharper the transition the higher the cooperativity. This does, however, not imply any cooperative peptide–peptide or peptide–bacteria interaction. It is a mere measure of efficiency to inhibit bacterial growth that will be influenced by several stochastic processes, such as cell-to-cell variations of the average number of partitioned peptides.

Mathematically, F([P];b,c) can be associated to a CDF, that is, it measures the probability of finding a certain number (or fraction) of inhibited cells at a given peptide concentration. This allows to derive the PDF by calculating the derivative, f([P];b,c)=F([P];b,c)/[P]=ϕIG/[P], as well as the inverse CDF, F-1(ϕIG;b,c), that is, the ϕIG-quantiles. This maps ϕIG values to the inhibitory peptide concentrations ICx, where x is the corresponding inhibited bacterial percentage; by definition, IC99.9MIC. In addition, the set of b and c values as a function of ncell can be interpolated to obtain, for example, a continuous trend of ICx as a function of ϕIG.

Note that, by definition, the derived PDFs express the probability of having a ‘killing’ event at a given [P].

Appendix 3—figure 1
Statistical analysis of the AMP-induced bactericidal events.

(A) Selected ϕIG data for LF11-324 and corresponding fits with the Gompertz function. (B) Corresponding probability density functions (PDFs).

Appendix 4

Tryptophan fluorescence

Appendix 4—figure 1
AMP-partitioning study in live bacteria based on Trp-fluorescence.

(A) Example of Trp fluorescence analysis in LF11-324 systems. The solid line is the best fit, and the dotted and dashed lines represent the Trp emissions from peptide in bulk and cell-associated, respectively. Data were fitted with Equation 4. (B, C) Comparison between fB values obtained from the Trp fluorescence analysis (red dots) and the equi-activity analysis from the susceptibility assay (black pentagons). Error bars in panel (B and C) are the associated standard deviations of the adjustable parameters obtained from the analysis of the equi-activity assay (black pentagons) and Trp-fluorescence (red dots).

The native fluorescence of the single Trp residue present in LF11 peptides was exploited to validate the partitioning investigation through the equi-activity analysis. For every system, emission signals from partitioned peptides exhibited a weak blue shift, with λmaxB values in the range 346–354 nm for LF11-215, and 340–350 nm for LF11-324. ΓB values showed no significant variations, instead. Interestingly, these values are consistent with a scenario in which a significant amount of partitioned peptides are heterogeneously dispersed in a polar environment and in a configuration allowing full dynamics of the Trp residues (Burstein and Emelyanenko, 1996; Ladokhin et al., 2000). This is consistent with the NPmax/NB values calculated via ζ-potential measurements, suggesting that a relevant portion of partitioned AMPs are still in monomeric state in the intracellular space.

Given that fB=ncellNB/(NA[P]), fB values extracted via Trp fluorescence were compared with those obtained from the antimicrobial activity assays at [P] = MIC and MIC × 0.5 (LF11-215; data not shown). These two independent methods gave comparable fB, confirming the validity of NB values.

Data availability

The current manuscript is a biophysical study, reporting data analysis of scattering data and peptide partitioning assays in vitro. All relevant data are included and plotted in the manuscript. In addition SANS raw data are accessible (http://dx.doi.org/10.5291/ILL-DATA.8-03-910). The modelling code for data analysis consists of a standard chi-squared minimization algorithm. The implemented analytical functions are described in the Methods and Materials section of the manuscript.

The following data sets were generated
    1. Pachler M
    2. Frewein MPK
    3. Lohner K
    4. Marx L
    5. Pabst G
    6. Prevost S
    7. Haden S
    8. Semeraro EF
    (2022) Institut Laue-Langevin
    Antimicrobial peptide induced phase separation in E. coli membrane mimetic systems.
    https://doi.org/10.5291/ILL-DATA.8-03-910

References

  1. Book
    1. Lohner K
    (editors) (2001)
    Development of Novel Antimicrobial Agents: Emerging Strategies (1st edition)
    Norfolk, UK: Horizon Scientific Press.
  2. Book
    1. Lohner K
    2. Sevcsik E
    3. Pabst G
    (2008) Liposome-Based Biomembrane Mimetic Systems: Implications for Lipid–Peptide Interactions
    In: Leitmannova Liu A, editors. Advances in Planar Lipid Bilayers and Liposomes. Academic Press. pp. 103–137.
    https://doi.org/10.1016/S1554-4516(07)06005-X
  3. Book
    1. Narayanan T
    2. Gummel J
    3. Gradzielski M
    (2014) Probing the self-assembly of unilamellar vesicles using time-resolved saxs
    In: Narayanan T, editors. In Advances in Planar Lipid Bilayers and Liposomes. Elsevier. pp. 171–196.
    https://doi.org/10.1016/B978-0-12-418698-9.00007-1
  4. Book
    1. Zemb T
    2. Lindner P
    (editors) (2002)
    Neutrons, X-Rays and Light: Scattering Methods Applied to Soft Condensed Matter
    North-Holland delta series. Elsevier.

Decision letter

  1. Patricia Bassereau
    Reviewing Editor; Institut Curie, France
  2. Gisela Storz
    Senior Editor; National Institute of Child Health and Human Development, United States
  3. John Seddon
    Reviewer; Imperial College London, United Kingdom

Our editorial process produces two outputs: (i) public reviews designed to be posted alongside the preprint for the benefit of readers; (ii) feedback on the manuscript for the authors, including requests for revisions, shown below. We also include an acceptance summary that explains what the editors found interesting or important about the work.

Decision letter after peer review:

Thank you for submitting your article "Lactoferricins access the cytosol of Escherichia coli within few seconds" for consideration by eLife. Your article has been reviewed by 3 peer reviewers, and the evaluation has been overseen by a Reviewing Editor and Gisela Storz as the Senior Editor. The following individual involved in review of your submission has agreed to reveal their identity: John Seddon (Reviewer #1).

The reviewers have discussed their reviews with one another, and the Reviewing Editor has drafted this to help you prepare a revised submission.

Essential revisions:

The 3 reviewers have found that your manuscript is potentially important and impactful. They agree that no additional experiments are necessary but that the data analysis and conclusions should be revisited. Here are listed the main changes that are requested in the revision of your manuscript.

1) Data analysis

The changes induced by AMPs on scattering data are not strong. Thus, the analysis of these data, based on a delicate fitting process and 7 adjustable parameters, has to be precisely assessed. I recommend that you address carefully the concerns #1,2, 4-7 of Reviewer 3, and that of Reviewer 1 on this point.

2) Interpretation of the data

The discussion and your conclusions on the bacterial killing mechanism should be also revised by addressing remarks from Reviewer 2 (#1 and 2) and from Reviewer 3 (#8 and 10). They also suggest that you cite more references to other work in your discussion (see Reviewer 2's comments, and Reviewer 3 point #3).

Reviewer #1 (Recommendations for the authors):

Some specific comments:

P11, line 309. What is meant by 'momentum'? Is this a misprint?

Lines 313 and 320. The References in the Reference List (p19) should be cited as

Max et al., 2021a, and Max et al., 2021b.

P19, line 652. The Reference Lohner et al., 2008 is incomplete.

P23, line 779. The symbols in B and C are black pentagons, not diamonds.

Reviewer #2 (Recommendations for the authors):

1) Mechanism of action

– Several previous studies have shown peptide accumulation in the cytosol [Sochaki 2011, Jepson 2016, Snoussi 2018, Zhu 2019, Savini 2020, Kaji 2021]. Only some of them are cited in the article. All of them should be discussed.

– All previous studies [Jepson 2016, Snoussi 2018, Savini 2020, Kaji 2021], including the direct microscopic observations of Weisshaar and coworkers [Sochaki 2011, Zhu 2019], showed that peptide penetration to the cell cytosol is a consequence of peptide-induced perturbation of permeability of cell membranes. Once the cytosol becomes accessible due to membrane perturbation, association of cationic peptides to intracellular anionic molecules (such as DNA) is an obvious consequence. It is not clear to me if the authors think that in their case peptide accumulation inside the cytosol takes place after perturbation of outer and inner membranes, or without pore formation. In the manuscript, peptide entry in the cytosol is discussed in terms of "translocation", which in general is used to indicate peptide crossing of cell membranes, without pore formation. The authors write "Our experimental setup is not sensitive to directly observe either transient membrane pores or other membrane defects". However, they observed changes in periplasmic and cytosolic SLD. At the end of the introduction, summarizing the study results, the authors write that "collateral damage of the bacterial cell envelope (loss of LPS packing, loss of positional correlations between outer and inner membranes, vesiculation/tubulation, cell shrinkage).… occurred at later time points" with respect to cytosolic entry. However, in Figure 2, this possible difference in time scales is not apparent to me. LPS packing, periplasmic SLD, cell size, all seem to follow kinetics that are rather similar to the cytosolic SLD. Indeed, in the results the authors write "The attack of AMPs first shows up in our time-resolved data by changes of the LPS packing density, as well as periplasmic and cytoplasmic SLDs" and "For LF11-324, the permeabilization of the cytoplasmic membrane occurred as fast as 3- 10 s after mixing". Could the authors clarify these central points? Incidentally, could they comment why the measurements are sensitive to LPS packing, but not to membrane permeability? Don't SANS measurements with different water/deuterated water mixtures help to address this aspect?

– The time for access to the cytosol reported by the authors (less than 3 s) is much faster than previously reported times for other peptides [Sochaki 2011, Zhu 2019]. However, the way this point is discussed in the manuscript seems to imply that this difference is due to the higher time resolution of the technique ("the superior time-resolution and sensitivity.… of synchrotron USAXS/SAXS allowed us to demonstrate.… that AMPs are able to reach the cytosolic compartment of bacteria on the seconds time scale and thus much faster than previously considered"). This sentence might be misleading. The previous studies reported times in the minutes range for peptide access to the cytosol but they did have the resolution needed to observe faster events. Therefore, the different times reported in the various studies are probably due to the specific peptides being studied. Incidentally, in the case of LL-37, bacterial growth stops well before cytosolic entry of the peptide [Sochaki 2011, Zhu 2019]. It is also worth mentioning that in the present study cytosolic entry starts after a few seconds but it does not reach equilibrium even after several minutes (See Figure 2 and Figure 6). If one had to define a lifetime for this process, from Figure 2, I guess that it would be in the order of a couple of minutes. These aspects should be discussed with more caution and detail.

– The authors write "the damage of the cell envelope is a collateral effect of AMP activity that does not kill the bacteria" and "the impairment of the membrane barrier is a necessary but not sufficient condition for microbial killing by lactoferricins". What data support this conclusion? The two effects (membrane perturbation and cytosolic entry) happened on comparable time scales. Bacterial killing was not studied during the SAS experiments. Cell-envelope perturbation took place at sub-MIC concentrations (e.g. 0.7*MIC), but these concentrations are still bactericidal: even if they do not sterilize the sample, a significant fraction of bacteria is killed and would influence the SAS signal. Could the authors assess bacterial growth (in size and number) over the 440 s of kinetic measurements? It is surprising that other (subtler) effects are characterized, and not this macroscopic property. At least, what happens to the optical density of the sample in this timeframe?

– As an argument in favor of interaction with cytosolic targets as the main mechanism of killing, the authors note that the peptide with the lowest MIC reaches also a lower concentration inside the cytosol. They write "Two factors emerge as key components for AMP efficacy: (i) a fast translocation through inner and outer membranes, rapidly reaching extremely high cytosolic AMP concentration levels (100 mM), and (ii) an efficient shut-down of the bacterial metabolism, that is the lower the number of 'needed' AMPs in the cytosol the better". However, the difference in cytosolic concentrations between LF11-324 and LF11-215 is only a factor of 1.4, and the difference in MIC values is similar. However, MICs are determined by twofold dilutions and therefore this difference is probably within the experimental error [Loffredo 2021]. Indeed, at some cell densities the two MICs are comparable. LF11-324 is much faster in reaching the cytosol, than LF11-215, but this property is not reflected in a comparably higher antimicrobial activyt. Finally, a structure/activity correlation is not very solid with just two peptides.

– The authors write "An efficient shut-down of metabolism (is the) primary cause for bacterial killing", and "The primary cause for bactericidal or bacteriostatic activity of the presently studied peptides is thus.… a fast and efficient shut-down of bacterial metabolic activity". What data support this conclusion? Bacterial metabolic activity was not studied.

Is high peptide accumulation in the cytosol consistent with the observed decrease in SLD?

2) Peptide-cell binding

– The intrinsic fluorescence of the peptide was used to follow peptide/cell binding directly, after subtraction of the background due to cell emission. This is a very interesting approach, but was the intensity of this background, compared to the signal?

– The model used by the authors to derive information on peptide/cell interaction from the cell-density dependence of peptide activity is strictly related to that previously proposed by Savini [2017] and Loffredo [2021]. Peptide/cell binding measurements by fluorescent spectroscopy were previously reported by Roversi [2016], Savini [2020] and Kaji [2021]. The fact that the high majority of peptides partition inside the cell is consistent with the recent results by Kaji [2021] and with the binding measurements of Savini [2020].

– Appendix 4 is not sufficiently clear. What do the authors mean exactly by "the probability distributions of inhibiting bacterial growth" and by "cooperativity of killing"? If I understand correctly, in appendix 4 a distribution of "activities" is hypothesized. Is this compatible with the fixed concentration of bound peptides implied in Equation 1?

Reviewer #3 (Recommendations for the authors):

1. In the fit model, the authors vary many parameters such as size, periplasmic distance, the width of the periplasmic distance, number of LPS per cell, in addition to scattering length densities (SLDs) of the cytoplasm, periplasm and peptidoglycan respectively. This is 7 parameters in total and in additional 2 more is used for SAXS modeling of additional OM vesicles. Considering the complexity of the structure, this is not unreasonable but freely fitting SLDs without taking into account constraints of mass balance, changes in volume etc. in addition to covariation between parameters might lead to severe pitfalls. I also wonder about the choice considering that there is a lot of potential contributions that are ignored. What about tubules forming from the bilayer, changes in SLDs by peptide insertion into the IM and OM, proteins and flagella. If the peptide translocates there might also be possible structural changes and phase separation within the cytoplasma. Can the authors please comment on this?

2. The changes in the TR-SAXS are rather minor and the main effect seem to be net reduction in the intensity- interestingly this occurs over the whole Q-range and it seems that the bulk of the effect can be described by scaling the whole data set indicating a loss of material through e.g. precipitation. This should be commented on in the discussion of the results. Nevertheless, it also seems there is slight effect of the overall size of the bacteria which can be corroborated with results from TEM. In some cases, like Figure S2 A, some hint of change in the scattering at intermediate Q. These are the length scale where typical changes in the bilayer scattering are also observed upon addition of peptide. This is simply because of the changes in the electron density of (in particular) the hydrocarbon interior of the bilayer in addition to possible membrane thinning (or thickening) etc. How can the authors jump to the conclusion that changes in the LPS surface density and membrane roughness are the only relevant effects to consider? I am not claiming that these are not relevant parameters. However, what is the rationalization behind not considering potentially important changes in contrast and electron density distribution caused directly or indirectly by the peptide that would cause the same effects? The fit curves, at least a few representative examples for each data set should also be shown.

3, Related to 2: The authors simply seem to ignore most of the work done by other groups on small-angle scattering, model membranes and antimicrobial peptides. After all, in this project, that should be a starting point for discussion of the much more complex scattering data from live bacteria.

See e.g., work by:

Meikle et al. Journal of Colloid and Interface Science 2021 587, 90-100.

Nielsen, J. E et al. BBA – Biomembranes 2019, 1861, 1355-1364.

Nielsen, J. E. et al. Soft Matter 2018, 11, 37-14.

Nielsen, J. E. et al. J. Coll. Int. Sci. 2021, 582, 793-802.

Castelletto et al. Langmuir 2012, 28 (31), 11599-11608.

Dehsorkhi e al. Langmuir 2013, 29 (46), 14246-14253.

Narayanan, T et al. J Phys Chem B 2016, 120(44):11484-11491

Qian et al. Biophys. J. 2008, 94 (9), 3512-3522.

Lee, C.-C et al. Biophys. J. 2011, 100 (7), 1688-1696.

Rai, D. K.; Qian, S., Sci. Rep. 2017, 7 (1), 3719.

4. The scattering curve for the peptide Figure S1 B looks very much like a (thin) sheet structure rather than unimeric peptide and a random mass fractal aggregate. The authors should verify this. I suppose a Q-2.4 vs Q-2 dependence would look rather similar in log-log plot.

5. The authors use DMSO as a cosolvents. This mixed with water might give residual background scattering due to partial miscibility at high Q. Also, it seems risky for experiment. May the authors comment?

6. In Table 1 they report different values for neutrons and X-rays. Still, it is claimed that the analysis was done using joint fits of SANS/SAXS which cannot be right then. Can the authors clarify?

7. Figure 1A: Why is the Q-range cut for the data with peptide? Are any aggregates observed at low Q?

8. Figure 2A: the effect on LPS packing seems to be almost independent on concentrations and MIC, considering typical error bars (not shown?). This should be discussed in the context of the proposed mechanism.

9. Figure 3 A: "visibility limit" should rather be "detection limit"

10. I am a bit puzzled by saturation in zeta potential observed below MIC. I don't quite see why this is must indicate translocation as the peptide embedded in the membrane and possible release of ions and larger charged molecules may counteract the effect.

[Editors' note: further revisions were suggested prior to acceptance, as described below.]

Thank you for submitting your article "Lactoferricins access the cytosol of Escherichia coli within few seconds" for consideration by eLife. Your article has been reviewed by 2 peer reviewers, and the evaluation has been overseen by a Reviewing Editor and Gisela Storz as the Senior Editor. The following individuals involved in review of your submission have agreed to reveal their identity: John Seddon (Reviewer #1).

The reviewers have discussed their reviews with one another, and the Reviewing Editor has drafted this to help you prepare a revised submission.

Essential revisions:

The reviewers consider that your work is important, since it brings new insights on the effects of antimicrobial peptides on bacterial cell using time-resolved scattering data. However, they think the current version, although improved, still tends to over-interpret the data and leads to misleading conclusions. I recommend that you revise once more your manuscript and include the changes listed by referee #2.

Reviewer #1 (Recommendations for the authors):

In my view, the authors have considered all of the referees' comments carefully and have gone to considerable lengths to address the points raised. The manuscript has been significantly modified and improved, and I am now happy with it.

Reviewer #2 (Recommendations for the authors):

Most of my comments have been addressed in the revised version, which is much clearer. However, thanks to the improved clarity, some critical aspects of the data interpretation in the paper are now even more evident. I am still convinced that the data reported here are very important, but they should be interpreted much more cautiously, as I discuss below. I strongly suggest that the manuscript is reformulated in terms of what was actually measured (i.e. leakage of cell membranes, rather than peptide accumulation in the cytosol)

1) If I understood correctly the authors' replies and corrections, they did not measure peptide accumulation inside the cytosol in the SAS time-resolved experiments. This aspect was not clear to me in the previous version, and I judged rapid peptide accumulation in the cytosol as a "solid finding". However, based on the replies to my queries, important sentences in the abstract and even in the title appear to be misleading. Some examples "Lactoferricins access the cytosol of Escherichia coli within few seconds"; "AMPs.… reach the cytosol within less than three seconds".

In the revised version, they write "We additionally checked for contributions of peptides to the SLDs of each bacterial compartment, including inner and outer membranes. The associated changes were found to be insignificant, however". In one of their replies, they write "Scattering of AMPs reaching the cytosol is buried in this signal, i.e. does not significantly contribute to the cytosolic SLD. The observed changes upon the addition of AMP are due to a loss of the low-molecular-weight molecules only"; and "differences in cytosolic and periplasmic SLD…prove permeation and loss of materials, from which we infer and suggest the presence of membrane defects or transient pores"

Therefore, the measured parameters are changes in SLD of periplasm and cytosol, which "need to be due to a leakage of inner and outer membranes". Indeed, the authors write "About cytosolic entry, we can only speculate that it occurs in similar time scales than cytosolic leakage". The phenomenon happening in a few seconds, in a concentration-dependent way, is the leakage of cell membranes.

2) Based on the previous point, conclusions on the mechanism of killing, reported in the abstract, appear to be misleading. I refer to sentences such as the following: "obstruction of physiologically important processes" is the "primary cause for bacterial killing"; "the damage of the cell envelope emerged from our analysis as a collateral effect of AMP activity that does not kill the bacteria. This implies that the impairment of the membrane barrier is a necessary but not sufficient condition for microbial killing". This point is very important, as it is commonly accepted that the mechanism of killing by AMPs is perturbation of the permeability of bacterial membranes, while the abstract implies that this is not the case.

I specifically asked about this point in my previous comments and the authors replied "This conclusion is given by the fact that the cell-envelope damage after one hour of incubation is AMP concentration-independent.… Given that the same macroscopic effects at different AMP concentrations do not correlate to different activities, it seems reasonable to suggest that the damage to the cell envelope is not the primary cause of growth inhibition."

If I understood correctly, here by "cell-envelope damage" they refer to LPS packing, SLD of peptidoglycan layer, periplasm thickness and membrane ruffling. These parameters change in an AMP-concentration independent way. However, these effects are not the commonly accepted mechanism of bacterial killing by AMPs, which is membrane permeabilization. Peptide-induced leakage was actually concentration-dependent, as detected by changes in SLD of periplasm and cytosol: "Differences in cytosolic and periplasmic SLD…prove permeation and loss of materials, from which we infer and suggest the presence of membrane defects or transient pores". Therefore, peptide-induced leakage of the cell membrane cannot be discarded as the cause of bacterial killing. Actually, as discussed above, peptide access to the cytosol is only inferred from cell membrane leakage. The two phenomena cannot be decoupled in the data and therefore in my opinion it is not possible to distinguish between the two as the cause of bacterial killing. Indeed, peptide accumulation in the cytosol could be just a collateral effect of membrane permeability (with internal anionic molecules becoming accessible to the peptide), as several researchers have hypothesized.

3) Comparisons of peptide concentrations and activities in SAS and MIC experiments are questionable.

In replying to one of my questions, the authors specified that the activity was determined by MIC measurements, in a growth medium, which however was not present in the SAS experiments. It is well known that medium components can significantly reduce peptide activity, by sequestration effects. In particular, lactoferricin-derived peptides are very sensitive to growth-medium composition (Journal of Applied Bacteriology 1994, 77, 206-214). Therefore, any comparison regarding active concentrations in the two datasets should be considered very cautiously.

The authors write: "even at growth-inhibited fractions of just 1%, we observed much the same structural changes of the bacterial ultrastructure as at quasi fully growth-inhibited E. coli…bacteria are able to recover at sub-MIC concentrations from a severe collateral damage of their cell-envelope. Consequently, this damage cannot be the killing cause for the bacteria". As discussed above, membrane leakage is not included in the "structural changes" considered by the authors, so the above sentences do not apply to peptide-induced membrane permeabilization. Even so, it is very likely that an AMP concentration not inhibiting bacterial growth in a medium becomes much more active when the medium is not present.

Activity could have been measured under the same conditions of the SAS experiments, by determining bacterial killing, rather than growth inhibition.

Other points:

In my previous comments, I asked "If I understand correctly, in appendix 4 a distribution of "activities" is hypothesized. Is this compatible with the fixed concentration of bound peptides implied in Equation 1?". The authors replied: "The number of bound peptides NB needs to be conceived as a thermodynamic average over a distribution of peptides that will insert into the cell". However, cell to cell variations in the number of bound peptides should follow a Poisson distribution. Since the average is in the order of 107, wouldn't fluctuations be negligible?

[Editors' note: further revisions were suggested prior to acceptance, as described below.]

Thank you for resubmitting your work entitled "Lactoferricins access the cytosol of Escherichia coli within few seconds" for further consideration by eLife. Your revised article has been evaluated by Gisela Storz (Senior Editor) and a Reviewing Editor in consultation with the previous reviewers.

The manuscript has been improved but there are some remaining issues that need to be addressed, as outlined below:

A third round of revision is unusual, but the authors chose to introduce only minimal modifications to the manuscript, even if they agreed that three central conclusions of their paper are derived based on "circumstantial arguments". As such, these statements do not belong in the title, abstract, or Results sections of an eLife article, even though they can be presented as hypotheses in the Discussion section. In addition, the indirect arguments presented have some problems. The article is interesting and should be published, but some significant modifications are essential before it can be accepted.

1) Lactoferricins reach "cytosolic concentrations of about 100 mM"

The circumstantial argument goes along these lines:

– from the cell concentration dependence of the peptide MIC, a peptide water-cell partition constant was estimated;

– from this constant, the total number of peptides bound to each cell (under certain conditions) was estimated;

– from zeta potential measurements, using several assumptions, a maximum number of peptides bound to the outer LPS layer was estimated;

– by comparing these numbers, it was estimated that less than 5% of the cell-bound peptides are bound to LPS;

– assuming that binding to other membrane leaflets is comparable to the association to the LPS layer, it was estimated that 92% is in the cytosol.

In addition to its very indirect nature (which should be made explicit in the article), based on several assumptions , the main problem with this line of reasoning is that peptides that are not bound to LPS could be in the inner leaflet of the outer membrane, or in the plasma membrane (for a total of 3 leaflets), but also in the periplasmic space or associated to the peptidoglycan layer. Indeed, in the Results section, the authors correctly use the term "inner compartments". Therefore, the cytosolic concentration cannot be estimated. Incidentally, the calculations and assumptions used to estimate a concentration value of about 100 mM should be clarified.

One possible solution to this issue could be to discuss the data in terms of intracellular or inner compartments (meaning everything inside the outer membrane) concentrations, rather than cytosolic.

Some (non-exhaustive) examples.

Line 21: please substitute "cytosolic" with "intracellular"

Line 86: The final cytosolic->The final intracellular

Line 88: cytosolic-> intracellular

Line 369: "is located within the cell wall"->is associated to the LPS layer"

Line 447 "cytosolic compartment"->"cell interior"

Line 449 "reaching extremely high cytosolic AMP concentration levels"->intracellular

2) "Lactoferricins access the cytosol within a few seconds"

No data are available on the kinetics of the cell entry process. Indeed the authors replied "In the manuscript we do not give any information about the full kinetics of AMP entry". Only membrane leakage was measured. MIC data (on which the above considerations on cytosolic accumulation are based) are measured hours after peptide addition. Therefore, the speed of cell entry should not be mentioned, as it was not measured.

Some (non-exhaustive) examples of the modifications required:

Line 1: the title should be modified to reflect only conclusions for which data are available (e.g. Lactoferricin perturb cell membranes of Escherichia coli within a few seconds and accumulate inside the cell).

Line 20: please remove "and reach the cytosol"

Line 22: please substitute "reaching cytoplasm and lowest cytosolic" with "causing leakage and lowest intracellular".

Line 82: Please modify the sentence "Coupling the observed rapid loss of cytoplasmic content with peptide partitioning data we inferred that the studied peptides are able to reach the bacterial cytosol just within few seconds" to "We observed that the studied peptides are able to cause loss of cytoplasmic content just within few seconds".

3) Killing is due to peptide accumulation in the cytosol, rather than to membrane perturbation, which is "a collateral effect of AMP activity that does not kill the bacteria".

In this case, the circumstantial argument is:

– different concentrations of the LF11-324 peptide (at the MIC and sub MIC) have "different leakage kinetics", but eventually "equilibrate to the same cytoplasmic density" (after 1 h, Figure 2B).

– since "the overall degree of leakage is the same for both inhibited-fractions of ~1% and >99.9%" it is "more than reasonable to suggest that permeability alone cannot be the sole cause of bactericidal activity".

– it is hypothesized that the cause for killing must be peptide accumulation in the cytosol (no evidence for this conclusion is provided).

The main problem with this (again indirect) line of reasoning is that also the number of cell-bound LF11-324 peptide molecules is fairly constant over a wide range of growth inhibition values (approximately from 0% to 75%, Figure 5A, where it changes only from 1x10⁷ to 1.5x10⁷). Therefore, based on considerations similar to those reported above, also peptide accumulation in the cytosol should be excluded as the cause of the killing. The cause of killing should be discussed much more cautiously, reflecting the fact that both accumulation and leakage take place at sub-lethal concentrations.

Some examples:

Line 22: please substitute "primary cause for" with "possible factor contributing to"

Line 23: please modify the abstract to reflect the fact that both membrane permeability and intracellular accumulation take place at sub-lethal concentrations.

Line 96: please modify the sentence starting with "The primary cause for bactericidal"

Line 449: please do not mention "efficient shut-down of physiological processes", since no data are available on this aspect. In general, all the concluding remarks should be substantially revised.

https://doi.org/10.7554/eLife.72850.sa1

Author response

Reviewer #1 (Recommendations for the authors):

Some specific comments:

P11, line 309. What is meant by 'momentum'? Is this a misprint?

Yes, it is indeed a typo. We meant “amphipathic moment”. We modified the text accordingly.

Lines 313 and 320. The References in the Reference List (p19) should be cited as

Max et al., 2021a, and Max et al., 2021b.

Unfortunately, we do not see the typo. The two references (a) and (b) are ranked automatically by the used Latex template to their order in the reference list.

P19, line 652. The Reference Lohner et al., 2008 is incomplete.

We thank the referee to noticing this. The correct reference is now in the text.

P23, line 779. The symbols in B and C are black pentagons, not diamonds.

We modified the text and changed diamonds to pentagons.

Reviewer #2 (Recommendations for the authors):

1) Mechanism of action

– Several previous studies have shown peptide accumulation in the cytosol [Sochaki 2011, Jepson 2016, Snoussi 2018, Zhu 2019, Savini 2020, Kaji 2021]. Only some of them are cited in the article. All of them should be discussed.

Given the large number of reports on this aspect it is our humble opinion that Loffredo et al., PNAS 2021 is well summarizing most of these works. Further, we already quoted the reports of Sochaki 2011 and Zhu 2019 in the original manuscript. However, following the suggestion of the referee, we added a reference to Kaji et al. 2021.

– All previous studies [Jepson 2016, Snoussi 2018, Savini 2020, Kaji 2021], including the direct microscopic observations of Weisshaar and coworkers [Sochaki 2011, Zhu 2019], showed that peptide penetration to the cell cytosol is a consequence of peptide-induced perturbation of permeability of cell membranes. Once the cytosol becomes accessible due to membrane perturbation, association of cationic peptides to intracellular anionic molecules (such as DNA) is an obvious consequence. It is not clear to me if the authors think that in their case peptide accumulation inside the cytosol takes place after perturbation of outer and inner membranes, or without pore formation.

Clearly, AMPs need to impair the barrier function of outer and inner membranes to reach the cytosol in agreement with all above mentioned studies. Our X-ray and neutron scattering data are, however, not sensitive to the presence or absence of pores or other forms of local membrane perturbation (note the difference to much less complex lipid-only systems, where effects such as, e.g. membrane thinning can be observed). Hence, we used “translocation” in its very generic sense, without being able to specify any details. Nevertheless, using cytoplasmic membrane mimics, we previously found very weak membrane remodeling activity as compared to other AMPs (Marx et al., 2021b). Moreover, LF11-215 does not cause lipid flip-flop in membrane mimics (Marx et al., 2021a), supporting the minimal “disruption” of the lipid bilayer. To clarify this point we added the following comment:

“We stress that the usage of the term 'translocate' does not imply that AMPs are able to pass through inner and outer membranes without any noticeable effect on membrane structure, such as the transient formation of pores, nor does it exclude their presence. It merely refers to a generic, unspecified uptake of the peptides beyond the resolution of the present experiments. We note, however, that LF11-215 was found to partition into artificial lipid membranes, without noticeable effects on lipid flip-flop (Marx et al., 2021a).”

In the manuscript, peptide entry in the cytosol is discussed in terms of "translocation", which in general is used to indicate peptide crossing of cell membranes, without pore formation. The authors write "Our experimental setup is not sensitive to directly observe either transient membrane pores or other membrane defects". However, they observed changes in periplasmic and cytosolic SLD.

Indeed, we can only directly measure the differences in cytosolic and periplasmic SLD. These parameters prove permeation and loss of materials, from which we infer and suggest the presence of membrane defects or transient pores.

At the end of the introduction, summarizing the study results, the authors write that "collateral damage of the bacterial cell envelope (loss of LPS packing, loss of positional correlations between outer and inner membranes, vesiculation/tubulation, cell shrinkage).… occurred at later time points" with respect to cytosolic entry. However, in Figure 2, this possible difference in time scales is not apparent to me. LPS packing, periplasmic SLD, cell size, all seem to follow kinetics that are rather similar to the cytosolic SLD. Indeed, in the results the authors write "The attack of AMPs first shows up in our time-resolved data by changes of the LPS packing density, as well as periplasmic and cytoplasmic SLDs" and "For LF11-324, the permeabilization of the cytoplasmic membrane occurred as fast as 3- 10 s after mixing". Could the authors clarify these central points?

We agree that the different time scales are not immediately apparent from the data presented in Figure 2 and hence our statement might confuse readers. In particular, AMPs reaching the cytosol leaves a fingerprint in changes of the SLD not only of the cytosol, but also the SLD of the periplasm. It turns out that the periplasm is most sensitive to these initial changes. Here the SLD changes at highest peptide concentration already 3 s after mixing. To clarify this issue, we marked the important time points in Figure 2 and changed the text in the revised manuscript accordingly.

Incidentally, could they comment why the measurements are sensitive to LPS packing, but not to membrane permeability? Don't SANS measurements with different water/deuterated water mixtures help to address this aspect?

The scattering model detailed in Semeraro et al., J. Appl. Cryst 2021 introduced the LPS packing term, which originates from positional correlations between the oligosaccharide cores of these lipids. This accounts for the X-ray scattering shoulder at about q~0.1 nm-1 (see also Figure 1A). In the presence of AMP this shoulder disappears, which can be fully accounted for by a loss of the above-mentioned correlations. This effect is in-line with the severe membrane-ruffling as observed by TEM, as well as the formation of OMVs. The formation of transient membrane defects is obscured by scattering from other components of the bacteria. Also note, that peptide pores have been only detected with neutrons using very specific experimental conditions (solid supported single-component membranes at reduced levels of hydration) needed to decrease the systems degrees of freedom, see K. He at al., Biochemistry 34, 15614 (1995).

– The time for access to the cytosol reported by the authors (less than 3 s) is much faster than previously reported times for other peptides [Sochaki 2011, Zhu 2019]. However, the way this point is discussed in the manuscript seems to imply that this difference is due to the higher time resolution of the technique ("the superior time-resolution and sensitivity.… of synchrotron USAXS/SAXS allowed us to demonstrate.… that AMPs are able to reach the cytosolic compartment of bacteria on the seconds time scale and thus much faster than previously considered"). This sentence might be misleading. The previous studies reported times in the minutes range for peptide access to the cytosol but they did have the resolution needed to observe faster events. Therefore, the different times reported in the various studies are probably due to the specific peptides being studied.

We thank the reviewer for this comment, the sentence is misleading. The observed kinetics may indeed be specific to the currently studied AMPs. We modified the sentence to avoid ambiguities.

Incidentally, in the case of LL-37, bacterial growth stops well before cytosolic entry of the peptide [Sochaki 2011, Zhu 2019]. It is also worth mentioning that in the present study cytosolic entry starts after a few seconds but it does not reach equilibrium even after several minutes (See Figure 2 and Figure 6). If one had to define a lifetime for this process, from Figure 2, I guess that it would be in the order of a couple of minutes. These aspects should be discussed with more caution and detail.

We agree that this is a subtle point. Our data does not contain any information about when the amount of cytosolic AMP needed to stop bacterial growth is reached. We only see a flattening of the changes of SLDs in the cytoplasm and periplasm, which are given by AMP induced leakage and are secondary effects of AMP’s entry. We discussed this more carefully in the revised manuscript, stating a clearer differentiation among the onsets of cytosolic leakage. About the lifetime of the leakage process, the half-life (for example) depends on both LF11 type and concentration, ranging from about 1 to >5 minutes.

– The authors write "the damage of the cell envelope is a collateral effect of AMP activity that does not kill the bacteria" and "the impairment of the membrane barrier is a necessary but not sufficient condition for microbial killing by lactoferricins". What data support this conclusion?

This conclusion is given by the fact that the cell-envelope damage after one hour of incubation is AMP concentration-independent (regardless of the kinetics, see Figure 2). For example, at a concentration of 19 µM LF11-324 (corresponding to 0.3xMIC) only 1% of all bacteria are inhibited in their growth. At 43 µM LF11-324 (corresponding to 0.7xMIX) this number increases to 90%. Yet, the observed macroscopic effect on the cell-envelope is indistinguishable. Given that the same macroscopic effects at different AMP concentrations do not correlate to different activities, it seems reasonable to suggest that the damage to the cell envelope is not the primarily cause of growth inhibition. We have clarified this point in the revised manuscript.

The two effects (membrane perturbation and cytosolic entry) happened on comparable time scales.

We respectfully disagree with the reviewer, and we understand that plots and descriptions were probably misleading. Both local membrane perturbation (decrease of LPS packing) and macroscopic cell-envelope damage (increase of ΔOM and σOM, e.g. membrane ruffling) do not happen on comparable time scales. The first effect occurs after about 10 s and the latter after 2-4 minutes, and they are both AMP-concentration-independent. About cytosolic entry, we can only speculate that it occurs in similar time scales than cytosolic leakage. This in turn is AMP-concentration-dependent and happens (for LF11-324, for example) at 3-10 s, 10-20 s and 50-120 s for 1.2x, 0.7x and 0.3xMIC. We tried to clarify it in the revised manuscript and modifying Figure 2.

Bacterial killing was not studied during the SAS experiments. Cell-envelope perturbation took place at sub-MIC concentrations (e.g. 0.7*MIC), but these concentrations are still bactericidal: even if they do not sterilize the sample, a significant fraction of bacteria is killed and would influence the SAS signal. Could the authors assess bacterial growth (in size and number) over the 440 s of kinetic measurements? It is surprising that other (subtler) effects are characterized, and not this macroscopic property. At least, what happens to the optical density of the sample in this timeframe?

About growth, unlike the applied susceptibility assay, no growth medium was added to the bacteria after mixing with AMPs (else all other steps were the same in SAS experiments). Consequently, bacteria are not able to grow during the kinetic experiments. Allowing the bacteria to grow during SAS experiments would impede any detailed analysis by a convolution of diverse structural changes at literally all length scales (growth versus AMP-induced destruction). We clarified this issue in the revised manuscript.

About the influence of either killed or alive cells in the SAS signal, note that both are part of the signal. We clarify this point and its consequences in the text:

“A particularly striking result for the LF11-215/LF11-324 end-states is that the peptide-induced effects are similar and independent of peptide concentration (Figure1, Figure2). That is, even at growth-inhibited fractions of just 1%, we observed similar structural changes of the cell envelope, or e.g. LPS packing, as at quasi fully growth-inhibited E. coli (see also Figure4 and Figure4–FigureSupplement1).”

– As an argument in favor of interaction with cytosolic targets as the main mechanism of killing, the authors note that the peptide with the lowest MIC reaches also a lower concentration inside the cytosol. They write "Two factors emerge as key components for AMP efficacy: (i) a fast translocation through inner and outer membranes, rapidly reaching extremely high cytosolic AMP concentration levels (100 mM), and (ii) an efficient shut-down of the bacterial metabolism, i.e., the lower the number of 'needed' AMPs in the cytosol the better". However, the difference in cytosolic concentrations between LF11-324 and LF11-215 is only a factor of 1.4, and the difference in MIC values is similar. However, MICs are determined by twofold dilutions and therefore this difference is probably within the experimental error [Loffredo 2021]. Indeed, at some cell densities the two MICs are comparable. LF11-324 is much faster in reaching the cytosol, than LF11-215, but this property is not reflected in a comparably higher antimicrobial activyt. Finally, a structure/activity correlation is not very solid with just two peptides.

Yes, indeed the ratio of the calculated cytosolic concentrations of peptides (at high cell number density) resemble the ratio of the MICs. This is an expected result, given that at such high bacterial concentrations (109 CFU/ml) most of the peptides are partitioned to the cells. However, we respectfully disagree with the reviewer that the difference in MIC values of LF11-324 and LF11-215 is within experimental uncertainty. We performed fine search of the MIC and partial ICx values that goes beyond the “standard” twofold dilution protocol. The applied methodology, detailed in the Methods and Materials section, follows our recent report (Marx et al., Front Med Technol, 2021) and gives MIC values with <10% uncertainty. Also, it is certainly not our aim to derive a structure/activity correlation from studying just two peptides. We clearly state this now in the conclusion of our paper.

– The authors write "An efficient shut-down of metabolism (is the) primary cause for bacterial killing", and "The primary cause for bactericidal or bacteriostatic activity of the presently studied peptides is thus.… a fast and efficient shut-down of bacterial metabolic activity". What data support this conclusion? Bacterial metabolic activity was not studied.

We fully agree with the reviewer that the bacterial metabolic activity was not studied. Indeed, we cannot disentangle the number of possible interactions with negatively charges macromolecules (Zhou et al., PNAS 2019) and metabolites occurring in the cytosol. This could impair diverse biochemical processes or pathways (e.g protein expression, DNA replication, etc.) We appreciate this comment, and we have modified our corresponding statement detailing the considerations above.

Is high peptide accumulation in the cytosol consistent with the observed decrease in SLD?

As detailed in Semeraro et al. J Appl Cryst 2021, the SLD of the cytosol is dominated by low-molecular weight molecules (ATP, metabolites, etc.) and ions. Scattering of AMPs reaching the cytosol is buried in this signal, i.e. does not significantly contribute to the cytosolic SLD. The observed changes upon the addition of AMP are due to a loss of the low-molecular weight molecules only. We detail this in the revised version of the manuscript.

2) Peptide-cell binding

– The intrinsic fluorescence of the peptide was used to follow peptide/cell binding directly, after subtraction of the background due to cell emission. This is a very interesting approach, but was the intensity of this background, compared to the signal?

Upon excitation at 280 nm, the emission spectra from bare bacterial systems surprisingly showed a single and clean Trp-emission band, peaking at 334-336 nm (FWHM ~65 nm). The peak intensity increased linearly from 4.9 (arb. units) at 107 cells/ml to 122 (arb. units) at 5x10⁸ cells/ml; then turbidity effects had to be accounted for. LF11-215 and LF11-324 showed peaks intensities of about 240 (arb. units) and 140 (arb. units), respectively, in the MIC range, centered at 353-354 nm. All these quantities had errors in the decimal position. These values enabled background-subtracted spectra of good signal-to-noise ratio. We added more details in the Methods and Materials section.

– The model used by the authors to derive information on peptide/cell interaction from the cell-density dependence of peptide activity is strictly related to that previously proposed by Savini [2017] and Loffredo [2021]. Peptide/cell binding measurements by fluorescent spectroscopy were previously reported by Roversi [2016], Savini [2020] and Kaji [2021]. The fact that the high majority of peptides partition inside the cell is consistent with the recent results by Kaji [2021] and with the binding measurements of Savini [2020].

The model proposed in our manuscript is indeed that same reported initially by Savini et al., 2016 (not 2017). The only difference is the definition of the “effective” partitioning coefficient. We modified it slightly to be consistent with the notation used in the original peptide partitioning formalism in liposomes (White et al., Meth Enzymol 1998), to which Savini originally referred to. An analogous method was also applied to the case of liposome/detergents systems by Heerklotz and Seelig, Eur Biophys J 2007. The details of the modelling (including all mentioned references) were described in Marx et al., Front Med Technol 2021. Kaji [2021], Roversi [2014] (not 2016) and Savini [2020] are now quoted in the revised manuscript.

– Appendix 4 is not sufficiently clear. What do the authors mean exactly by "the probability distributions of inhibiting bacterial growth" and by "cooperativity of killing"? If I understand correctly, in appendix 4 a distribution of "activities" is hypothesized. Is this compatible with the fixed concentration of bound peptides implied in Equation 1?

The sigmoidal trend for the increase of growth-inhibited cells with peptide concentration can be transform (upon derivation) into probability density functions (PDF), which describe the likeliness of growth inhibition at a given peptide concentration (and cell density). This is analogous to a transition between two states; here: alive and dead. The width of this transition (or width of the probability function) is associated with its cooperativity, i.e. the sharper the transition the higher the cooperativity. This does, however, not imply any cooperative peptide-peptide or peptide-bacteria interaction. It is a mere measure of efficiency to inhibit bacterial growth. Additionally, these PDFs allow us also to derive the ICx (inhibitory peptide concentration) by calculating the so-called φIG-quantiles.

Equation 1 details the thermodynamics of peptide partitioning into bacterial cells. The number of bound peptides NB needs to conceived as a thermodynamic average over a distribution of peptides that will insert into the cell. As such this is consistent with our statistical analysis of bacterial growth inhibition. We have detailed these issues in the revised manuscript.

Reviewer #3 (Recommendations for the authors):

1. In the fit model, the authors vary many parameters such as size, periplasmic distance, the width of the periplasmic distance, number of LPS per cell, in addition to scattering length densities (SLDs) of the cytoplasm, periplasm and peptidoglycan respectively. This is 7 parameters in total and in additional 2 more is used for SAXS modeling of additional OM vesicles. Considering the complexity of the structure, this is not unreasonable but freely fitting SLDs without taking into account constraints of mass balance, changes in volume etc. in addition to covariation between parameters might lead to severe pitfalls. I also wonder about the choice considering that there is a lot of potential contributions that are ignored. What about tubules forming from the bilayer, changes in SLDs by peptide insertion into the IM and OM, proteins and flagella. If the peptide translocates there might also be possible structural changes and phase separation within the cytoplasma. Can the authors please comment on this?

The analysis of our scattering data is constructed in the following way. First, we analyzed the structure of E. coli in the absence of AMPs (reported in Semeraro et al., J Appl Cryst, 2021) and presence of AMPs. For initial states we jointly analyzed 11 data sets (10 neutron, 1 X-ray) and for end states, we narrowed it down 6. The joint analysis already sets important constraints to the adjustable parameters. In addition, and as detailed in Semeraro et al., J Appl Cryst, 2021, we consider scattering from all entities of the whole bacterium (considering mass balance, volume distributions etc), some of which do not contribute to the observed scattering signal. These include fimbriae, flagella, or ribosomes, i.e. scattering is not sensitive to structural details of the cytosol and this extends to AMP induced phase separation as observed by TEM. Moreover, several parameters need to be fixed, as we now state clearly in the revised version of our manuscript; but see also Table 2 in Semeraro et al., J. Appl. Cryst, 2021. Tubules were only observed in case of O-LF11-215. However, the presence of O-LF11-215 aggregates obscures their possible detection. In analyzing end-states, we also considered peptide-induced changes of membrane structure. This yielded, however, unphysical results. In order to avoid overparameterization, we therefore remained with the minimum of adjustable parameters needed to fit the data. Importantly, model fitting is not executed using a standard least square procedure, but a Monte Carlo genetic-selection algorithm. This yields for each parameter a probability distribution and allows to derive correlations. Finally, after having established initial and end-state structures, kinetic scattering data (for which we have USAXS/SAXS only) are analyzed in a second step using the structural results as boundaries and further constraining the analysis to follow a smooth transition from initial to end-state. We have updated the manuscript thoroughly to make all these points clearer.

2. The changes in the TR-SAXS are rather minor and the main effect seem to be net reduction in the intensity- interestingly this occurs over the whole Q-range and it seems that the bulk of the effect can be described by scaling the whole data set indicating a loss of material through e.g. precipitation. This should be commented on in the discussion of the results. Nevertheless, it also seems there is slight effect of the overall size of the bacteria which can be corroborated with results from TEM. In some cases, like Figure S2 A, some hint of change in the scattering at intermediate Q. These are the length scale where typical changes in the bilayer scattering are also observed upon addition of peptide. This is simply because of the changes in the electron density of (in particular) the hydrocarbon interior of the bilayer in addition to possible membrane thinning (or thickening) etc. How can the authors jump to the conclusion that changes in the LPS surface density and membrane roughness are the only relevant effects to consider? I am not claiming that these are not relevant parameters. However, what is the rationalization behind not considering potentially important changes in contrast and electron density distribution caused directly or indirectly by the peptide that would cause the same effects? The fit curves, at least a few representative examples for each data set should also be shown.

We respectfully disagree with the reviewer. TR-SAXS patterns at different times are sufficiently distinct for our analysis. For clarification, we added a supplementary figure showing representative curves and including error bars and fitting (see the new Figure 2 —figure supplement 4). This also clearly shows that the changes cannot be attributed a mere intensity scaling. Sedimentation does occur though, but at time scales beyond our kinetic experiments. Previous experiments on the same bacterial strain shows signs of such induced intensity changes after 15-20 minutes. We note this in the revised manuscript.

Regarding bacterial size: The bacterial size in fact changes as observed by a decrease of the minor ellipsoid radius (see Figure 2 C, and I).

Regarding the comment on potential scattering contributions at intermediate q: We agree that such information is accessible in lipid-only systems (e.g. vesicles) interacting with AMPs. The situation in bacteria is vastly different however, where such information is superimposed by contributions from the entire ultrastructure. In fact, we do know from our partitioning analysis that inner and outer membranes are loaded with peptides. However, AMPs do not contribute to the average SLD of each compartment, including the membranes (please refer to the reply to reviewer #2, 1st section, last paragraph).

The conclusions on the decrease of LPS packing are based on constraints form the detailed analysis of initial and end states using multiple SAXS/SANS datasets. Based on TEM data (membrane ruffling) this is expected and serves as the most simple and convincing explanation for the observed changes in scattering intensity. Please note that we do not claim that the effects suggested by the reviewer do not take place. However, USAXS/SAXS cannot detect it and we deliberately refrain from any overparameterization. We clarify this in the revised manuscript.

3, Related to 2: The authors simply seem to ignore most of the work done by other groups on small-angle scattering, model membranes and antimicrobial peptides. After all, in this project, that should be a starting point for discussion of the much more complex scattering data from live bacteria.

See e.g., work by:

Meikle et al. Journal of Colloid and Interface Science 2021 587, 90-100.

Nielsen, J. E et al. BBA – Biomembranes 2019, 1861, 1355-1364.

Nielsen, J. E. et al. Soft Matter 2018, 11, 37-14.

Nielsen, J. E. et al. J. Coll. Int. Sci. 2021, 582, 793-802.

Castelletto et al. Langmuir 2012, 28 (31), 11599-11608.

Dehsorkhi e al. Langmuir 2013, 29 (46), 14246-14253.

Narayanan, T et al. J Phys Chem B 2016, 120(44):11484-11491

Qian et al. Biophys. J. 2008, 94 (9), 3512-3522.

Lee, C.-C et al. Biophys. J. 2011, 100 (7), 1688-1696.

Rai, D. K.; Qian, S., Sci. Rep. 2017, 7 (1), 3719.

We agree that there is a significant amount of literature on AMP effect on lipid-only mimics SAXS/SANS, some of which (by far not all) are quoted by the reviewer above. In order not to confuse the reader with effects observed in such simple mimics, we decided to quote only those papers, which deal with the here studied peptides. Please note, that we are also not referring to most of our own work on AMPs for the same reason!

4. The scattering curve for the peptide Figure S1 B looks very much like a (thin) sheet structure rather than unimeric peptide and a random mass fractal aggregate. The authors should verify this. I suppose a Q-2.4 vs Q-2 dependence would look rather similar in log-log plot.

We respectfully disagree with the reviewer. A q (-2.4) decay of scattered intensity shows up much different from a q (-2) decay on a log-log plot (see updated Figure). Also note that the uncertainty of this decay is about 1% as found by data fitting. In any case, in view of scope of the present manuscript we did not deepen the investigation of the O-LF11-215 aggregates.

5. The authors use DMSO as a cosolvents. This mixed with water might give residual background scattering due to partial miscibility at high Q. Also, it seems risky for experiment. May the authors comment?

We initially shared the same concern of the reviewer. Therefore, we subtracted as background PBS, vol% DMSO and 0.01 vol% acetic acid. In addition, the potential effects on both scattering data and susceptibility/partitioning assay were tested in advance. Effects in neither bacterial scattering pattern nor peptide potency were observed as stated in Methods and Materials/ AMP samples section in the original submission of our manuscript.

6. In Table 1 they report different values for neutrons and X-rays. Still, it is claimed that the analysis was done using joint fits of SANS/SAXS which cannot be right then. Can the authors clarify?

X-rays interact very different with matter than neutrons, leading to much different coherent scattering lengths. Hence, X-ray and neutron SLDs are different even if data has been jointly analyzed (see also Figure 1 – supplement 2 B-D for the SLD changes as a function of D2O). In the case of NOS, this originates from a biological variation using a bacterial culture grown at a different time. That is, we allowed for different NOS values when jointly analyzing x-ray and neutron data. Results are however equal within experimental uncertainty. Consequently, this nicely demonstrates reproducibility. We clarify this in the revised manuscript.

7. Figure 1A: Why is the Q-range cut for the data with peptide? Are any aggregates observed at low Q?

SAXS data shown in Figure 1A originate from two different experimental runs. The initial state data was recorded at a 10 times higher sample concentration also explaining the overall differences in intensity scale as detailed now in the revised figure caption. The slightly lower qmin in the end state data are due to background subtraction issues that are not trivial in the USAXS range and which become more prevalent for less concentrated samples. No trace of aggregate was ever detected, both with and without peptides.

8. Figure 2A: the effect on LPS packing seems to be almost independent on concentrations and MIC, considering typical error bars (not shown?). This should be discussed in the context of the proposed mechanism.

Error bars are present in each panel of Figure 2. They are not detectable when smaller than the dot size. We propose that the concentration-independent decrease of LPS packing is a consequence of the quick partitioning (or even saturation) of the outer LPS leaflet in <10 seconds. That is, for both LF11-215 and LF11-324, the equilibrium amount of peptides that saturate the LPS leaflets is reached at peptide concentrations of <0.3xMIC. This is in line with zeta-potential measurements that reported a saturation at about 0.2-0.3xMIC. We clarified it in the revised manuscript.

9. Figure 3 A: "visibility limit" should rather be "detection limit"

We modified the plot according to the reviewer suggestion.

10. I am a bit puzzled by saturation in zeta potential observed below MIC. I don't quite see why this is must indicate translocation as the peptide embedded in the membrane and possible release of ions and larger charged molecules may counteract the effect.

The saturation of the zeta-potential with peptide concentration solely indicates the saturation of peptides partitioned in the outer LPS leaflet (as a rough approximation). The translocation was inferred from the whole partitioning analysis, i.e. including bioscreen data. Further, because of the effects mentioned by the reviewer we can only provide an upper boundary of for the number of AMPs per LPS (= 1:3).

[Editors' note: further revisions were suggested prior to acceptance, as described below.]

Essential revisions:

The reviewers consider that your work is important, since it brings new insights on the effects of antimicrobial peptides on bacterial cell using time-resolved scattering data. However, they think the current version, although improved, still tends to over-interpret the data and leads to misleading conclusions. I recommend that you revise once more your manuscript and include the changes listed by referee #2.

We would like to thank the editors and reviewers for this second round of constructive comments. We replied to each single point of reviewer #2 and modified a few sentences in the manuscript accordingly.

Reviewer #2 (Recommendations for the authors):

Most of my comments have been addressed in the revised version, which is much clearer. However, thanks to the improved clarity, some critical aspects of the data interpretation in the paper are now even more evident. I am still convinced that the data reported here are very important, but they should be interpreted much more cautiously, as I discuss below. I strongly suggest that the manuscript is reformulated in terms of what was actually measured (i.e. leakage of cell membranes, rather than peptide accumulation in the cytosol)

We appreciate the critical reading of the reviewer and tried to further stress and clarify the important aspects of the manuscript. Below we reply to each single recommendation. We also added or modified a few sentences in the main text to help the reader to address the most crucial findings.

1) If I understood correctly the authors' replies and corrections, they did not measure peptide accumulation inside the cytosol in the SAS time-resolved experiments. This aspect was not clear to me in the previous version, and I judged rapid peptide accumulation in the cytosol as a "solid finding". However, based on the replies to my queries, important sentences in the abstract and even in the title appear to be misleading. Some examples "Lactoferricins access the cytosol of Escherichia coli within few seconds"; "AMPs.… reach the cytosol within less than three seconds".In the revised version, they write "We additionally checked for contributions of peptides to the SLDs of each bacterial compartment, including inner and outer membranes. The associated changes were found to be insignificant, however". In one of their replies, they write "Scattering of AMPs reaching the cytosol is buried in this signal, i.e. does not significantly contribute to the cytosolic SLD. The observed changes upon the addition of AMP are due to a loss of the low-molecular-weight molecules only"; and "differences in cytosolic and periplasmic SLD…prove permeation and loss of materials, from which we infer and suggest the presence of membrane defects or transient pores"

Therefore, the measured parameters are changes in SLD of periplasm and cytosol, which "need to be due to a leakage of inner and outer membranes". Indeed, the authors write "About cytosolic entry, we can only speculate that it occurs in similar time scales than cytosolic leakage". The phenomenon happening in a few seconds, in a concentration-dependent way, is the leakage of cell membranes.

We agree with the reviewer. Indeed, we can directly measure the kinetics of leakage process through the kinetics of the scattering length densities (proportional to the mass densities) of cytoplasmic and periplasmic compartments. In the manuscript we do not give any information about the full kinetics of AMP entry, with the exception of O-LF11-215. In this case we do have an estimation. However, what we can do is distinguishing between periplasm and cytoplasm densities, and this gives a constrain to the timing of perturbation of the cytoplasmic membrane. This is indeed about 3 s for the most effective and concentrated peptide (LF11-324). Our claim of AMPs rapidly reaching the cytoplasm is a circumstantial argument derived from adding our peptide partitioning data into the picture. These data show that the majority of peptide is located inside the bacteria, while only a small fraction remains surface-bound (Figure 5 C). In order to induce loss of cytoplasmic content, AMPs need to reach the cytoplasmic membrane. Including further our previous report on cytoplasmic membrane mimics (Marx et al., Faraday Disc. 2021, doi: 10.1039/D1FD00039J), which showed that lactoferricins readily pass through the bilayers, allows us to conclude that the AMPs rapidly reach the cytosol. The kinetics of O-LF11-215 entry in the cell-volume, along with simple partitioning considerations, strengthen this hypothesis. In order to avoid any confusion, we further clarified this line of argumentation in the revised manuscript.

2) Based on the previous point, conclusions on the mechanism of killing, reported in the abstract, appear to be misleading. I refer to sentences such as the following: "obstruction of physiologically important processes" is the "primary cause for bacterial killing"; "the damage of the cell envelope emerged from our analysis as a collateral effect of AMP activity that does not kill the bacteria. This implies that the impairment of the membrane barrier is a necessary but not sufficient condition for microbial killing". This point is very important, as it is commonly accepted that the mechanism of killing by AMPs is perturbation of the permeability of bacterial membranes, while the abstract implies that this is not the case.

I specifically asked about this point in my previous comments and the authors replied "This conclusion is given by the fact that the cell-envelope damage after one hour of incubation is AMP concentration-independent.… Given that the same macroscopic effects at different AMP concentrations do not correlate to different activities, it seems reasonable to suggest that the damage to the cell envelope is not the primary cause of growth inhibition."

If I understood correctly, here by "cell-envelope damage" they refer to LPS packing, SLD of peptidoglycan layer, periplasm thickness and membrane ruffling. These parameters change in an AMP-concentration independent way. However, these effects are not the commonly accepted mechanism of bacterial killing by AMPs, which is membrane permeabilization. Peptide-induced leakage was actually concentration-dependent, as detected by changes in SLD of periplasm and cytosol: "Differences in cytosolic and periplasmic SLD…prove permeation and loss of materials, from which we infer and suggest the presence of membrane defects or transient pores". Therefore, peptide-induced leakage of the cell membrane cannot be discarded as the cause of bacterial killing. Actually, as discussed above, peptide access to the cytosol is only inferred from cell membrane leakage. The two phenomena cannot be decoupled in the data and therefore in my opinion it is not possible to distinguish between the two as the cause of bacterial killing. Indeed, peptide accumulation in the cytosol could be just a collateral effect of membrane permeability (with internal anionic molecules becoming accessible to the peptide), as several researchers have hypothesized.

We highly respect previous research in the field and have contributed also ourselves to the commonly accepted picture of AMP mechanism in several previous studies. Yet, our data provide insight from a very different angle that allows us to think beyond this picture (which is mostly based on lipid-only model membrane studies, i.e. missing additional potential targets). Moreover, based on only three (very similar) AMPs we certainly cannot claim a shift of paradigm. At the best our study encourages other groups to pursue similar ideas and add further understanding that will allow to further improve the design of AMPs to combat infectious diseases.

We arrived to this conclusion because, despite the different kinetics, all the end-states of LF11-324 systems at the MIC and sub-MIC (and LF11-215 at the MIC) equilibrate to about the same cytoplasmic density (SLD). It means that the overall degree of leakage is the same for both inhibited-fractions of ~1% and >99.9%. Hence, we find more than reasonable to suggest that permeability alone cannot be sole cause of bactericidal activity. So again, we are using a circumstantial argument to decouple physical impairment of the membrane (leakage) from killing. We added a few sentences to further clarify this reasoning.

3) Comparisons of peptide concentrations and activities in SAS and MIC experiments are questionable.

In replying to one of my questions, the authors specified that the activity was determined by MIC measurements, in a growth medium, which however was not present in the SAS experiments. It is well known that medium components can significantly reduce peptide activity, by sequestration effects. In particular, lactoferricin-derived peptides are very sensitive to growth-medium composition (Journal of Applied Bacteriology 1994, 77, 206-214). Therefore, any comparison regarding active concentrations in the two datasets should be considered very cautiously.

The authors write: "even at growth-inhibited fractions of just 1%, we observed much the same structural changes of the bacterial ultrastructure as at quasi fully growth-inhibited E. coli…bacteria are able to recover at sub-MIC concentrations from a severe collateral damage of their cell-envelope. Consequently, this damage cannot be the killing cause for the bacteria". As discussed above, membrane leakage is not included in the "structural changes" considered by the authors, so the above sentences do not apply to peptide-induced membrane permeabilization. Even so, it is very likely that an AMP concentration not inhibiting bacterial growth in a medium becomes much more active when the medium is not present.

Activity could have been measured under the same conditions of the SAS experiments, by determining bacterial killing, rather than growth inhibition.

We respectfully disagree with the reviewer’s assessment of our data. As we further clarified in the methods and materials section, MIC assays were performed incubating bacteria and peptide in PBS buffer, and hence analogously to SAS experiments. The growth medium was added in the MIC assays only after incubation to monitor the bacterial growth and asses AMP efficiency. This is a standard procedure applied by many groups, see also Marx et al., Frontiers in Medical Technology. 2021; doi: 10.3389/fmedt.2021.625975.

Other points:

In my previous comments, I asked "If I understand correctly, in appendix 4 a distribution of "activities" is hypothesized. Is this compatible with the fixed concentration of bound peptides implied in Equation 1?". The authors replied: "The number of bound peptides NB needs to be conceived as a thermodynamic average over a distribution of peptides that will insert into the cell". However, cell to cell variations in the number of bound peptides should follow a Poisson distribution. Since the average is in the order of 107, wouldn't fluctuations be negligible?

This is a very interesting point. The modified MIC assay with a fine screening of AMP concentration can actually give a measure of these fluctuations. Indeed, the asymmetric sigmoidal trend of growth inhibited-E. coli fraction as a function of AMP concentration is very likely the integral of a Poisson (or Poisson-like) distribution, i.e. the CDF. The partitioning analysis (either our proposed version or the one reported firstly in Savini et al. 2016) aims to associate an average NB to each inhibited-fraction value along the above-mentioned distribution.

[Editors' note: further revisions were suggested prior to acceptance, as described below.]

The manuscript has been improved but there are some remaining issues that need to be addressed, as outlined below:

A third round of revision is unusual, but the authors chose to introduce only minimal modifications to the manuscript, even if they agreed that three central conclusions of their paper are derived based on "circumstantial arguments". As such, these statements do not belong in the title, abstract, or Results sections of an eLife article, even though they can be presented as hypotheses in the Discussion section. In addition, the indirect arguments presented have some problems. The article is interesting and should be published, but some significant modifications are essential before it can be accepted.

1) Lactoferricins reach "cytosolic concentrations of about 100 mM"

The circumstantial argument goes along these lines:

- from the cell concentration dependence of the peptide MIC, a peptide water-cell partition constant was estimated;

- from this constant, the total number of peptides bound to each cell (under certain conditions) was estimated;

We respectfully disagree with the reviewer. Throughout the manuscript we carefully discriminate between estimated, calculated and measured quantities. The number of peptides partitioned in each cell was calculated from robust modeling of the growth inhibition assay. As control, the number of peptides partitioned into each cell was also directly measured via tryptophan spectroscopy (Appendix 4), fully supporting the growth inhibition analysis. In the manuscript we use the term ‘estimated’ because of the degree of variability given by the experimental setups. In order to avoid any misunderstanding with the meaning of estimation we rephrased several sentences in the manuscript accordingly.

- from zeta potential measurements, using several assumptions, a maximum number of peptides bound to the outer LPS layer was estimated;

- by comparing these numbers, it was estimated that less than 5% of the cell-bound peptides are bound to LPS;

Also in this case, the maximum number of peptides partitioned in the LPS layer was not estimated, but calculated from robust mathematical and physical principles as detailed in Marx et al., Front. Med. Technol. 2021. It must be stressed that an estimation of the exact number of peptides in the LPS layer is not accessible via z-potential, given the complexity of the cell membrane. However, this does not exclude a safe calculation of the maximum number as the highest possible value.

- assuming that binding to other membrane leaflets is comparable to the association to the LPS layer, it was estimated that 92% is in the cytosol.

In addition to its very indirect nature (which should be made explicit in the article), based on several assumptions , the main problem with this line of reasoning is that peptides that are not bound to LPS could be in the inner leaflet of the outer membrane, or in the plasma membrane (for a total of 3 leaflets), but also in the periplasmic space or associated to the peptidoglycan layer. Indeed, in the Results section, the authors correctly use the term "inner compartments".

As already stated above, we are unambiguously able to calculate, based on our data, the highest number of AMP that the outer leaflet of the outer membrane can possibly host. This calculation reveals that not more than about 2% of the total amount of partitioned peptides per cell will be found in this leaflet (i.e. most likely less). Note that lipid-only membranes would be unstable at 4-5 AMPs per lipid (see, e.g., Melo et al., Nat. Rev. Microbiol. 2009; or Marx et al., Front. Med. Tech 2021 for LF11 peptides). Multiplying our upper bound value of 2% with the total number of membrane leaflets (4) thus gives us a highly conservative estimate for the number of AMPs that can be possibly associated with inner and outer membranes. It follows that even if we associate as many as possible AMPs with either membrane that still the vast majority of AMPs (92%) will not be located in membranes.

In any case, we agree that we cannot differentiate between cytoplasm and periplasm’s local concentration of peptides (the peptidoglycan is within the periplasmic space). We modified the manuscript as suggested.

Therefore, the cytosolic concentration cannot be estimated. Incidentally, the calculations and assumptions used to estimate a concentration value of about 100 mM should be clarified.

The intracellular peptide concentration is simply given by the size (and henceforth volume) of the cytoplasmic and periplasmic spaces as determined by USAXS/SAXS/DLS and the above described 92% of the total number of cell partitioned peptides. We clarify this in the revised manuscript.

One possible solution to this issue could be to discuss the data in terms of intracellular or inner compartments (meaning everything inside the outer membrane) concentrations, rather than cytosolic.

Some (non-exhaustive) examples.

Line 21: please substitute "cytosolic" with "intracellular"

Done

Line 86: The final cytosolic->The final intracellular

Done

Line 88: cytosolic-> intracellular

Done

Line 369: "is located within the cell wall"->is associated to the LPS layer"

We modified it with the more appropriate “is located within the membranes”.

Line 447 "cytosolic compartment"->"cell interior"

We modified it with the more appropriate “cytosolic membrane”.

Line 449 "reaching extremely high cytosolic AMP concentration levels"->intracellular

The paragraph is now partially rephrased, the new equivalent sentence is “and subsequently accumulate at high concentrations (80 – 100 mM) in all bacterial compartments”.

2) "Lactoferricins access the cytosol within a few seconds"

No data are available on the kinetics of the cell entry process. Indeed the authors replied "In the manuscript we do not give any information about the full kinetics of AMP entry". Only membrane leakage was measured. MIC data (on which the above considerations on cytosolic accumulation are based) are measured hours after peptide addition. Therefore, the speed of cell entry should not be mentioned, as it was not measured.

Some (non-exhaustive) examples of the modifications required:

Line 1: the title should be modified to reflect only conclusions for which data are available (e.g. Lactoferricin perturb cell membranes of Escherichia coli within a few seconds and accumulate inside the cell).

We have difficulties to understand the physical basis of how peptides (given all the derived numbers of cell partitioned peptides and the number of potential targets within the cytosol) can induce cytosolic leakage without reaching the cytosol. However, in order to cut this discussion short, we agree to change the title with a slight modification of the suggested wording “Lactoferricins impair the cytosolic membrane of Escherichia coli within a few seconds and accumulate inside the cell”. Yet, our favorite title still is the original and we would be happy to change back upon the word of the editors.

Line 20: please remove "and reach the cytosol"

Done

Line 22: please substitute "reaching cytoplasm and lowest cytosolic" with "causing leakage and lowest intracellular".

We changed to “…speed of permeabilizing membranes and lowest intracellular peptide concentration”

Line 82: Please modify the sentence "Coupling the observed rapid loss of cytoplasmic content with peptide partitioning data we inferred that the studied peptides are able to reach the bacterial cytosol just within few seconds" to "We observed that the studied peptides are able to cause loss of cytoplasmic content just within few seconds".

The proposed sentence misses the gist of our results. We suggest the following rewording/extension: “We observed that the studied peptides are able to cause a loss of cytoplasmic content just within few seconds. Coupling this finding to the derived final (after one hour) intracellular peptide concentrations at full bacterial growth inhibition (~ 100 mM) suggests a rapid peptide uptake on similar time scales and hence, much faster than previously reported…”

3) Killing is due to peptide accumulation in the cytosol, rather than to membrane perturbation, which is "a collateral effect of AMP activity that does not kill the bacteria".

In this case, the circumstantial argument is:

-different concentrations of the LF11-324 peptide (at the MIC and sub MIC) have "different leakage kinetics", but eventually "equilibrate to the same cytoplasmic density" (after 1 h, Figure 2B).

-since "the overall degree of leakage is the same for both inhibited-fractions of ~1% and >99.9%" it is "more than reasonable to suggest that permeability alone cannot be the sole cause of bactericidal activity".

-it is hypothesized that the cause for killing must be peptide accumulation in the cytosol (no evidence for this conclusion is provided).

The main problem with this (again indirect) line of reasoning is that also the number of cell-bound LF11-324 peptide molecules is fairly constant over a wide range of growth inhibition values (approximately from 0% to 75%, Figure 5A, where it changes only from 1x10⁷ to 1.5x10⁷). Therefore, based on considerations similar to those reported above, also peptide accumulation in the cytosol should be excluded as the cause of the killing. The cause of killing should be discussed much more cautiously, reflecting the fact that both accumulation and leakage take place at sub-lethal concentrations.

We detect some misconceptions. The number of cell bound LF11-324 monotonously increases even if it shows a “fairly” constant region around 50%. This is simply due to the fact that the largest fraction of cells “dies” in this AMP concentration range. Figure 4-supp1 clearly shows this fact, or explicitly: The concentration needed to inhibit 1% – ~ 80% of the bacteria varies only within a few µM, but starts to increase rapidly upon approaching the MIC (see also Appendix 3).The trend of NB as a function of inhibited fraction (Figure 5) mirrors this behavior. We all agree that our data provides unambiguous evidence for the peptides being mostly located within the cytosol and periplasm. If the leakage of cellular content and the damage of the cell wall do not suffice to kill bacteria (because the ensemble average of these effects is unambiguously equal for 1% and 99.9% of growth inhibited bacteria – see USAXS/SAXS) there is not much of a choice left than attributing ‘the killing’ to an accumulation of peptides within the bacteria. The most vital molecules for bacterial metabolism, reproduction, etc. are contained within the cytosol, many of which are prone to be highly attractive targets for AMPs (through unspecific intermolecular forces). Besides, the volume of the cytosol exceeds that of the periplasm significantly. Consequently, the majority of the > 92% of intracellular peptides will be located within the cytosol. So in many ways, although not shown directly, killing will be taking place within the cytosol. There are many peptides that are able to cross the membranes without causing severe membrane damage to reach intracellular targets, see, e.g. Indolicin (Subbalakshmi and Sitaram, FEMS Microbiol. Letters 1998). This is only one among the examples cited in the review of Le et al., Antimicrobial Agents and Chemotherapy 2017 (newly added to the MS). We also wish to quote a statement of these authors, which appears to perfectly fit this discussion. “Based on the findings collected in this paper and elsewhere, we should now understand that a substantial number of AMPs possess multifunctional activities at membranal and/or intracellular sites to achieve efficient killing. Furthermore, the intracellular inhibitory mechanisms of AMPs serve equally important roles, contributing to the overall antibacterial efficiency. Unfortunately, these aspects are commonly overlooked or unreported”.

We carefully discuss these delicate points in the revised version of the manuscript.

Some examples:

Line 22: please substitute "primary cause for" with "possible factor contributing to"

As discussed in detail above, the accumulation of AMPs in the cell emerges indeed as the primary cause for killing (although we are not able to detail beyond that). Consequently we keep the sentence as is.

Line 23: please modify the abstract to reflect the fact that both membrane permeability and intracellular accumulation take place at sub-lethal concentrations.

This was already stated in the previous revision (line 24): “On the other hand, damage of the cell envelope and leakage occurred also at sublethal peptide concentrations”.

Line 96: please modify the sentence starting with "The primary cause for bactericidal"

We keep this statement as outlined above.

Line 449: please do not mention "efficient shut-down of physiological processes", since no data are available on this aspect. In general, all the concluding remarks should be substantially revised.

We substantially revised several sections of the manuscript including in particular the concluding paragraph and Figure 6. Throughout the discussion we clearly state (because there is no explicit data) that this is a proposal and not further clarified. Given the amount of solid evidence collected within this study we believe that this is a valid suggestion and a highly plausible scenario. Moreover, “physiological process” is the most generic and unspecific wording we are able to come up with. Anything less than that would force us to step back from the significant and unambiguous results from our study.

https://doi.org/10.7554/eLife.72850.sa2

Article and author information

Author details

  1. Enrico F Semeraro

    1. University of Graz, Institute of Molecular Biosciences, NAWI Graz, Graz, Austria
    2. BioTechMed Graz, Graz, Austria
    3. Field of Excellence BioHealth – University of Graz, Graz, Austria
    Contribution
    Conceptualization, Data curation, Formal analysis, Investigation, Methodology, Project administration, Software, Validation, Visualization, Writing – original draft, Writing – review and editing
    For correspondence
    enrico.semeraro@uni-graz.at
    Competing interests
    No competing interests declared
    ORCID icon "This ORCID iD identifies the author of this article:" 0000-0002-6096-1108
  2. Lisa Marx

    1. University of Graz, Institute of Molecular Biosciences, NAWI Graz, Graz, Austria
    2. BioTechMed Graz, Graz, Austria
    3. Field of Excellence BioHealth – University of Graz, Graz, Austria
    Contribution
    Formal analysis, Investigation, Validation
    Competing interests
    No competing interests declared
  3. Johannes Mandl

    1. University of Graz, Institute of Molecular Biosciences, NAWI Graz, Graz, Austria
    2. BioTechMed Graz, Graz, Austria
    3. Field of Excellence BioHealth – University of Graz, Graz, Austria
    Contribution
    Data curation, Formal analysis, Investigation, Validation
    Competing interests
    No competing interests declared
  4. Ilse Letofsky-Papst

    Institute of Electron Microscopy and Nanoanalysis and Center for Electron Microscopy, Graz University of Technology, NAWI Graz, Graz, Austria
    Contribution
    Data curation, Investigation, Resources, Validation, Writing – review and editing
    Competing interests
    No competing interests declared
  5. Claudia Mayrhofer

    Center for Electron Microscopy, Graz, Austria
    Contribution
    Data curation, Investigation, Resources, Validation, Writing – review and editing
    Competing interests
    No competing interests declared
  6. Moritz PK Frewein

    1. University of Graz, Institute of Molecular Biosciences, NAWI Graz, Graz, Austria
    2. BioTechMed Graz, Graz, Austria
    3. Field of Excellence BioHealth – University of Graz, Graz, Austria
    4. Institut Laue-Langevin, Grenoble, France
    Contribution
    Investigation
    Competing interests
    No competing interests declared
    ORCID icon "This ORCID iD identifies the author of this article:" 0000-0002-0329-5305
  7. Haden L Scott

    1. Center for Environmental Biotechnology, University of Tennessee, Knoxville, United States
    2. Shull Wollan Center, Oak Ridge National Laboratory, Oak Ridge, United States
    Contribution
    Investigation, Writing – review and editing
    Competing interests
    No competing interests declared
  8. Sylvain Prévost

    Institut Laue-Langevin, Grenoble, France
    Contribution
    Data curation, Investigation, Resources
    Competing interests
    No competing interests declared
    ORCID icon "This ORCID iD identifies the author of this article:" 0000-0002-6008-1987
  9. Helmut Bergler

    1. University of Graz, Institute of Molecular Biosciences, NAWI Graz, Graz, Austria
    2. BioTechMed Graz, Graz, Austria
    3. Field of Excellence BioHealth – University of Graz, Graz, Austria
    Contribution
    Conceptualization, Funding acquisition, Investigation, Resources
    Competing interests
    No competing interests declared
    ORCID icon "This ORCID iD identifies the author of this article:" 0000-0002-7724-309X
  10. Karl Lohner

    1. University of Graz, Institute of Molecular Biosciences, NAWI Graz, Graz, Austria
    2. BioTechMed Graz, Graz, Austria
    3. Field of Excellence BioHealth – University of Graz, Graz, Austria
    Contribution
    Conceptualization, Funding acquisition, Project administration, Resources, Supervision, Writing – review and editing
    Competing interests
    No competing interests declared
  11. Georg Pabst

    1. University of Graz, Institute of Molecular Biosciences, NAWI Graz, Graz, Austria
    2. BioTechMed Graz, Graz, Austria
    3. Field of Excellence BioHealth – University of Graz, Graz, Austria
    Contribution
    Conceptualization, Funding acquisition, Investigation, Project administration, Resources, Supervision, Validation, Writing – original draft, Writing – review and editing
    For correspondence
    georg.pabst@uni-graz.at
    Competing interests
    No competing interests declared
    ORCID icon "This ORCID iD identifies the author of this article:" 0000-0003-1967-1536

Funding

Austrian Science Fund (P 30921)

  • Karl Lohner

The funders had no role in study design, data collection and interpretation, or the decision to submit the work for publication.

Acknowledgements

ESRF – The European Synchrotron and the Institut Laue–Langevin (ILL) are acknowledged for provision of SAXS (proposals LS-2513 and LS-2869) and SANS (exp. 8-03-910) beamtimes. The authors are grateful to T Narayanan for his invaluable support, and thank JM Devos, D Marquardt, and M Pachler for their support during the proof-of-concept experiments (LS-2513), and the biological support laboratory at EMBL Grenoble for providing access to the laboratory equipment for bacterial sample preparation. The authors also acknowledge N Malanovic for sharing her expertise about bacterial cultures and S Keller for the fruitful discussions. Finally, the authors thank the whole staff of ID02 and the D11 for support and availability.

Senior Editor

  1. Gisela Storz, National Institute of Child Health and Human Development, United States

Reviewing Editor

  1. Patricia Bassereau, Institut Curie, France

Reviewer

  1. John Seddon, Imperial College London, United Kingdom

Publication history

  1. Received: August 6, 2021
  2. Preprint posted: September 26, 2021 (view preprint)
  3. Accepted: June 6, 2022
  4. Accepted Manuscript published: June 7, 2022 (version 1)
  5. Version of Record published: August 4, 2022 (version 2)

Copyright

© 2022, Semeraro et al.

This article is distributed under the terms of the Creative Commons Attribution License, which permits unrestricted use and redistribution provided that the original author and source are credited.

Metrics

  • 756
    Page views
  • 221
    Downloads
  • 4
    Citations

Article citation count generated by polling the highest count across the following sources: Crossref, PubMed Central, Scopus.

Download links

A two-part list of links to download the article, or parts of the article, in various formats.

Downloads (link to download the article as PDF)

Open citations (links to open the citations from this article in various online reference manager services)

Cite this article (links to download the citations from this article in formats compatible with various reference manager tools)

  1. Enrico F Semeraro
  2. Lisa Marx
  3. Johannes Mandl
  4. Ilse Letofsky-Papst
  5. Claudia Mayrhofer
  6. Moritz PK Frewein
  7. Haden L Scott
  8. Sylvain Prévost
  9. Helmut Bergler
  10. Karl Lohner
  11. Georg Pabst
(2022)
Lactoferricins impair the cytosolic membrane of Escherichia coli within a few seconds and accumulate inside the cell
eLife 11:e72850.
https://doi.org/10.7554/eLife.72850

Further reading

    1. Physics of Living Systems
    Thomas S Shimizu, E Toby Kiers, Howard A Stone
    Insight

    A combination of in toto imaging and theory suggests a new mechanism for the remodeling of veins in vascular networks.

    1. Medicine
    2. Physics of Living Systems
    Longfeng Rao, Nils Horn ... Pascal Schütz
    Research Article Updated

    Background:

    Postoperative knee instability is one of the major reasons accounting for unsatisfactory outcomes, as well as a major failure mechanism leading to total knee arthroplasty (TKA) revision. Nevertheless, subjective knee instability is not well defined clinically, plausibly because the relationships between instability and implant kinematics during functional activities of daily living remain unclear. Although muscles play a critical role in supporting the dynamic stability of the knee joint, the influence of joint instability on muscle synergy patterns is poorly understood. Therefore, this study aimed to understand the impact of self-reported joint instability on tibiofemoral kinematics and muscle synergy patterns after TKA during functional gait activities of daily living.

    Methods:

    Tibiofemoral kinematics and muscle synergy patterns were examined during level walking, downhill walking, and stair descent in eight self-reported unstable knees after TKA (3M:5F, 68.9 ± 8.3 years, body mass index [BMI] 26.1 ± 3.2 kg/m2, 31.9 ± 20.4 months postoperatively), and compared against 10 stable TKA knees (7M:3F, 62.6 ± 6.8 years, 33.9 ± 8.5 months postoperatively, BMI 29.4 ± 4.8 kg/m2). For each knee joint, clinical assessments of postoperative outcome were performed, while joint kinematics were evaluated using moving video-fluoroscopy, and muscle synergy patterns were recorded using electromyography.

    Results:

    Our results reveal that average condylar A-P translations, rotations, as well as their ranges of motion were comparable between stable and unstable groups. However, the unstable group exhibited more heterogeneous muscle synergy patterns and prolonged activation of knee flexors compared to the stable group. In addition, subjects who reported instability events during measurement showed distinct, subject-specific tibiofemoral kinematic patterns in the early/mid-swing phase of gait.

    Conclusions:

    Our findings suggest that accurate movement analysis is sensitive for detecting acute instability events, but might be less robust in identifying general joint instability. Conversely, muscle synergy patterns seem to be able to identify muscular adaptation associated with underlying chronic knee instability.

    Funding:

    This research received no specific grant from any funding agency in the public, commercial, or not-for-profit sectors.