Genetic insights into ossification of the posterior longitudinal ligament of the spine

  1. Yoshinao Koike
  2. Masahiko Takahata  Is a corresponding author
  3. Masahiro Nakajima
  4. Nao Otomo
  5. Hiroyuki Suetsugu
  6. Xiaoxi Liu
  7. Tsutomu Endo
  8. Shiro Imagama
  9. Kazuyoshi Kobayashi
  10. Takashi Kaito
  11. Satoshi Kato
  12. Yoshiharu Kawaguchi
  13. Masahiro Kanayama
  14. Hiroaki Sakai
  15. Takashi Tsuji
  16. Takeshi Miyamoto
  17. Hiroyuki Inose
  18. Toshitaka Yoshii
  19. Masafumi Kashii
  20. Hiroaki Nakashima
  21. Kei Ando
  22. Yuki Taniguchi
  23. Kazuhiro Takeuchi
  24. Shuji Ito
  25. Kohei Tomizuka
  26. Keiko Hikino
  27. Yusuke Iwasaki
  28. Yoichiro Kamatani
  29. Shingo Maeda
  30. Hideaki Nakajima
  31. Kanji Mori
  32. Atsushi Seichi
  33. Shunsuke Fujibayashi
  34. Tsukasa Kanchiku
  35. Kei Watanabe
  36. Toshihiro Tanaka
  37. Kazunobu Kida
  38. Sho Kobayashi
  39. Masahito Takahashi
  40. Kei Yamada
  41. Hiroshi Takuwa
  42. Hsing-Fang Lu
  43. Shumpei Niida
  44. Kouichi Ozaki
  45. Yukihide Momozawa
  46. Genetic Study Group of Investigation Committee on Ossification of the Spinal Ligaments
  47. Masashi Yamazaki
  48. Atsushi Okawa
  49. Morio Matsumoto
  50. Norimasa Iwasaki
  51. Chikashi Terao  Is a corresponding author
  52. Shiro Ikegawa  Is a corresponding author
  1. Laboratory for Bone and Joint Diseases, Center for Integrative Medical Sciences, RIKEN, Japan
  2. Laboratory for Statistical and Translational Genetics, Center for Integrative Medical Sciences, RIKEN, Japan
  3. Department of Orthopedic Surgery, Hokkaido University Graduate School of Medicine, Japan
  4. Department of Orthopedic Surgery, Keio University School of Medicine, Japan
  5. Department of Orthopaedic Surgery, Graduate School of Medical Sciences, Kyushu University, Japan
  6. Department of Orthopedics, Nagoya University Graduate School of Medicine, Japan
  7. Department of Orthopaedic Surgery, Osaka University Graduate School of Medicine, Japan
  8. Department of Orthopaedic Surgery, Graduate School of Medical Science, Kanazawa University, Japan
  9. Department of Orthopaedic Surgery, Toyama University, Japan
  10. Department of Orthopedics, Hakodate Central General Hospital, Japan
  11. Department of Orthopaedic Surgery, Spinal Injuries Center, Japan
  12. Department of Spine and Spinal Cord Surgery, Fujita Health University, Japan
  13. Department of Orthopedic Surgery, Kumamoto University, Japan
  14. Department of Orthopaedic Surgery, Tokyo Medical and Dental University, Japan
  15. Department of Orthopaedic Surgery, Faculty of Medicine, The University of Tokyo, Japan
  16. Department of Orthopaedic Surgery, National Okayama Medical Center, Japan
  17. Department of Orthopedic Surgery, Shimane University Faculty of Medicine, Japan
  18. Laboratory for Pharmacogenomics, Center for Integrative Medical Sciences, RIKEN, Japan
  19. Laboratory for Genotyping Development, Center for Integrative Medical Sciences, RIKEN, Japan
  20. Laboratory for Statistical Analysis, Center for Integrative Medical Sciences, RIKEN, Japan
  21. Department of Bone and Joint Medicine, Graduate School of Medical and Dental Sciences, Kagoshima University, Japan
  22. Department of Orthopaedics and Rehabilitation Medicine, Faculty of Medical Sciences, University of Fukui, Japan
  23. Department of Orthopaedic Surgery, Shiga University of Medical Science, Japan
  24. Department of Orthopedics, Jichi Medical University, Japan
  25. Department of Orthopaedic Surgery, Graduate School of Medicine, Kyoto University, Japan
  26. Department of Orthopedic Surgery, Yamaguchi University Graduate School of Medicine, Japan
  27. Department of Orthopaedic Surgery, Niigata University Medical and Dental General Hospital, Japan
  28. Department of Orthopaedic Surgery, Hirosaki University Graduate School of Medicine, Japan
  29. Department of Orthopaedic Surgery, Kochi Medical School, Japan
  30. Department of Orthopaedic Surgery, Hamamatsu University School of Medicine, Japan
  31. Department of Orthopaedic Surgery, Kyorin University School of Medicine, Japan
  32. Department of Orthopaedic Surgery, Kurume University School of Medicine, Japan
  33. Million-Person Precision Medicine Initiative, China Medical University Hospital, Taiwan
  34. Core Facility Administration, Research Institute, National Center for Geriatrics and Gerontology, Japan
  35. Medical Genome Center, Research Institute, National Center for Geriatrics and Gerontology, Japan
  36. Department of Orthopaedic Surgery, Faculty of Medicine, University of Tsukuba, Japan

Abstract

Ossification of the posterior longitudinal ligament of the spine (OPLL) is an intractable disease leading to severe neurological deficits. Its etiology and pathogenesis are primarily unknown. The relationship between OPLL and comorbidities, especially type 2 diabetes (T2D) and high body mass index (BMI), has been the focus of attention; however, no trait has been proven to have a causal relationship. We conducted a meta-analysis of genome-wide association studies (GWASs) using 22,016 Japanese individuals and identified 14 significant loci, 8 of which were previously unreported. We then conducted a gene-based association analysis and a transcriptome-wide Mendelian randomization approach and identified three candidate genes for each. Partitioning heritability enrichment analyses observed significant enrichment of the polygenic signals in the active enhancers of the connective/bone cell group, especially H3K27ac in chondrogenic differentiation cells, as well as the immune/hematopoietic cell group. Single-cell RNA sequencing of Achilles tendon cells from a mouse Achilles tendon ossification model confirmed the expression of genes in GWAS and post-GWAS analyses in mesenchymal and immune cells. Genetic correlations with 96 complex traits showed positive correlations with T2D and BMI and a negative correlation with cerebral aneurysm. Mendelian randomization analysis demonstrated a significant causal effect of increased BMI and high bone mineral density on OPLL. We evaluated the clinical images in detail and classified OPLL into cervical, thoracic, and the other types. GWAS subanalyses identified subtype-specific signals. A polygenic risk score for BMI demonstrated that the effect of BMI was particularly strong in thoracic OPLL. Our study provides genetic insight into the etiology and pathogenesis of OPLL and is expected to serve as a basis for future treatment development.

Editor's evaluation

This study builds on previous work to explore the genetic causes of ossification of the posterior longitudinal ligament of the spine (OPLL). A meta-Genome wide association study is conducted to increase detection power and a disease subtype analysis is completed that provides new information on if all sites of OPLL have uniform causes. Using additional open-source data, the GWAS results are explored further to find putatively causative genes and to explore causative co-existing conditions such as obesity for OPLL. Overall this study is by far the most complete genetic exploration of this disease to date and is instructive for future studies that will lead to treatments for this condition.

https://doi.org/10.7554/eLife.86514.sa0

Introduction

Ossification of the posterior longitudinal ligament of the spine (OPLL) is an incurable disease with progressive heterotopic ossification. It can occur at any spine level from the cervical to the lumbar spine, and ossified ligaments compress the spinal cord and roots, leading to a severe neurological deficit (Matsunaga and Sakou, 2012). OPLL is a common disease; however, its frequency varies depending on the region of the world; high in Asian countries (0.4–3.0%), especially Japan (1.9–4.3%), compared with Europe and the United States (0.1–1.7%) (Matsunaga and Sakou, 2012; Ohtsuka et al., 1987; Sohn and Chung, 2013; Yoshimura et al., 2014). However, its etiology and pathogenesis remain unknown. Histological studies suggest that OPLL develops through endochondral ossification (Sato et al., 2007; Sugita et al., 2013). In recent years, OPLL has been reported to have different clinical characteristics depending on the affected region: higher body mass index (BMI), earlier-onset of symptoms, and more diffuse progression of OPLL over the entire spine in the thoracic type of OPLL (T-OPLL) than in the cervical type (C-OPLL) (Endo et al., 2020; Hisada et al., 2022). This fact suggests that there may be differences in etiology and pathogenesis for each subtype of OPLL. Currently, there is no therapeutic or preventive measure for OPLL other than surgery to decompress the spinal cord and roots. Therefore, it is necessary to clarify its etiology and pathogenesis to develop effective measures to prevent and treat OPLL.

OPLL is assumed to be a polygenic disease where complex genetic and environmental factors interact. Epidemiological studies have reported the relationship between OPLL and various other traits, especially type 2 diabetes (T2D) (Akune et al., 2001; Kobashi et al., 2004), high BMI (Hou et al., 2017; Kobashi et al., 2004), low inorganic phosphate, X-linked hypophosphatemic rickets (Chesher et al., 2018), and increased C-reactive protein (Kawaguchi et al., 2017). Of these traits, T2D has been the focus of attention for a long time (Akune et al., 2001; Kobashi et al., 2004). Furthermore, because of the high incidence within families and close relatives in previous epidemiological studies, genetic factors have long been considered in OPLL development (Matsunaga et al., 1999; Sakou et al., 1991; Terayama, 1989), although there are no previous papers evaluating the heritability of OPLL such as twin studies. To understand the genetic factors associated with OPLL, we previously conducted a genome-wide association study (GWAS) and found six significant loci (Nakajima et al., 2014). In subsequent in silico and in vitro functional studies, we identified RSPO2 as a susceptibility gene for OPLL, and the role of Wnt signaling in the pathogenesis of OPLL was clarified (Nakajima et al., 2016). However, the pathogenesis of this condition remains largely unknown.

In this study, to clarify the etiology and pathogenesis of OPLL, we conducted a meta-analysis of GWASs and various post-GWAS analyses. We identified 14 significant loci, including 8 previously unreported susceptibility loci. Using a gene-based analysis (de Leeuw et al., 2015) and summary data-based Mendelian randomization (SMR) (Zhu et al., 2016), we identified three candidate genes for each. Using a genetic correlation analysis and a subsequent Mendelian randomization (MR) study, we identified a causal effect of high BMI on OPLL. A polygenic risk score (PRS) of BMI demonstrated the heterogeneity of the impact of obesity on OPLL subtypes.

Results

Novel susceptibility loci in OPLL

We conducted three GWASs (set 1–3) in the Japanese population (Supplementary file 1). After quality control of single-nucleotide polymorphism (SNP) genotyping data, we performed imputation and association analyses independently for each GWAS. Subsequently, we performed a fixed-effects meta-analysis combining the three GWASs (ALL-OPLL: a total of 2010 cases and 20,006 controls; Figure 1—figure supplement 1) and identified 12 genome-wide significant loci (p<5.0 × 10⁻⁸) (Figure 1). The genomic inflation factor (λGC) was 1.11 and showed slight inflation in GWAS; however, the intercept in linkage disequilibrium (LD) score regression (Bulik-Sullivan et al., 2015) was 1.03, indicating that inflation of the statistics was mainly from polygenicity and minimal biases of the association results (Figure 1—figure supplement 2).

Figure 1 with 17 supplements see all
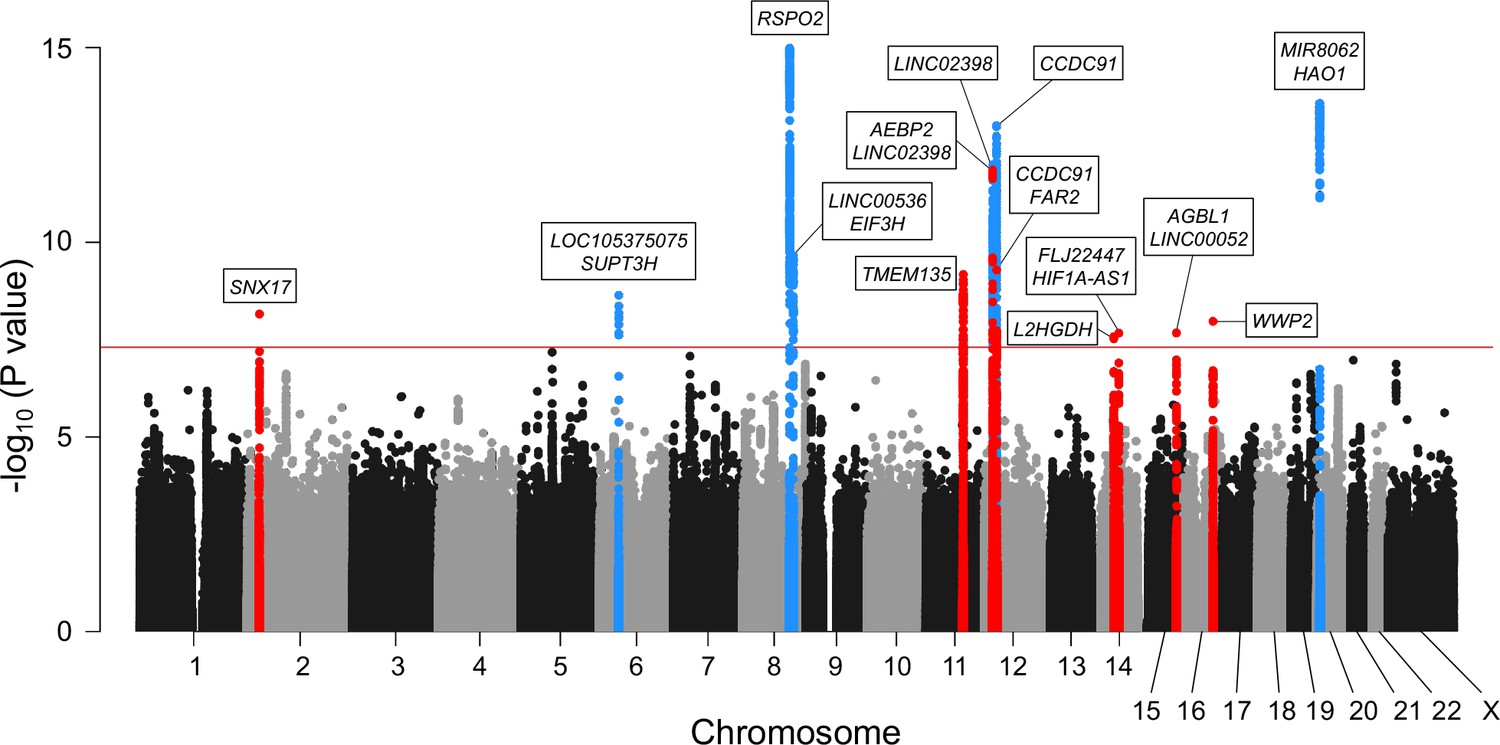
Meta-analysis of genome-wide association studies (GWAS) identified 14 significant loci in ossification of the posterior longitudinal ligament of the spine (OPLL).

Manhattan plot showing the -log10 p-value for each single-nucleotide polymorphism (SNP) in the meta-analysis. The values were plotted against the respective chromosomal positions. The horizontal red line represents the genome-wide significance threshold (p=5.0 × 10⁻⁸). Red and blue points represent the SNPs in the new and known loci, respectively.

Next, we conducted a stepwise conditional analysis to detect multiple independent signals. We detected two additional independent signals that showed genome-wide significance after conditioning (Supplementary file 2): rs35281060 (12p12.3, p=1.04 × 10⁻¹⁰) and rs1038666 (12p11.22, p=2.37 × 10⁻¹⁰) (Figure 1—figure supplement 3F–I). We also detected one additional signal (rs61915977, 12p11.22 p=1.39 × 10⁻⁶) that reached locus-wide significance (p<5.0 × 10⁻⁶) (Supplementary file 2). Thus, the meta-analysis and conditional analysis identified 14 genome-wide significant OPLL loci, including 8 novel loci. Significant associations of the six previously reported loci (Nakajima et al., 2014) were observed in the present study (Table 1, Figure 1, Figure 1—figure supplement 3). The estimated proportion of the phenotypic variance explained by all the variants used in the study was 53.1% (95% confidence interval [CI] 40.6–65.6%), indicating that OPLL has a high heritability. The lead variants of the 14 loci explained 6.5% of the phenotypic variance. Together with the LD score regression results, OPLL is a highly polygenic disease.

Table 1
Genome-wide significant loci in ossification of the posterior longitudinal ligament of the spine.
SNPCHRPosition(Region start- end)GeneNovel/knownREFALTOPLLpOR(95% CI)PhetGWAS 1GWAS 2GWAS 3
ALT freq.pOR(95% CI)ALT freq.pOR(95% CI)ALT freq.pOR(95% CI)
casecontrolcasecontrolcasecontrol
rs46659722 (p23.3)
27598097
(26598097–
28598097)
SNX17
(intronic)
NovelT
C
ALL7.00E-091.23
(1.15–1.32)
0.180.483
0.433
9.91E-071.27
(1.16–1.40)
0.474
0.425
3.73E-041.26
(1.11–1.43)
0.441
0.430
5.65E-011.05
(0.88–1.26)
Cervical5.38E-051.25
(1.12–1.39)
0.920.481
0.433
1.19E-031.25
(1.09–1.44)
0.469
0.425
1.59E-021.24
(1.04–1.48)
  • -

--
Thoracic3.49E-021.14
(1.01–1.28)
0.500.478
0.433
3.51E-021.24
(1.01–1.51)
0.454
0.425
3.05E-011.16
(0.87–1.53)
0.441
0.430
5.65E-011.05
(0.88–1.26)
rs9274856 (p21.1)
44538139
(43529797–
45538139)
LOC1053
75075,
SUPT3H

(intergenic)
KnownG
A
ALL2.30E-090.76
(0.70–0.83)
0.250.824
0.864
1.22E-070.72
(0.64–0.82)
0.843
0.860
6.39E-020.86 (0.73–1.01)0.829
0.872
7.98E-030.74
(0.59–0.92)
Cervical3.77E-030.82
(0.71–0.94)
0.460.835
0.864
5.95E-030.79
(0.66–0.93)
0.846
0.860
2.40E-010.87
(0.70–1.09)
--
Thoracic7.48E-060.72
(0.62–0.83)
0.920.818
0.864
2.63E-030.69
(0.55–0.88)
0.815
0.860
4.16E-020.71
(0.51–0.99)
0.829
0.872
7.98E-030.74
(0.59–0.92)
rs3748108 (q23.1)
109096029
(108022775–
110588327)
RSPO2
(upstream)
KnownG
A
ALL1.03E-150.75
(0.70–0.81)
0.930.323
0.387
9.56E-100.74
(0.68–0.82)
0.328
0.385
2.72E-050.77
(0.68–0.87)
0.329
0.395
2.06E-030.76
(0.64–0.90)
Cervical6.04E-080.75
(0.67–0.83)
0.140.337
0.387
6.95E-040.79
(0.69–0.91)
0.300
0.385
7.42E-060.67
(0.56–0.80)
--
Thoracic2.66E-070.73
(0.65–0.82)
6.6E-020.282
0.387
2.81E-060.62
(0.50–0.75)
0.366
0.385
4.85E-010.91
(0.70–1.19)
0.329
0.395
2.06E-030.76
(0.64–0.90)
rs18982878 (q23.3)
117579970
(116484907–
118588193)
LINC00536,
EIF3H
(intergenic)
KnownA
C
ALL2.18E-100.80
(0.75–0.86)
0.160.605
0.668
2.90E-090.75
(0.69–0.83)
0.625
0.664
8.33E-030.85
(0.75–0.96)
0.633
0.664
1.85E-010.89
(0.74–1.06)
Cervical1.10E-020.87
(0.78–0.97)
0.510.633
0.668
1.61E-020.85
(0.74–0.97)
0.641
0.664
2.92E-010.91
(0.77–1.08)
--
Thoracic2.18E-040.80
(0.71–0.90)
0.100.584
0.668
7.40E-050.68
(0.56–0.82)
0.637
0.664
3.80E-010.88
(0.67–1.16)
0.633
0.664
1.85E-010.89
(0.74–1.06)
rs3550524811 (q14.2)
86830927
(85724086–
87887931)
TMEM135
(intronic)
NovelT
A
ALL6.75E-100.81
(0.75–0.86)
0.440.624
0.665
1.76E-040.84
(0.76–0.92)
0.594
0.659
7.06E-060.76
(0.67–0.85)
0.604
0.649
1.90E-020.81
(0.68–0.97)
Cervical1.06E-040.81
(0.73–0.90)
2.7E-020.640
0.665
1.03E-010.89
(0.78–1.02)
0.577
0.659
3.30E-050.70
(0.60–0.83)
--
Thoracic4.53E-040.81
(0.72–0.91)
0.650.605
0.665
7.62E-030.77
(0.64–0.93)
0.635
0.659
4.67E-010.90
(0.69–1.19)
0.604
0.649
1.90E-020.81
(0.68–0.97)
rs3528106012 (p12.3)
19976182
(18955794–
20077000)
AEBP2
,LINC02398
(intergenic)
NovelTG
T
ALL1.39E-120.79
(0.74–0.84)
0.580.451
0.500
3.50E-060.81
(0.74–0.88)
0.451
0.506
2.92E-050.77
(0.69–0.87)
0.429
0.505
4.50E-040.73
(0.61–0.87)
Cervical1.06E-050.80
(0.72–0.88)
0.430.456
0.500
2.74E-030.82
(0.72–0.93)
0.445
0.506
8.81E-040.76
(0.64–0.89)
--
Thoracic1.48E-060.75
(0.67–0.85)
0.380.424
0.500
5.18E-040.72
(0.60–0.87)
0.482
0.506
3.94E-010.89
(0.69–1.16)
0.429
0.505
4.50E-040.73
(0.61–0.87)
rs1084144212 (p12.2)
20213600
(20077000–
21247540)
LINC02398
(ncRNA
_intronic)
KnownT
C
ALL1.03E-120.78
(0.73–0.84)
0.610.422
0.489
1.07E-080.77
(0.70–0.84)
0.424
0.480
6.60E-050.78
(0.69–0.88)
0.418
0.456
7.56E-020.85
(0.71–1.02)
Cervical1.57E-080.74
(0.67–0.82)
0.710.413
0.489
2.87E-060.73
(0.64–0.83)
0.420
0.480
1.40E-030.76
(0.65–0.90)
--
Thoracic1.80E-040.80
(0.71–0.90)
0.600.417
0.489
1.91E-030.74
(0.62–0.90)
0.432
0.480
1.32E-010.82
(0.62–1.06)
0.418
0.456
7.56E-020.85
(0.71–1.02)
rs1104952912 (p11.22)
28471504
(27300776–
28800000)
CCDC91
(intronic)
KnownC
T
ALL1.01E-130.77
(0.72–0.83)
0.630.569
0.629
6.72E-090.76
(0.69–0.83)
0.564
0.627
1.31E-050.76
(0.67–0.86)
0.572
0.601
5.63E-020.84
(0.70–1.00)
Cervical2.57E-060.78
(0.70–0.87)
0.890.575
0.629
3.06E-040.78
(0.69–0.90)
0.566
0.627
2.55E-030.77
(0.65–0.91)
--
Thoracic9.93E-060.77
(0.68–0.86)
0.290.541
0.629
6.68E-050.68
(0.57–0.82)
0.577
0.627
1.15E-010.80
(0.61–1.05)
0.572
0.601
5.63E-020.84
(0.70–1.00)
rs103866612 (p11.22)
29085005
(28800000–
30107711)
CCDC91,
FAR2
(intergenic)
NovelG
A
ALL5.09E-100.81
(0.76–0.87)
0.060.573
0.609
1.43E-030.86
(0.79–0.95)
0.532
0.613
8.18E-080.72
(0.64–0.81)
0.553
0.601
2.03E-020.81
(0.68–0.97)
Cervical5.48E-050.81
(0.74–0.90)
0.290.569
0.609
1.12E-020.85
(0.75–0.96)
0.546
0.613
9.33E-040.76
(0.65–0.89)
--
Thoracic2.89E-060.76
(0.68–0.85)
0.220.551
0.609
9.54E-030.79
(0.65–0.94)
0.496
0.613
3.43E-040.62
(0.48–0.81)
0.553
0.601
2.03E-020.81
(0.68–0.97)
rs1115773314 (q21.3)
50727523
(49727523–
51729133)
L2HGDH
(intronic)
NovelG
A
ALL2.65E-081.21
(1.13–1.29)
0.580.463
0.423
2.90E-041.18
(1.08–1.30)
0.478
0.419
7.52E-051.27
(1.13–1.43)
0.460
0.426
7.18E-021.17
(0.99–1.38)
Cervical5.28E-041.20
(1.08–1.32)
0.740.461
0.423
1.20E-021.18
(1.04–1.34)
0.468
0.419
1.60E-021.22
(1.04–1.44)
--
Thoracic1.48E-031.20
(1.07–1.34)
0.190.446
0.423
2.53E-011.11
(0.93–1.34)
0.517
0.419
2.89E-031.49
(1.15–1.93)
0.460
0.426
7.18E-021.17
(0.99–1.38)
rs5825559814 (q23.2)
62131805
(61131805–
63131805)
FLJ22447,
HIF1A-AS1
(intergenic)
NovelC
T
ALL2.16E-080.81
(0.75–0.87)
0.760.276
0.319
1.75E-040.83
(0.75–0.91)
0.278
0.324
1.67E-030.81
(0.71–0.92)
0.272
0.324
4.88E-030.76
(0.63–0.92)
Cervical2.19E-030.84
(0.75–0.94)
0.360.287
0.319
6.19E-020.87
(0.76–1.01)
0.271
0.324
9.53E-030.79
(0.65–0.94)
--
Thoracic1.36E-050.75
(0.66–0.86)
0.960.254
0.319
4.37E-030.73
(0.59–0.91)
0.270
0.324
8.52E-020.77
(0.57–1.04)
0.272
0.324
4.88E-030.76
(0.63–0.92)
rs18964674215 (q25.3)
88017055
(87017055–
89017055)
AGBL1,
LINC00052
(intergenic)
NovelG
A
ALL2.13E-082.03
(1.59–2.61)
0.420.026
0.012
2.49E-072.31
(1.68–3.17)
0.017
0.011
7.34E-021.57
(0.96–2.58)
0.020
0.012
7.05E-021.85
(0.95–3.60)
Cervical3.25E-052.14
(1.50–3.07)
0.670.025
0.012
2.88E-042.27
(1.46–3.53)
0.021
0.011
3.81E-021.92
(1.04–3.56)
--
Thoracic1.77E-021.72
(1.10–2.70)
0.570.022
0.012
6.48E-021.88
(0.96–3.68)
0.010
0.011
7.99E-010.83
(0.20–3.46)
0.020
0.012
7.05E-021.85
(0.95–3.60)
rs37698937616 (q22.1)
69854329
(68854329–
70854329)
WWP2
(intronic)
NovelT
TAG
ALL1.08E-080.79
(0.73–0.86)
0.450.660
0.693
4.48E-050.80
(0.71–0.89)
0.677
0.702
1.28E-020.83
(0.72–0.96)
0.639
0.699
7.28E-040.71
(0.58–0.87)
Cervical2.70E-040.80
(0.71–0.90)
0.830.658
0.693
2.65E-030.79
(0.68–0.92)
0.673
0.702
3.87E-020.81
(0.66–0.99)
--
Thoracic4.10E-070.71
(0.62–0.81)
0.810.631
0.693
5.18E-040.68
(0.54–0.84)
0.663
0.702
1.07E-010.77
(0.56–1.06)
0.639
0.699
7.28E-040.71
(0.58–0.87)
rs614044220 (p12.3)
7829397
(6713042–
8882559)
MIR8062,
HAO1
(intergenic)
KnownC
A
ALL2.70E-141.39
(1.28–1.51)
0.070.205
0.150
1.41E-111.48
(1.32–1.66)
0.197
0.153
3.33E-051.38
(1.18–1.60)
0.155
0.143
5.10E-011.08
(0.85–1.38)
Cervical4.47E-081.42
(1.25–1.61)
0.610.204
0.150
3.67E-061.46
(1.24–1.71)
0.196
0.153
3.06E-031.36
(1.11–1.67)
--
Thoracic2.45E-021.19
(1.02–1.39)
0.220.197
0.150
5.64E-031.39
(1.10–1.76)
0.153
0.153
9.38E-011.01
(0.71–1.46)
0.155
0.143
5.10E-011.08
(0.85–1.38)
  1. SNP, single-nucleotide polymorphism; CHR, chromosome; REF, reference; ALT, alternative; OPLL, ossification of the posterior longitudinal ligament of the spine; GWAS, genome-wide association study; OR, odds ratio; CI, confidence interval; ALL, cervical + thoracic + others.

  2. *Gene in or near region of association.

  3. Phet was derived from a Cochran’s Q-test for heterogeneity.

Adjacent to lead variants in the novel loci, we found several candidate genes (Figure 1) reported to be related to osteogenesis and could be connected to OPLL development. TMEM135 (transmembrane protein 135), a gene in the newly identified significant locus (11q14.2), is a multi-transmembrane protein with seven transmembrane helices of high confidence. It is more strongly expressed in multipotent adipose tissue-derived stem cells committed to osteoblastic cells than the adipogenic lineage (Scheideler et al., 2008). WWP2 (WW domain-containing E3 ubiquitin-protein ligase 2), the nearest gene to rs376989376 (the lead SNP in 16q22.1), was recently reported to serve as a positive regulator of osteogenesis by augmenting the transactivation of RUNX2, a master regulator of osteoblast differentiation as well as for chondrocyte maturation during skeletal development (Zhu et al., 2017).

All lead SNPs and SNPs in high LD (r2 > 0.8) with them in previously unreported significant loci were in intron or intergenic regions, and none of them were exonic variants (Supplementary file 3). To prioritize putative causal variants, we conducted a Bayesian statistical fine-mapping analysis for significant loci using FINEMAP (Benner et al., 2016). The lead SNPs had the highest posterior probability (PP) in any significant region, and two of them were higher than 0.5: rs4665972 (2p23.3, p=0.548) and rs1038666 (12p11.22, p=0.533) (Supplementary file 4).

Statistical power analysis

We examined the statistical power for minor allele frequency (MAF) and odds ratio of lead SNPs within the 14 independent significant regions in GWAS meta-analysis for ALL-OPLL. The results showed that all had a power greater than 0.5 for a significance level of p-value = 5 × 10⁻⁸, and nine had a power greater than 0.8 (Figure 1—figure supplement 4).

Enrichment in genes involved in bone metabolism

We conducted a gene set enrichment analysis implemented in FUMA (Watanabe et al., 2017). We found significant enrichment in the set related to bone mineral density (BMD): BMD of the heel (p=8.60 × 10⁻⁸), pediatric lower limb (p=9.24 × 10⁻⁵), and pediatric total body less head (p=2.68 × 10⁻⁴) (Supplementary file 5), compatible with the critical roles of bone metabolism in OPLL. However, we observed no significant enrichment in BMD in adults measured by dual-energy X-ray absorptiometry in this analysis.

Identification of novel candidate genes missed by the GWAS meta-analysis

To identify other candidate genes, we conducted a gene-based association analysis (de Leeuw et al., 2015; Watanabe et al., 2017). We found three additional genes significantly associated with OPLL: EIF3E, EMC2, and TMEM135 (Figure 2, Supplementary file 6). EIF3E and EMC2 are in the same locus most strongly associated with OPLL as RSPO2 (8q23.1.). EIF3E (eukaryotic translation initiation factor 3 subunit E) encodes a protein that is a component of the eukaryotic translation initiation factor 3 (eIF-3) complex, which functions in and is essential for several steps in the initiation of protein synthesis (Lee et al., 2015; Masutani et al., 2007). A proteomics study in a rat model of heterotopic ossification reported that Eif3e was upregulated in ossified tissues and may be involved in tissue ossification by regulating hypoxia-inducible factor (HIF) signaling, which has an important role in osteogenesis (Wei et al., 2022). EMC2 (endoplasmic reticulum membrane protein complex subunit 2) encodes a part of the endoplasmic reticulum membrane protein complex (EMC) that functions in the energy-independent insertion of newly synthesized membrane proteins into the endoplasmic reticulum membrane, an essential cellular process (Chitwood et al., 2018; O’Donnell et al., 2020). However, basic experiments evaluating the effects of EMC2 on ligament and bone tissue have not been reported, and the mechanisms involved in OPLL are unknown. On the other hand, this analysis reinforced the possible involvement of TMEM135 in the development of OPLL.

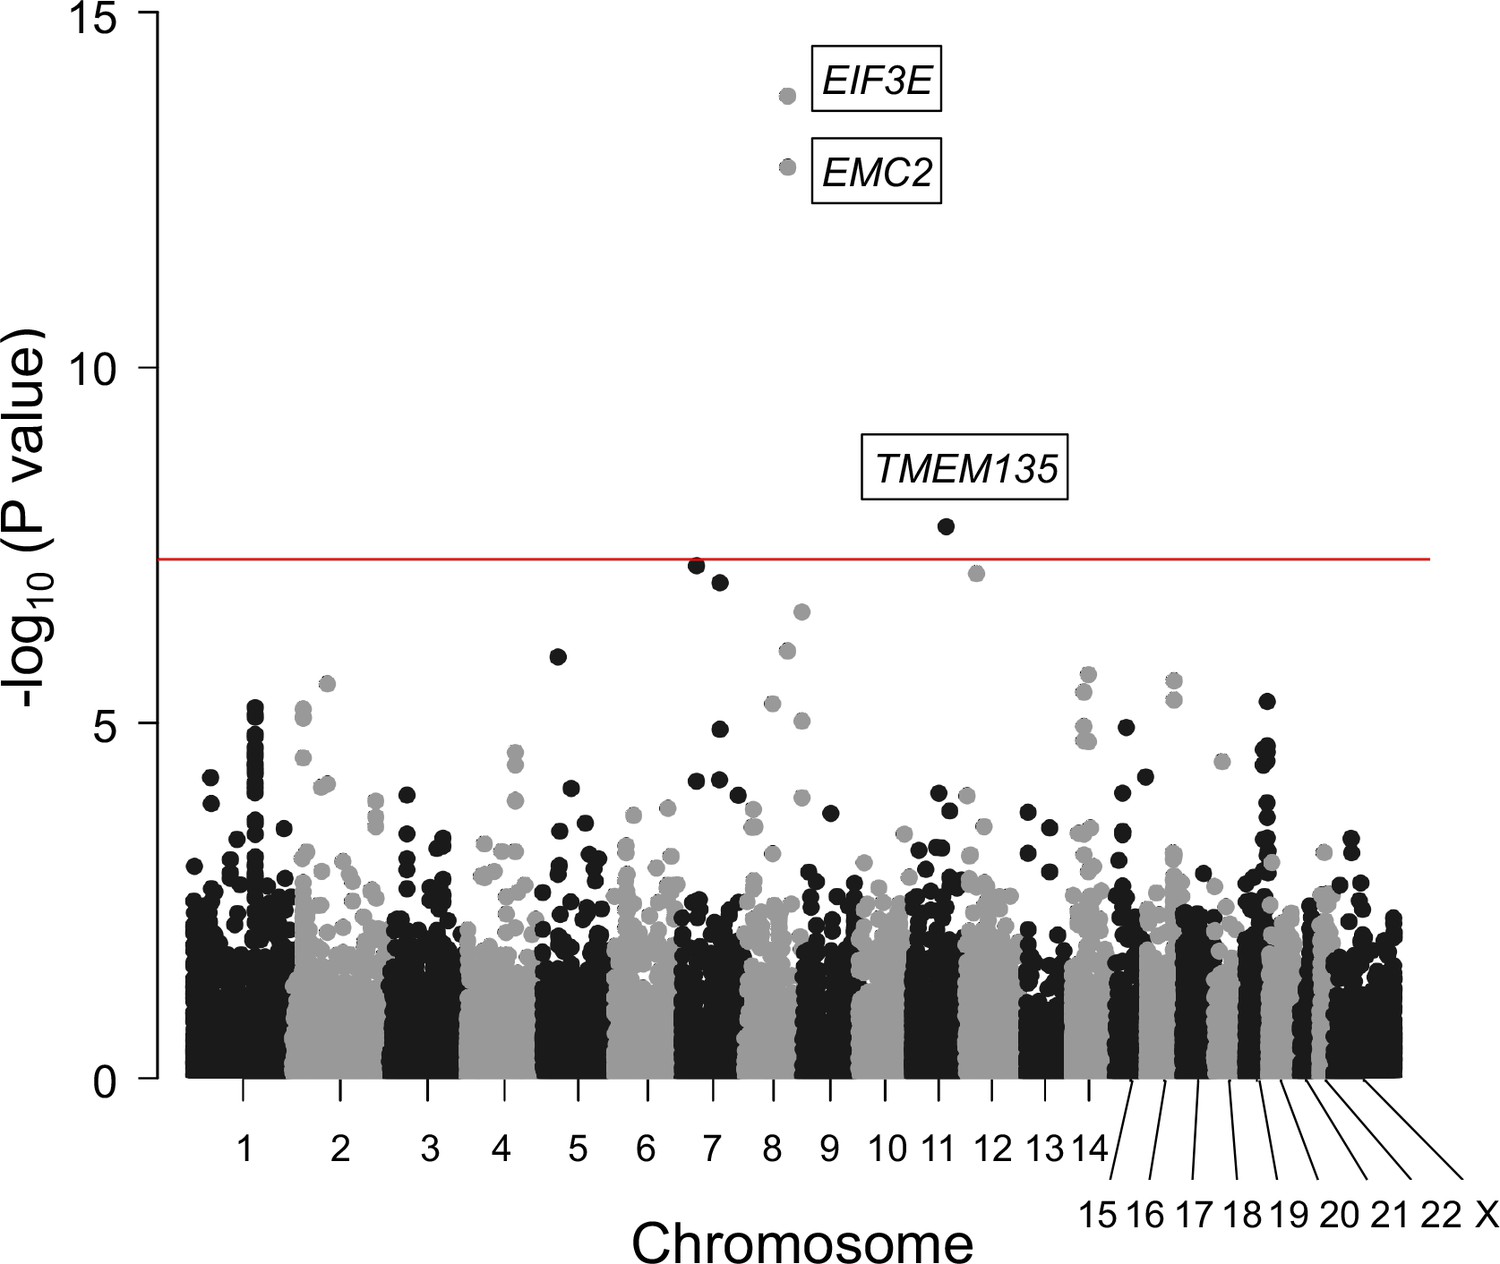
Gene-based association analysis identified five significantly associated genes in ossification of the posterior longitudinal ligament of the spine (OPLL).

Manhattan plot showing the -log10 p-value for each gene in the analysis. The values were plotted against the respective chromosomal positions. The horizontal red lines represent significance threshold (p=5.0 × 10⁻⁸).

The lack of exonic variants suggests that altering gene expression levels is a key function of OPLL-associated variants. By searching expression quantitative trait loci (eQTL) data in all available tissues in GTEx (Consortium, 2015), we found 26 transcripts with cis-eQTL variants associated with OPLL signals; of these, 20 transcripts were in the novel loci (Supplementary file 7). Furthermore, SMR (Zhu et al., 2016) revealed a total of 10 gene–tissue pairs (three unique genes, namely, RSPO2, PLEC, and RP11-967K21.1) that surpassed the genome-wide significance level (PSMR < 8.4 × 10⁻⁶) without heterogeneity (PHEIDI < 0.05) (Supplementary file 8). RSPO2 is located in the most significant locus in GWAS meta-analysis, and its functions related to OPLL were elucidated in a past study (Nakajima et al., 2016). PLEC is expressed in various tissues, including muscles and fibroblasts (Consortium, 2015), and PLEC deficiency causes epidermolysis bullosa simplex with muscular dystrophy (OMIM 226670) (Smith et al., 1996), in which osteoporosis frequently develops (Chen et al., 2019). Since increased expression of PLEC was estimated to have a causal effect on OPLL (Figure 1—figure supplement 5, Supplementary file 8), these results suggest that PLEC is a likely causal gene of OPLL. As for RP11-967K21.1, its function in OPLL development is currently unknown and is expected to be elucidated in future studies.

Cell groups and cell types related to OPLL

We conducted partitioning heritability enrichment analyses to investigate cell groups related to OPLL. We observed significant enrichment in the active enhancers of the connective/bone cell group and the immune/hematopoietic cell group (Supplementary file 9). We then analyzed each cell type belonging to these groups and found significant enrichment of H3K27ac in chondrogenic differentiation cells (Supplementary file 10). These results concord with previous findings that in OPLL chondrocyte differentiation in the endochondral ossification process occurs (Sugita et al., 2013) and provide new insights into the involvement of immune system cells in OPLL development, which has received little attention to date.

Subtype analyses of OPLL

Subtype-stratified GWAS meta-analyses were also conducted: cervical (C)-OPLL (820 cases and 14,576 controls) and thoracic (T)-OPLL (651 cases and 20,007 controls). Subsequently, we identified three significant loci for C-OPLL and nine significant loci for T-OPLL (Figure 1—figure supplements 69, Supplementary file 11). Of these loci, one in the C-OPLL analysis and nine in the T-OPLL analysis were not identified in the analysis of ALL-OPLL and other OPLL subtypes. However, most of the lead SNPs in these significant loci were rare variants. We cannot determine that these are the causal variants based on the present results alone, but there was an interesting variant among them. rs74707424, a leading SNP in the significant locus (19p12), is located in the 3′-untranslated region of the ZBTB40 gene. In a recent study using primary osteoblasts of mouse calvaria, Doolittle et al. reported that Zbtb40 functions as a regulator of osteoblast activity and bone mass, and knockdown of Zbtb40, but not Wnt4, in osteoblasts drastically reduced mineralization (Doolittle et al., 2020). We did not find significant genes in the gene-based analysis (data not shown).

Expression of candidate genes in the spinal ligament in humans and mice

We then examined the expression of 23 genes of interest (ALL-OPLL GWAS: 19 genes; gene-based analysis: 2 genes; and SMR: 2 genes) in the spinal ligament, a target tissue of OPLL (see Supplementary file 12 for detailed information on the number of genes). We used the deposited RNA-sequencing (RNA-seq) data in the spinal ligament (yellow ligament) in patients with OPLL and cervical spondylotic myelopathy (CSM) (GSE188760), and chondrogenic differentiation of human spinal ligament cells and controls (GSE188759) (Tachibana et al., 2022). Both data sets included 20/23 genes, of which we found 14/20 (70%) and 15/20 (75%) expressed in spinal ligament tissue in GSE188760 and GSE188759, respectively. In addition, the expression tended to be different between OPLL patients and CSM patients. Especially, the expressions of WWP2, EIF3H, and SNX17 showed nominally significant differences (see ‘Materials and methods’ and Figure 1—figure supplement 10). WWP2 was more highly expressed in chondrogenic differentiated ligament cells than in undifferentiated ligament cells (see ‘Materials and methods’ and Figure 1—figure supplement 11). The expression of WWP2 has a positive effect on bone formation (Scheideler et al., 2008). We should revalidate these results with larger data sets in the future.

Next, to further explore expressions of these genes in single-cell levels, we used deposited single-cell RNA sequencing (scRNAseq) data of Achilles tendon cells in murine ossification models: burn/tenotomy heterotopic ossification model (GSE126060) (Sorkin et al., 2020) and Achilles tendon puncture model (GSE188758) (Tachibana et al., 2022). The Uniform Manifold Approximation and Projection (UMAP) identified 13 and 9 clusters in GSE126060 and GSE188758, respectively (Figure 1—figure supplements 1215). Both data sets contained information on the same 14/23 genes. We confirmed that 12/14 (85.7%) of these genes are expressed in both mesenchymal and immune-related cells (macrophage, dendritic cell, and lymphocyte) in both data sets. These results are concordant with the results of partitioning heritability analysis, suggesting that not only the mesenchymal cells which differentiate into ligament and chondrocyte cells but also the immune cells are involved with ligament ossification.

We also conducted the same analyses for the candidate genes uniquely found in T- and C-OPLL and found the expression of most of the genes in ligamentous tissues.

Causality of high BMI on OPLL

Epidemiological studies have suggested a relationship between OPLL and various other diseases and traits (Akune et al., 2001; Endo et al., 2020; Kawaguchi et al., 2017; Kobashi et al., 2004), particularly with T2D (Akune et al., 2001; Kobashi et al., 2004). We investigated their relationship with OPLL using the GWAS data. We first calculated the genetic correlation between OPLL and 96 complex traits (mean number of around 130K) (Akiyama et al., 2019; Akiyama et al., 2017; Ishigaki et al., 2020; Kanai et al., 2018; see Supplementary file 13 for the traits analyzed). We found a positive genetic correlation between OPLL and BMI and T2D. The genetic correlation estimate (rg) was higher in the BMI group than in the T2D group. In addition, we identified new negative correlations between cerebral aneurysms (Figure 3, Supplementary file 13).

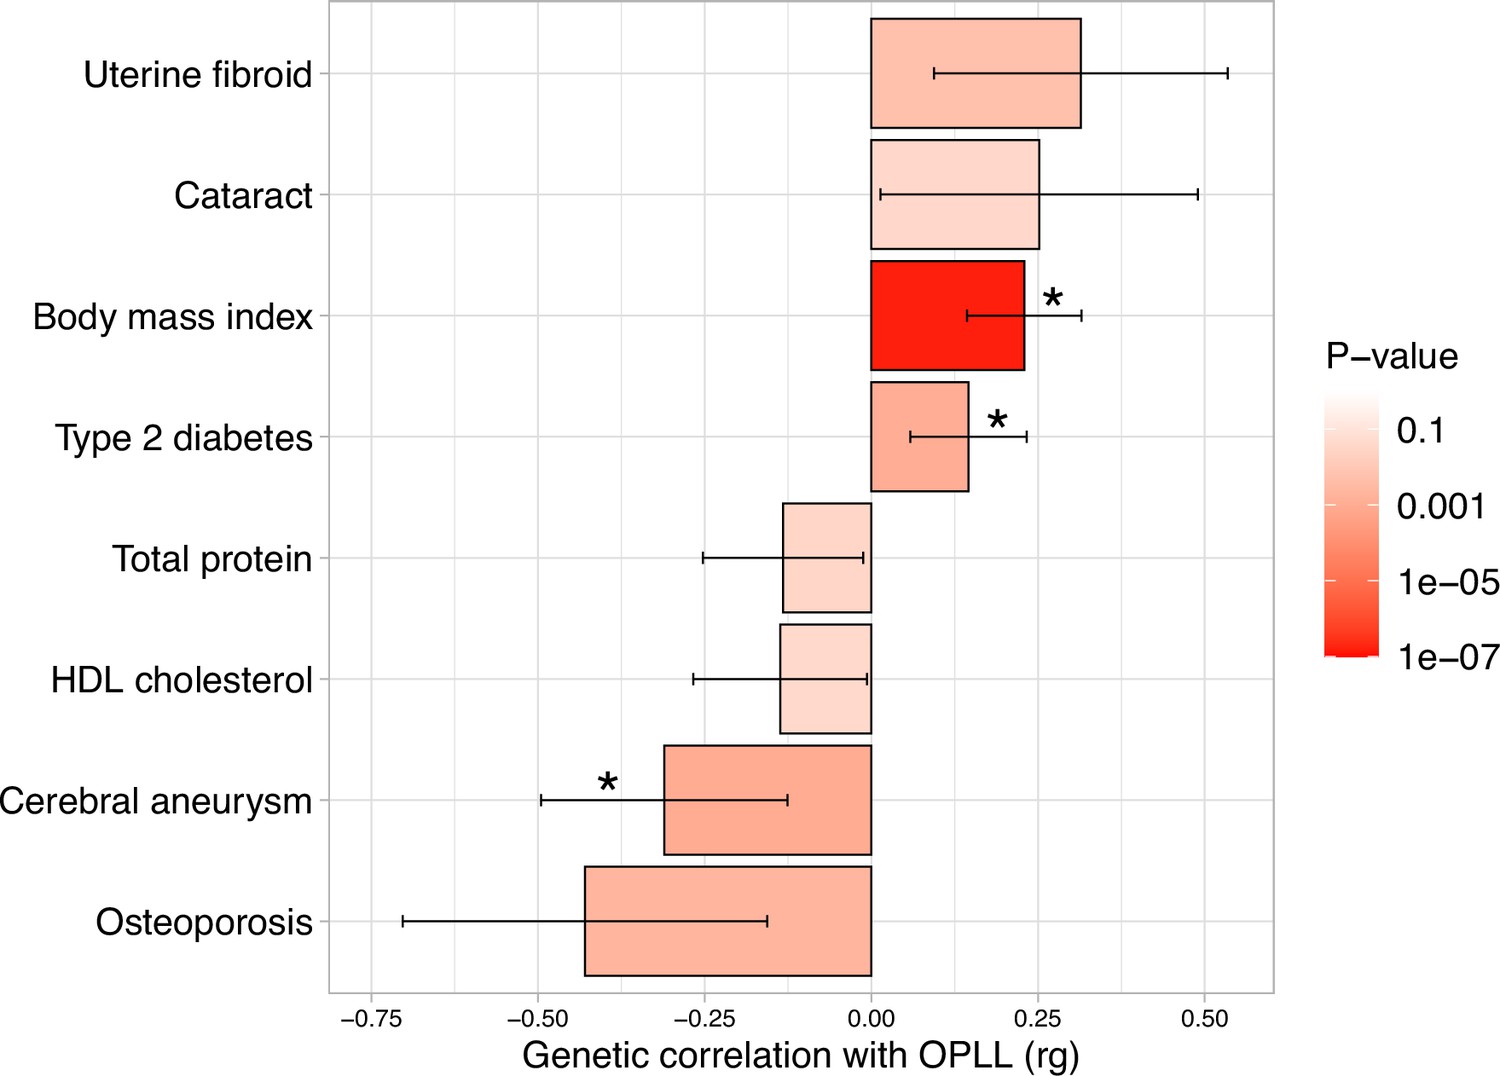
Genetic correlation between ossification of the posterior longitudinal ligament of the spine (OPLL) and other complex traits.

Significant positive correlations with body mass index (BMI) and type 2 diabetes, and negative correlations with cerebral aneurysm were observed. Error bars indicate 95% confidence intervals. Red color gradations represent the level of p-value. Noted by asterisk is the significant correlation (false discovery rate [FDR] < 0.05).

Next, we conducted a two-sample MR using summary data from GWASs (Akiyama et al., 2017; Bakker et al., 2020; Kemp et al., 2017; Spracklen et al., 2020) to assess the causal effects of these significant traits in genetic correlation analysis on OPLL (Evans and Davey Smith, 2015; Lawlor et al., 2008; Figure 4—figure supplement 1, Supplementary file 14). The result of genetic correlation analysis for osteoporosis barely did not reach the false discovery rate (FDR)-corrected significance level, but we included it in the MR evaluation because there have been several previous reports of a strong trend toward whole-body ossification in OPLL patients (Hukuda et al., 1983; Mori et al., 2016; Nishimura et al., 2018; Yoshii et al., 2019). In the analysis, we used BMD, the main diagnostic criteria item for osteoporosis. BMD in the spine may reflect artifacts from OPLL itself, but higher BMD was also reported in patients with OPLL in the femur and the radius, a non-weight-bearing bone (Sohn and Chung, 2013; Yamauchi et al., 1999).

The significant causal effect of increased BMI on ALL-OPLL was estimated using the inverse variance weighted (IVW) method and the weighted median method (Figure 4, Figure 4—figure supplement 2, Supplementary file 15). The average pleiotropic effect of the MR-Egger regression intercept was close to zero (MR-Egger intercept = 0.005, p=0.581), indicating no evidence of the influence of directional pleiotropy (Figure 4—figure supplement 2, Supplementary file 16). We also assessed potential bias in the MR with a leave-one-out analysis and funnel plots; however, we did not identify any obvious bias (Figure 4—figure supplement 3). In contrast, we could not find any causal effects of T2D on ALL-OPLL with any MR methods (Figure 4, Figure 4—figure supplement 4, Supplementary file 15). As for BMD, we found a weak but significant causal effect of increased BMD on ALL-OPLL using multiple MR methods (Figure 4, Figure 4—figure supplement 5, Supplementary file 15), and the involvement of factors that stimulate bone formation in OPLL was suggested. Regarding cerebral aneurysms, the direction of the beta estimates differed according to the MR methods because of the small number of SNPs used as the instrumental variables (Figure 4, Figure 4—figure supplement 6, Supplementary file 15).

Figure 4 with 13 supplements see all
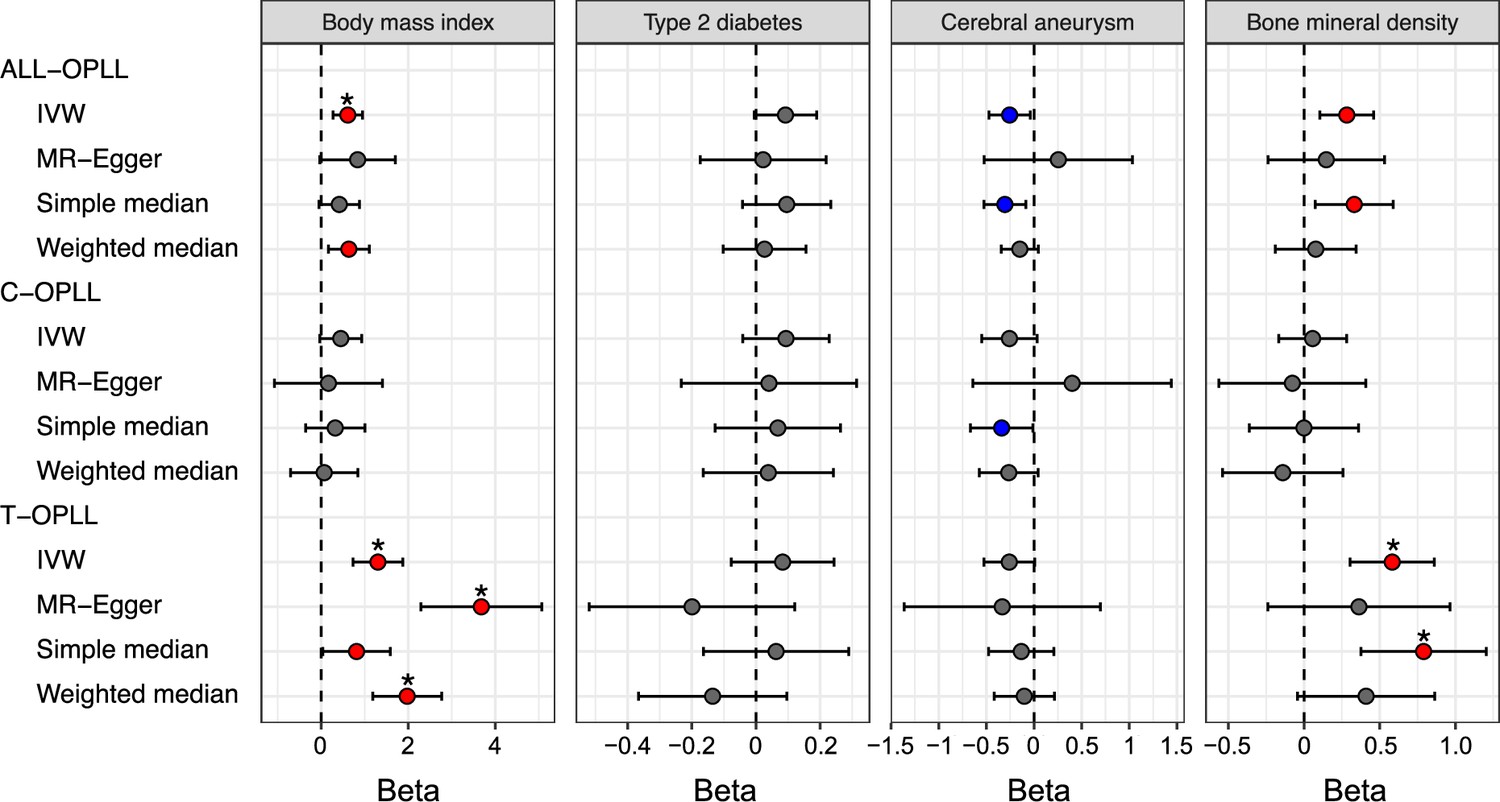
Causal effect of body mass index, type 2 diabetes, cerebral aneurysm, and bone mineral density on ossification of the posterior longitudinal ligament of the spine (OPLL).

Causal effects were estimated using two-sample Mendelian randomization (MR) methods. Error bars indicate 95% confidence intervals. Significant (p<0.05) results are shown as red and blue dots for positive and negative causal effects, respectively. Noted by asterisk are the items that meet strict threshold (p<0.05/48=1.04 × 10–3). IVW, inverse variance weighted.

We performed a reverse-direction MR to evaluate the causality of OPLL on BMI, T2D, cerebral aneurysm, and BMD but did not find any significant causal effects on the four traits (Figure 4—figure supplement 7, Supplementary files 17 and 18).

The large causal effect of high BMI and high BMD on T-OPLL

We estimated the causal effect of traits with a significant genetic correlation with OPLL subtypes. We found contrasting results between C- and T-OPLL. A significant causal effect of increased BMI on T-OPLL, but not on C-OPLL, was indicated by all four MR methods. All beta estimates on T-OPLL were greater than those in the analysis for ALL-OPLL (Figure 4, Figure 4—figure supplements 2 and 8, Supplementary file 15), suggesting that T-OPLL drove the causal effect of BMI on OPLL. The MR-Egger regression intercept was significantly negative, suggesting the existence of directional pleiotropy (Figure 4—figure supplement 8, Supplementary file 16); however, the results of other sensitivity analyses for robust causal inference (simple and weighted median methods) suggested its causality on T-OPLL (Figure 4, Figure 4—figure supplements 8 and 9, Supplementary file 15). As for BMD, a larger causal effect of increased BMD on T-OPLL compared to ALL-OPLL was also estimated (Figure 4, Figure 4—figure supplement 5, Supplementary file 15). We did not find any significant effects in T2D or cerebral aneurysms except for the results using the simple median method for cerebral aneurysms.

Additional MR for obesity-related traits

Based on the above MR results, we focused on the causal relationship between high BMI, that is obesity, and OPLL. First, we repeated MR using only Japanese BMI data (Akiyama et al., 2017) to estimate causal effects on OPLL as a sensitivity analysis. As a result, we confirmed the positive direction of the effect. Furthermore, the results were significant for T-OPLL, reinforcing the causality of BMI on T-OPLL (Supplementary file 19).

Next, we conducted additional MR for obesity-related traits. We used the data from the large GWAS meta-analyses for obesity-related traits from UK Biobank (UKBB) and Giant Consortium: BMI, waist-to-hip ratio (WHR), and WHR adjusted by BMI (WHRadjBMI) (Pulit et al., 2019; Supplementary file 20). Regarding causality from BMI to OPLL, all four MR methods showed significant causality for ALL- and T-OPLL, while only IVW method showed causality for C-OPLL (Figure 4—figure supplement 10, Supplementary file 21). Regarding causality from WHR to OPLL, 2/4 and 3/4 MR methods showed significant causality for ALL- and T-OPLL, respectively, but no significant results were obtained for C-OPLL by either method. For both traits, the magnitude of the causal effect size estimated by MR tended to be larger for C-, ALL-, and T-OPLL, in that order, suggesting a strong influence of obesity on the development of T-OPLL. On the other hand, no significant causal relationship was found in the MR on OPLL from WHRadjBMI, a surrogate index of abdominal adiposity. It suggests that systemic obesity, rather than a simple high percentage of abdominal fat, influences the development of OPLL.

The polygenic causal effect of high BMI on OPLL

In addition to the causal effects of significant variants with BMI on OPLL, we evaluated the shared polygenic architecture between BMI and OPLL. Moderate correlations were found between the effect sizes of the SNPs of ALL- and T-OPLL with BMI, especially in sets of SNPs with low p-values (p<0.0005), when calculating the correlation based on p-value in the BMI GWAS. We did not find such correlations when calculating the correlation based on the p-value in the OPLL GWAS (Figure 4—figure supplement 11). However, this difference was not observed in the sets of SNPs of any p-value groups in the C-OPLL analysis. These results support the theory that high BMI is one of the causal factors of OPLL, and its causal effect on OPLL is driven by that on T-OPLL.

Heterogeneity of impact of obesity inside OPLL subtypes

Finally, we generated a PRS of BMI and compared its effect on OPLL for ALL-OPLL, C-OPLL, and T-OPLL (Figure 5—figure supplements 1 and 2). We found that BMI PRS could predict OPLL, especially T-OPLL (Figure 5). Further, the effect sizes of BMI PRS on OPLL were all larger than that on T2D analyzed in a similar manner (‘Materials and methods’) (beta = 0.099, 95% CI 0.087–0.110), indicating that high BMI is a major cause of OPLL.

Figure 5 with 2 supplements see all
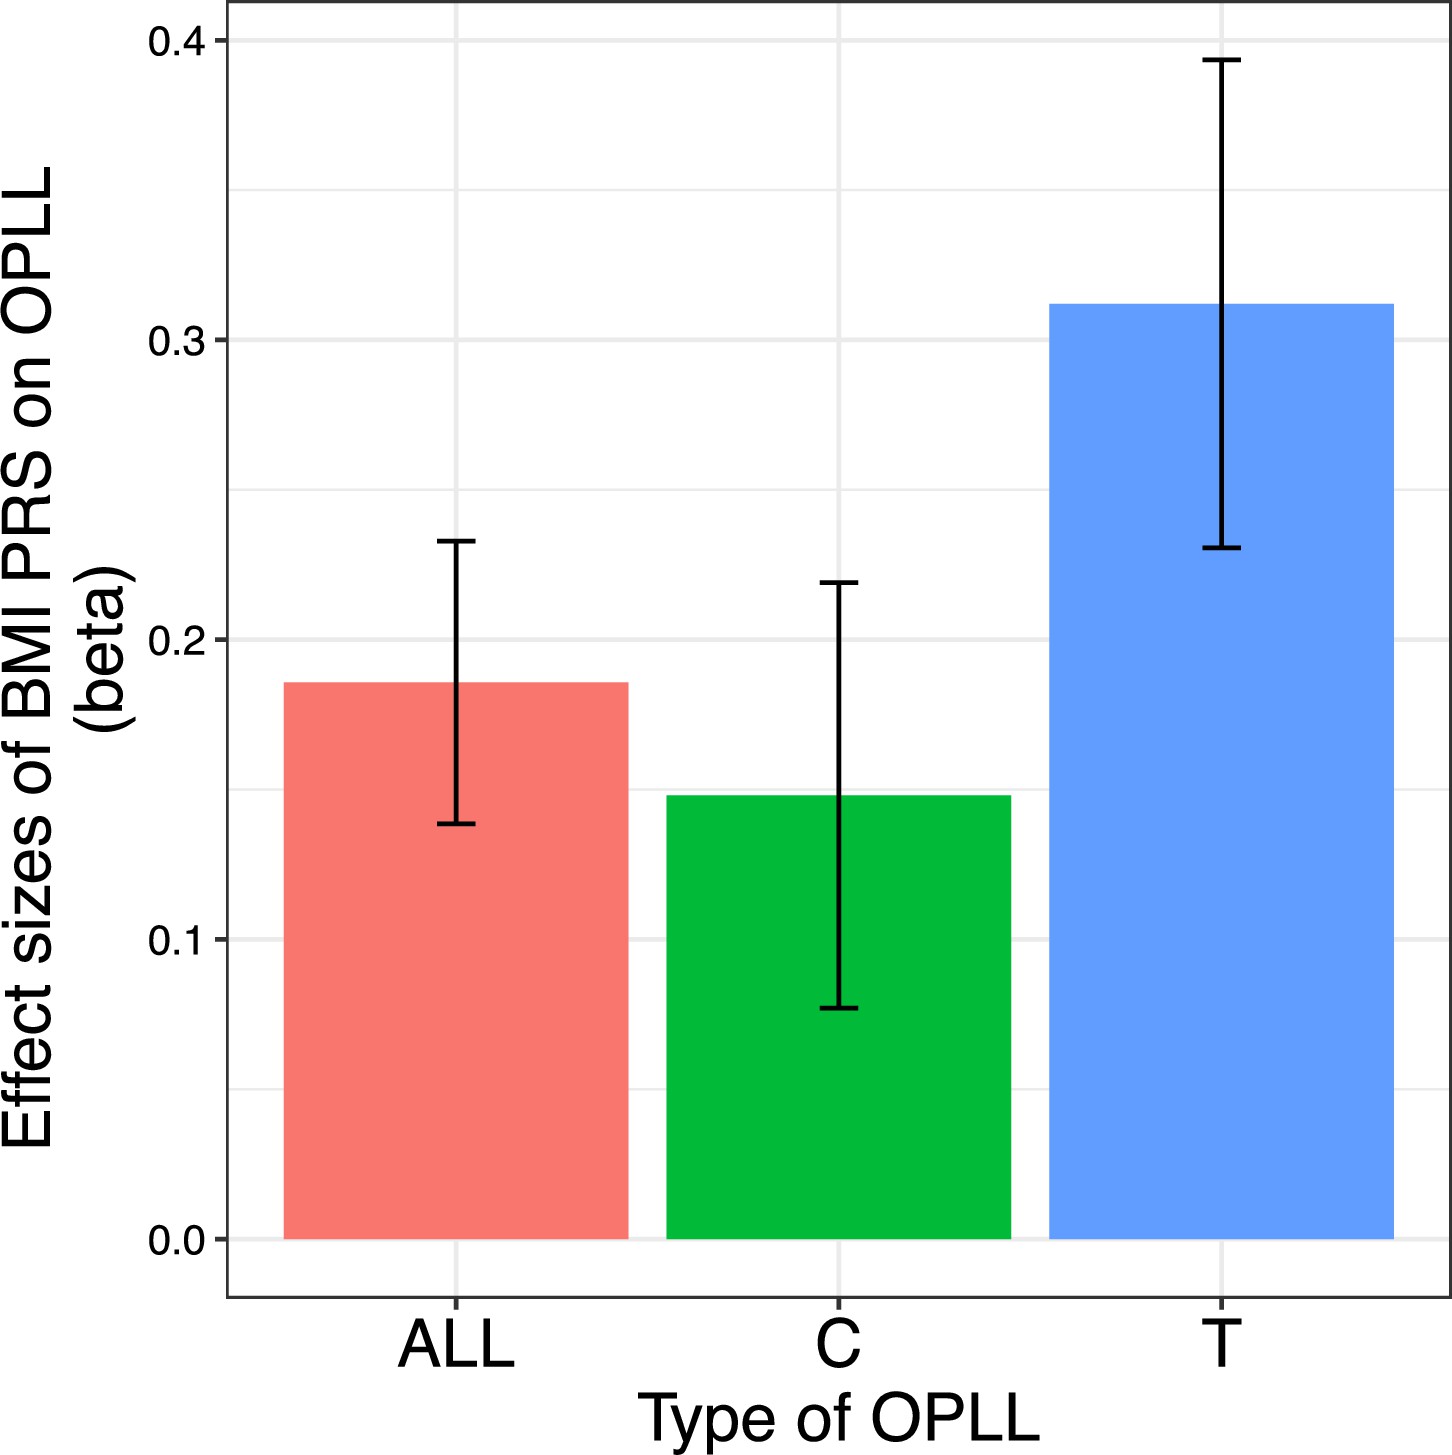
Body mass index (BMI) polygenic risk score predicts ossification of the posterior longitudinal ligament of the spine (OPLL).

Vertical columns represent effect sizes of BMI polygenic risk score (PRS) on three types of OPLL: cervical (C-) OPLL, thoracic (T-) OPLL, and ALL-OPLL (C-OPLL, T-OPLL, and others). The BMI PRS could predict OPLL, especially T-OPLL. Error bars represent the 95% confidence intervals of the effects.

Comparing C- and T-OPLL, we found that the effect of BMI PRS was significantly greater in T-OPLL (p=0.016), even in a limited number of cases.

Validity of this study reinforced by the replication study

To assess the validity of our GWAS meta-analysis, we conducted an association analysis using replication data of additional 2105 individuals (212 T-OPLL cases and 1866 controls). As for ALL-OPLL, we confirmed that the direction of betas for the lead SNPs in most regions (13/14) is consistent between the GWAS meta-analysis and the replication study (p=1.83 × 10⁻³, binomial test). Thus, the validity of the ALL-OPLL signals was reinforced (Figure 1—figure supplement 16). As for T-OPLL, the concordant rate was a little lower (6/9 of the lead SNPs), explained by low power in the additional data set to detect associations of rare alleles.

Next, we re-analyzed MR with expanded results of OPLL (‘Materials and methods’). The addition of new replication data further strengthened the significance of the causal effect from BMI and BMD to OPLL (Figure 4—figure supplement 12, Supplementary files 15 and 16). For T2D, the result was only nominally significant in the IVW method (p=4.86 × 10⁻²), and the causal effect from T2D to OPLL was not certain. Results of cerebral aneurysms showed little change, indicating a little causal effect on OPLL. We performed the same replication analysis for MR using obesity-related traits data from UKBB and Giant consortium (Figure 4—figure supplement 13, Supplementary files 21 and 22). The causal relationship from them to OPLL was further reinforced for BMI and WHR. WHRadjBMI demonstrated comparable results.

Discussion

This study conducted a GWAS meta-analysis using 2010 OPLL cases and 20,006 controls and identified 14 significant loci, including 8 novel loci. Although many unknowns exist regarding the function of the six regions found in the past, functional analysis of chromosome 8 (q23.1), where RSPO2 is located, has progressed. rs374810, the most significant variant in the present and the past study, is located on the promoter region of RSPO2 in chondrocytes. Its risk allele (C allele) causes a loss of transcription factor C/EBPβ binding; therefore, RSPO2 expression is reduced. Finally, the Wnt-β-catenin signal that blocks chondrocyte differentiation of ligament MSCs is suppressed, which triggers OPLL generation (Nakajima et al., 2016). Some of the newly discovered OPLL-related signals are in or near genes such as TMEM135 and WWP2, which are associated with the activation of bone formation (Scheideler et al., 2008; Zhu et al., 2017). In addition, we identified six genes associated with OPLL using gene-based analysis and an SMR: EIF3E, EMC2, TMEM135, PLEC, RSPO2, and RP11-967K21.1. RSPO2 and TMEM135 were also found in the GWAS meta-analysis, reinforcing the results. EIF3E is suspected to be involved in heterotopic ossification by regulating HIF signaling, which has an important role in osteogenesis (Wei et al., 2022). In addition, EIF3E is also the nearest gene to the lead variant within the significant locus in previous GWAS for heel bone mineral density: rs7815105; beta = –0.014 (same direction as this study); p=4.9 × 10⁻¹¹ (Morris et al., 2019). The PLEC mutation causes epidermolysis bullosa, in which osteoporosis is one of the main comorbidities. Although various causes have been reported to induce osteoporosis in this disease (Chen et al., 2019), the underlying biological mechanism by which PLEC mutations affect bone metabolism is unclear, and future studies are expected to elucidate this mechanism. Although the effects of EMC2 and RP11-967K21.1 on ligament and bone tissue have not been reported and are unknown, future studies may elucidate the mechanisms and reveal that they are the actual causal genes. Thus, our GWAS observations are compatible with the theory that OPLL is closely related to bone metabolism and develops through endochondral ossification (Sato et al., 2007; Sugita et al., 2013).

Partitioning heritability enrichment analyses by LD score regression identified that OPLL GWAS signals enrich not only the active enhancers of the connective/bone cell group but also those of the immune/hematopoietic cell group. It is well known that heterotopic ossification of ligaments and tendons, in which mesenchymal stem cells differentiate into osteochondrogenic cells rather than myocytes or tenocytes, is triggered by tissue damage due to trauma (Convente et al., 2018; Torossian et al., 2017). Tissue injury triggers a systematic inflammatory response with the mobilization of neutrophils, monocytes, and lymphocytes at various stages of inflammation. Monocytes/macrophages are involved in abnormal wound healing and influence the development of heterotopic ossification (Sorkin et al., 2020). This fact suggests that immune system cells are involved in the tissue repair process of the posterior longitudinal ligament tissue of the spine, which is the host that causes ossification in OPLL as well. In addition, gene expression analysis using scRNAseq data confirmed that the candidate genes discovered in this study were expressed not only in mesenchymal cells but also in immune cells.

We identified that OPLL was genetically correlated with other traits, positive for BMI and T2D and negative for cerebral aneurysms. High BMI (obesity) has been implicated in OPLL, and clinical studies have reported that the BMI of OPLL patients is significantly higher than that of non-patients (Endo et al., 2020; Kobashi et al., 2004). It is speculated that obesity promotes heterotopic bone formation in OPLL. Yamamoto et al. reported a high incidence of OPLL in the Zucker fatty rat, a model rat of obesity with a loss-of-function mutation in the leptin receptor gene (Yamamoto et al., 2004). However, basic studies with small animals have reported conflicting results regarding the effects of obesity on bone formation. In general, high-fat diet (HFD)-induced obesity is detrimental to bone formation and results in low bone density in mice (Zhang et al., 2022). On the other hand, Lv et al. reported that the mRNA level of Runx2 in bone marrow-derived mesenchymal stem cells from HFD mice was significantly higher; in contrast, that of Pparγ, which suppresses osteoblast differentiation and promotes osteoclast differentiation, was significantly lower than the control mice (Lv et al., 2010). Thus, the results of basic experiments are varied and controversial. While the effects of obesity on systemic bone formation and heterotopic ossification may not be the same, in clinical studies, meta-analyses examining the association between obesity and BMD in adults have reported that obesity affects the increase in bone density in all groups: postmenopausal women, premenopausal women, and men. In addition, MR analysis of the relationship between BMI and BMD reported that increased BMI was positively causally related to heel BMD (Ma et al., 2021; Song et al., 2020) and lumbar BMD (Song et al., 2020). Thus, while many results support the theory that obesity is related to OPLL formation, the mechanism by which obesity induces OPLL remains unclear. Our MR studies have demonstrated that a high BMI has a causal effect on OPLL. However, we could not prove the SNP-obesity interaction (Appendix 2). Further mechanistic studies on obesity and OPLL are necessary.

We found that the causal relationship between T2D and OPLL is slight by our MR analysis, despite the positive genetic correlation between OPLL and T2D. Many OPLL studies have focused on the relationship with T2D (Akune et al., 2001; Kobashi et al., 2004). Insulin acts on endogenous tyrosine kinase receptors and receptors for insulin-like growth factor-I, a potent anabolic factor in bone formation (Giustina et al., 2008; Locatelli and Bianchi, 2014). Therefore, it has been postulated that increased insulin production due to impaired insulin action may stimulate osteogenic cells in ligaments and cause OPLL (Akune et al., 2001). However, our results indicate that the impact of T2D on the development of OPLL is small. Therefore, most reasons for the high prevalence of T2D in OPLL patients reported so far can be attributed to the high prevalence of obesity in OPLL patients.

Our MR analysis also revealed the causality of high BMD in OPLL. This result is consistent with the clinical observation that OPLL patients have an increased tendency of ossification throughout the body and often have heterotopic ossification of other spinal ligaments, such as the anterior longitudinal ligament (Nishimura et al., 2018), interspinous ligament (Mori et al., 2016), and nuchal ligament (Yoshii et al., 2019), as well as extraspinal ossification lesions in the shoulder, hip, knee, and ankle joint (Hukuda et al., 1983). A gene set enrichment analysis identified significant enrichment in sets associated with BMD in children as well as adults. BMD is low at birth, increases gradually with age, peaks in the 20 s, and then slowly declines (Iglesias-Linares et al., 2016). Therefore, it is assumed that BMD in children reflects the degree of bone formation, although it is affected by various factors. Our results can support that OPLL is closely associated with bone formation. However, the relationship between cerebral aneurysms and OPLL has not been reported. Therefore, for evaluating the causality of cerebral aneurysms on OPLL, an MR analysis with more cerebral aneurysm-related SNPs as the instrumental variables is desirable. Such a study will be conducted in the future. In addition to these traits, additional analyses were performed for ankylosing spondylitis with ossifying lesions in the spine as well as OPLL. We evaluated the correlation between ankylosing spondylitis and OPLL but found no correlation in the limited data available (Appendix 3, Figure 1—figure supplement 17).

We demonstrated the differences in genetic characteristics of OPLL. We identified three significant loci for C-OPLL and nine significant loci for T-OPLL in the stratification analyses of the GWAS by OPLL subtypes. There was a considerable difference in the allele frequencies of lead variants in these loci between subtypes (Supplementary file 11). However, most of the alternative allele frequencies of these variants were small, and future confirmation by a study with a larger sample size is desirable. Furthermore, our MR and BMI PRS analyses showed that the effect of BMI on T-OPLL was much larger than that of C- and ALL-OPLL. The common disease study often shows clinically defined diseases based on common signs and symptoms are actually heterogeneous in the cause, such as hypertension and diabetes mellitus. Therefore, research focusing on disease subtypes is useful in characterizing the disease in detail and elucidating its specific causes, leading to more personalized treatment.

This study demonstrates that OPLL is a highly heritable disease. Although previous clinical studies have suggested that OPLL is heritable, there have been no studies that have mentioned the heritability of OPLL. This study is the first to clarify the high heritability of OPLL quantitatively. Further elucidation of the pathogenesis of OPLL from a genetic approach is expected.

Based on the results of this study, we expect to establish new non-surgical treatments. Although this study identified that OPLL is closely linked to bone metabolism, there are few studies examining the prognosis of OPLL with the use of bone-modifying agents such as bisphosphonates, which suppress both bone formation and resorption. A randomized controlled trial evaluated the effect of etidronate disodium on postoperative OPLL progression in patients with OPLL who had undergone posterior decompression surgery, but no significant effect was demonstrated (Yonenobu et al., 2006). Future studies are needed to determine whether existing agents are adequate or whether we need to develop new agents. Regarding obesity, the cause of OPLL, weight loss guidance, and aggressive bariatric treatment, including surgery, for some patients may be considered. Long-term prospective studies are needed to evaluate the effect of weight loss on OPLL suppression. In addition, this study suggests an involvement of the immune system in OPLL. Although most OPLL research to date has focused on bone metabolism, it is also essential to study the pathogenesis of OPLL from an immunological approach in the future to develop unprecedented therapies.

There are some limitations in this study. The first is the GWAS sample size. Although this study is the largest OPLL GWAS in the world and used samples collected from facilities throughout Japan, additional samples are needed to clarify the pathogenesis of OPLL further and better define subtype differences. In addition, OPLL GWAS in other ethnic groups has not been reported. We expect future international meta-analysis using data from non-Japanese ethnic groups to elucidate regional differences in the frequencies of OPLL. Second, gene expression data in spinal ligament tissue is scarce. Therefore, we were forced to use tissue data different from ligament tissue, such as GETx (Consortium, 2015), which did not include bone, cartilage, or ligamentous tissue, and data from a mouse Achilles tendon ossification model, which resembles spinal ligament ossification. We also used bulk data from spinal ligaments, but the sample sizes were limited. We focused on the genes closest to the GWAS signals, but some of these genes may not be the true causative genes because their expression was not confirmed or low in ligament tissues as far as we could ascertain from the limited data available. It is desirable to increase the number of spinal ligament tissue samples and perform expression analysis using scRNAseq. Additionally, we expect that functional data such as eQTL in ligament tissues or other responsible tissues will be available in the future. If so, genes other than those focused on in this study could be identified as causal genes. Another limitation is that the Japanese GWAS data used for genetic correlation analysis were limited to 96 traits, and other traits not analyzed for genetic correlation may be associated with OPLL. In addition, some of the data used for MR were not East Asian. While we cannot immediately improve upon the limitations listed above, we intend to strengthen these areas for future research for OPLL.

In conclusion, this study identified candidate genes in genomic loci associated with OPLL, and subsequent post-GWAS analyses showed a causal relationship between other traits and OPLL: obesity and high BMD. This study will serve as a basis for future research to elucidate the pathogenesis of OPLL in more detail and to develop new treatment methods.

Materials and methods

Subjects

All the subjects analyzed in this study were Japanese. OPLL samples were collected from facilities throughout Japan. The GWAS data of this study consisted of three sets: GWAS set-1, -2, and -3. The case samples of set-1 and -2 were used as discovery and replication samples, respectively, in the previous GWAS (Nakajima et al., 2014). In these data sets, the cases had OPLL of more than or equal to two vertebrae. For the case of set-3, we recruited patients with OPLL in more than or equal to five vertebras or OPLL thicker than 5 mm in the thoracic spine in 2018–2019. When assessing the presence or absence of OPLL, expert spine surgeons in each institution examined patients’ plain radiography or computed tomography (CT) in detail (Figure 1—figure supplement 1).

Regarding control data, we used genotyping data from BioBank Japan (BBJ) (Hirata et al., 2017; Nagai et al., 2017) in set-1 and -2, and those from the Medical Genome Center (MGC) Biobank database of the National Center for Geriatrics and Gerontology (NCGG) in set-3. Details of the characteristics of the subjects are shown in Supplementary file 1.

This study followed the Strengthening the Reporting of Genetic Association Studies (STREGA) reporting guideline (Little et al., 2009).

Study approval

Request a detailed protocol

All participating individuals provided written informed consent to participate in this study following approval by ethical committees at RIKEN Centers for Integrative Medical Sciences (approval ID: 17-16-39), Hokkaido University (approval ID: 16-059), and all other participating institutes.

Genotyping and quality control

Request a detailed protocol

Genomic DNA was extracted from peripheral venous blood samples using a standard method. We genotyped case and control samples using the Illumina OmniExpressExome BeadChip, a combination of Illumina OmniExpress BeadChip and Illumina HumanExome BeadChip, or Illumina Asian Screening Array (Supplementary file 1).

For quality control of genotyped SNPs, we excluded those with (i) SNP call rate < 99%, (ii) MAF < 0.01, and (iii) Hardy–Weinberg equilibrium p-value<1.00 × 10⁻⁶. We constructed a reference panel to obtain imputed genotypes with high accuracy using the 1000 Genomes Project Phase 3 (1KGP 3 [May 2013 n=2504]) and 3256 in-house Japanese whole-genome sequence data obtained from BBJ (JEWEL 3K) in the same way as previously reported (Akiyama et al., 2019). SNPs with allele frequency differences greater than 0.06 between the genotyped control data and the 1KGP3 East Asian and JEWEL 3K data in reference panel were excluded.

For sample quality control, we excluded samples whose sex differed between genotype and clinical data. We evaluated cryptic relatedness by calculating estimates of pairwise IBD (PI_HAT) and removed samples that showed second-degree relatedness or closer (PI_HAT > 0.25). Population stratification was estimated using principal component analysis (PCA) with four populations from HapMap data as the reference: European (CEU), African (YRI), Japanese (JPT), and Han Chinese (CHB) with SmartPCA (Patterson et al., 2006). We generated a scatterplot using the top two associated principal components (eigenvectors) and selected samples within the East Asian (JPT/CHB) cluster. We excluded samples with a genotyping call rate of <98% (Figure 1—figure supplement 1).

Phasing and genotype imputation

Request a detailed protocol

We performed pre-phasing with EAGLE (v2.4.1) (Loh et al., 2016) and SNP imputation with minimac4 (v1.0.0) (Das et al., 2016) using the reference panel mentioned above. After imputation, we used SNPs with an imputation quality of Rsq > 0.3 and MAF > 0.005 for the subsequent association study.

GWAS and meta-analysis

Request a detailed protocol

We performed an association analysis of autosomes of GWAS set-1, -2, and -3 independently. We performed a logistic regression analysis using PLINK2.0 (Purcell et al., 2007) with the top 10 principal components (PCs) as covariates assuming an additive model, and evaluated the association of each imputed SNP. We then meta-analyzed the three GWAS sets with an inverse variance method under a fixed effect model using METAL software (Willer et al., 2010). Regarding X chromosomes, we performed a logistic regression analysis in males and females separately for each GWAS set using PLINK2.0, with the top 10 PCs as covariates assuming an additive model. We then integrated the results of males and females in each GWAS using an inverse variance method under a fixed-effect model (Figure 1—figure supplement 1).

We estimated confounding biases derived from population stratification and cryptic relatedness using LD score regression using LD scores for the East Asian population (Bulik-Sullivan et al., 2015).

Conditional association analysis

Request a detailed protocol

We used the distance-based approach to determine significant loci. We defined the SNP with the lowest p-value within each locus as the lead SNP. We defined an associated locus of a lead SNP as 1 Mb of its surrounding sequences in both directions. We extended the region to nearby significant variants and their 1 Mb surrounding sequences as far as a significant variant was contained in the defined region. In addition, we margined 1 Mb from significant variants at both ends. We performed a stepwise conditional meta-analysis to determine the independent association signals in the associated loci. We conducted conditional analyses of GWAS set 1–3 separately and integrated the results using a fixed-effects model with the inverse variance method. We repeated this process until the top associated variants fell below the locus-wide significance level (p<5.0 × 10⁻⁶) in each stepwise procedure. As a result of this analysis, we identified two additional loci associated with OPLL (lead SNPs: rs35281060 and rs1038666). We determined the boundaries of these regions based on the estimated recombination rates from hg19/1000 Genomes Nov 2014 East Asian (Table 1). We confirmed that there are no SNPs outside each locus in LD (r2 > 0.1) with SNPs that met genome-wide significance levels within the locus.

We calculated LD with the lead SNPs using whole-genome sequence data of 1KGP3 East Asian and JEWEL 3K by PLINK2.0 and produced regional association plots using Locuszoom (Pruim et al., 2010).

Statistical power analysis

Request a detailed protocol

We evaluated the statistical power of GWAS meta-analysis for ALL-OPLL using the genpwr package for R (Moore et al., 2019). We set the model to an additive model, with the type 1 error rate and statistical power set to 5 × 10⁻⁸ and 0.8 or 0.5, respectively.

Annotation

Request a detailed protocol

We used ANNOVAR (Wang et al., 2010) and defined a gene with a lead SNP or, if not, a gene in the nearest vicinity of a lead SNP as a candidate gene for the region because of previous reports that the majority of noncording variants act on the closest gene (Fulco et al., 2019; Nasser et al., 2021).

To identify candidate causal variants in the eight novel loci, we annotated the SNPs that exceeded the threshold of significance (p<5.0 × 10⁻⁸) and were in high LD (r2 > 0.8) with lead variants newly identified in the GWAS meta-analysis. We explored the biological role of these variants using SNP annotation tools, including HaploReg (Ward and Kellis, 2012), RegulomeDB (Boyle et al., 2012), and ANNOVAR (Wang et al., 2010).

Subtype-stratified GWAS and meta-analysis

Request a detailed protocol

We performed subtype-stratified GWASs and meta-analyses for C-OPLL and T-OPLL in the same way as the analysis with all samples from set to 1–3 (ALL-OPLL). Cases in GWAS set-3 were all T-OPLL samples; therefore, we carefully re-examined patients’ plain radiography or CT in set-1 and -2, where we defined C-OPLL case samples as those with OPLL limited to the cervical spine and defined T-OPLL as OPLL affecting more than two vertebrae in the thoracic spine (Figure 1—figure supplement 1). The detailed sample numbers are listed in Supplementary file 1.

Estimation of phenotypic variance

Request a detailed protocol

We estimated the heritability of OPLL using LDSC software (Bulik-Sullivan et al., 2015). The variance explained by the variants was calculated based on a liability threshold model assuming the prevalence of OPLL to be 3.0% (Matsunaga and Sakou, 2012). Furthermore, the model assumed that subjects had a continuous risk score and that subjects whose scores exceeded a certain threshold developed OPLL.

Bayesian statistical fine-mapping analysis

Request a detailed protocol

To prioritize causal variants in OPLL susceptibility loci, we conducted a fine-mapping analysis using FINEMAP v1.3 software (Benner et al., 2016), using z-scores of GWAS meta-analysis for ALL-OPLL and LD matrices calculated by 1KGP3 EAS and JEWEL 3K data. We assumed one causal signal in the ±1 Mb region from both ends of significant variants at each significant locus. However, for 12p11 and 12p12, in which we identified significant secondary signals by a conditional analysis, we defined the range of the region referring to regional association plots (Figure 1—figure supplement 3). We calculated a PP in which each genetic variant was the true causal variant. Then, we ranked the candidate causal variants in descending order of their PPs and created a 95% credible set of causal variants by adding the PPs of the ordered variants until their cumulative PP reached 0.95.

Gene set enrichment analysis

Request a detailed protocol

FUMA is a web-based platform in which we can perform GWAS-related analyses such as gene-based analysis and gene set enrichment analysis (Watanabe et al., 2017). We conducted a gene set enrichment analysis using FUMA. Because variants often act on genes that are close in the distance (Fulco et al., 2019; Nasser et al., 2021), we selected genes on a distance basis using the following criteria and used them as input data: genes (i) located within 1 Mb and (ii) the five closest to the leading SNPs of each genome-wide significant locus.

Gene-based association analysis

Request a detailed protocol

To examine the combined effect of SNPs, we conducted gene-based association analysis using MAGMA (de Leeuw et al., 2015) implemented in FUMA (Watanabe et al., 2017). MAGMA uses input GWAS summary statistics to compute gene-based p-values. For this analysis, the gene-based p-value is computed for protein-coding genes by mapping SNPs to genes if SNPs are located within the genes. We set the gene window 2 kb upstream and 1 kb downstream from the genes to include regulatory elements and analyzed 19,933 genes. We used the default settings and LD information from East Asian ancestry subjects from 1KGP3 as a reference. We set the p-value threshold for the test to 5.0 × 10⁻⁸ (not a gene-wide threshold).

eQTL analysis

Request a detailed protocol

We obtained transcript data from the Genotype-Tissue Expression (GTEx) v8 (Consortium, 2015). We examined eQTL data in all available tissues in GTEx to determine the association between gene expression and the leading SNPs within the genome-wide significant locus. We set the significance threshold for eQTL as an FDR < 0.05.

SMR

Request a detailed protocol

SMR is used to determine associations between genetically determined traits, such as gene expression and protein abundance, and a complex trait of interest, such as OPLL. This analysis is designed to test whether the effect size of an SNP on the phenotype is mediated by gene expression. We used SMR software (Zhu et al., 2016). We used OPLL summary statistics data and eQTL data obtained from GTEx v7 (Consortium, 2015), which is the same build as in this study (GRCh37). We evaluated heterogeneity in dependent instruments (HEIDI) using multiple SNPs in a cis-eQTL region to distinguish pleiotropy from the linkage. As previously reported, we set the threshold for the HEIDI test to 0.05 and the threshold for SMR to 8.4 × 10⁻⁶ (Zhu et al., 2016).

Partitioning heritability enrichment analysis

Request a detailed protocol

We performed stratified LD score regression using 220 cell-type-specific annotations of four histone marks (H3K4me1, H3K4me3, H3K9ac, and H3K27ac) (Roadmap Epigenomics Consortium et al., 2015). We divided the 220 cell-type-specific annotations into 10 cell-type groups (10 in adrenal/pancreas, 34 in central nervous system, 15 in cardiovascular, 6 in connective/bone, 44 in gastrointestinal, 67 in immune/hematopoietic, 5 in kidney, 6 in liver, 10 in skeletal muscle, and 23 in other). We assessed heritability enrichment in histone marks of 220 individual cell types and ten cell type groups, as described by Finucane et al., 2015. The regression analysis excluded variants within the major histocompatibility complex (MHC) region (chromosome 6: 25–34 Mb). We defined significant heritability enrichment as those with an FDR < 0.05.

Confirmation of gene expression in ligament tissue

Request a detailed protocol

We examined the gene expression in the tissue. We used the deposited RNA-seq data in spinal ligament (yellow ligament) in patients with OPLL and cervical CSM (GSE126060) and human ligament cells after chondrogenic differentiation and control (GSE188759) (Tachibana et al., 2022). The presence or absence of gene expression was confirmed by the transcripts per kilobase million (TPM) values in each tissue and cell in both data, followed by a comparison of the expression levels in the two groups by a t-test using R software.

scRNAseq data processing

Request a detailed protocol

We used available deposited data from two studies using Achilles tendon cells from an ossification model of the mouse Achilles tendon to investigate the expression levels of candidate causal genes in our study: burn/tenotomy heterotopic ossification model (GSE126060) (Sorkin et al., 2020) and Achilles tendon puncture model (GSE188758) (Tachibana et al., 2022). These data had already been processed into MTX format, and we conducted subsequent data analyses using the R package Seurat (Hao et al., 2021).

Regarding GSE126060 (Sorkin et al., 2020), we used data from day 0 and day 7 of the replicate 1–4 samples from the deposited data. First, we filtered out cells with less than 1000 genes per cell and a mitochondrial read content greater than 5%. After normalization using the NormalizeData function and identifying the independently variable 2000 features in each data set, we selected repeatedly variable features across data sets for data integration with the SelectIntegrationFeatures function. We selected anchors using the FindIntegrationAnchors function and used them to integrate the data sets using the IntegrateData function with the default parameter. Next, we scaled this integrated data using the ScaleData function and ran PCA. We then conducted dimensionality reduction with UMAP using the top 20 PCs. After computing k for the k-nearest neighbor algorithm using the top 20 PCs with the FindNeighbors function, we conducted the clustering with the FindClusters function. Next, we annotated the clusters based on the expression of marker genes in the cells comprising the ossified ligament: mesenchymal cell (Pdgfra, Prrx1, Clec3b, and Dpt), dendritic cell (Cd209a and Flt3), endothelial cell (Emcn, Pecam1, and Sox18), lymphocyte (Ccr7, Ms4a4b, and Ms4a1), neuromuscular (Pax7 and Ncam1), pericyte/smooth muscle (Abcc9, Rgs5, Acta2, Pdgfrb, and Des), macrophage (Lyz2, Cd14, and Cd68), and nerve (Sox10, Plp1, Mbp, and Mpz) (Tachibana et al., 2022). Finally, we investigated the expression levels of candidate genes found in GWAS meta-analyses, gene-based association analysis, and SMR in each cluster.

In addition, we also conducted an analysis using the data from GSE188758 (Tachibana et al., 2022). Since this is a single data set from five mice, we did not conduct data integration. Other than that, we processed the data in the same manner described above and performed clustering and sub-clustering on this data to evaluate the expression of the candidate genes found in our study.

Genetic correlation

Request a detailed protocol

We estimated the genetic correlations using a bivariate LD score regression (Bulik-Sullivan et al., 2015) using recently published GWAS results for Japanese: 96 complex traits (Akiyama et al., 2019; Akiyama et al., 2017; Ishigaki et al., 2020; Kanai et al., 2018; see Supplementary file 13 for the traits analyzed). In these reports, GWASs were conducted for 42 diseases (Ishigaki et al., 2020), 58 quantitative traits (Kanai et al., 2018), BMI (Akiyama et al., 2017), and height (Akiyama et al., 2019) (total of 102 traits). We could not calculate the following six traits for genetic correlation with OPLL due to the small sample size: biliary tract cancer, endometriosis, hematological malignancy, interstitial lung disease, periodontal disease, and E/A ratio.

We excluded variants found in the MHC region from the analysis because of their complex LD structure. We set the significance threshold for genetic correlations as FDR < 0.05. We evaluated the genetic correlation only for ALL-OPLL because the sample sizes of the C- and T-OPLL groups were too small for this analysis.

MR

Request a detailed protocol

We applied two-sample MR methods that handle summary statistics from separate studies to evaluate the causality of BMI, T2D, cerebral aneurysm, and BMD on OPLL using the R package ‘TwoSampleMR’ (Hemani et al., 2018). Regarding BMI, we reconstructed trans-ancestral meta-analysis data using Japanese and European GWAS results in the same way as previously reported (Akiyama et al., 2017; Locke et al., 2015). Regarding T2D, cerebral aneurysm, and BMD, we used publicly available results of East Asian meta-analysis of GWASs for T2D (Spracklen et al., 2020), mainly European meta-analysis of GWAS for cerebral aneurysm (Bakker et al., 2020), and European GWAS for BMD (Kemp et al., 2017). In the SNP selection, we extracted the lead SNPs for each study as the instrumental variables. When the lead SNP was not present in the GWAS meta-analysis for OPLL, we selected proxy SNPs highly correlated with the original variants (r2 > 0.8). If there were no proxy SNPs that met the criteria, we excluded the SNPs from the analysis. The details of the instrument variables in each MR are shown in Figure 4—figure supplement 1 and Supplementary file 14.

We conducted additional MR methods in addition to the conventional IVW method for sensitivity analyses: the MR-Egger method (Bowden et al., 2015; Burgess and Thompson, 2017) and the simple and weighted median methods (Bowden et al., 2016). In addition, we conducted subtype-stratified analyses using summary statistics from C- and T-OPLL GWAS and examined the differences between OPLL subtypes. The number of SNPs used in each analysis is listed in Supplementary file 14. We also assessed the potential bias in the results of MR with leave-one-out analysis and funnel plots.

We performed reverse-direction MR using the lead SNPs in the significant locus in the meta-analysis for ALL-OPLL as instrumental variables. Parts of these OPLL-associated SNPs were not present within the BMI and cerebral aneurysm data sets, although all were contained in the dataset of T2D and BMD. Therefore, in the analyses for BMI and cerebral aneurysm, we substituted them with the proxy SNP in the same way described above (Figure 4—figure supplement 1).

A participant overlap between the samples used to estimate genetic associations with the exposure and the outcome in two-sample MR can bias results (Burgess et al., 2016). Therefore, using exposure and outcome instrument variables estimated in non-overlapping samples is preferable. We checked the cohort data used in our MR and found no overlap with the OPLL case sample, although the control samples used in the OPLL study overlapped with up to 2.2% of samples used in the BMI study and 3.4% in the T2D study. According to a simulation study of the association between sample overlap and the degree of bias in instrumental variable analysis, an unbiased estimate is obtained if the overlapping sample includes only control samples for the binary outcome (Burgess et al., 2016).

Additional MR for obesity-related traits

Request a detailed protocol

Based on the MR results for the above four traits, we used BMI data only for Japanese (Akiyama et al., 2017). We conducted MR to evaluate the causal effect of BMI on OPLL in the same way as above as a sensitivity analysis.

In addition, we conducted MR for obesity-related traits in the same manner as described above. We used the data from the large GWAS meta-analyses for obesity-related traits from UKBB and Giant Consortium: BMI, WHR, and WHRadjBMI (Pulit et al., 2019).

Comparison of the effect sizes of the SNPs between the GWAS meta-analyses for OPLL and BMI

Request a detailed protocol

After pruning the SNPs, we evaluated the correlations of the effect sizes of the SNPs between the GWAS meta-analyses for OPLL (ALL-, C-, and T-OPLL) and the GWAS for BMI for sets of SNPs stratified by the thresholds based on the GWAS p-values for each trait. We used the results of the GWAS meta-analysis of OPLL and the Japanese GWAS of BMI (Akiyama et al., 2017) for this analysis. First, we extracted SNPs with MAF ≥ 0.01, shared between the meta-analyses for OPLL and BMI. Next, we conducted LD pruning of the SNPs for the SNP pairs in LD (r2 ≥ 0.5) using 1KGP3 East Asian and JEWEL 3K data by PLINK. Finally, we used 367,672 SNPs in subsequent analyses. We calculated the correlation of the effect sizes of the SNPs between the GWAS meta-analyses for OPLL and BMI GWAS for sets of SNPs stratified by the thresholds based on the GWAS p-values in each trait using R software.

Generation of PRS of BMI and its application to OPLL GWAS samples

Request a detailed protocol

We used PRS to investigate the genetic impact of BMI on OPLL. We constructed the PRS of BMI using a pruning and thresholding method (Khera et al., 2018; Figure 5—figure supplement 1). In the discovery phase, we generated PRS as the sum of risk alleles weighted by the log odds ratio of association estimated in the Japanese GWAS for BMI (Akiyama et al., 2017). We pruned SNPs based on nine different LD thresholds r2 = 0.1–0.9 in a 250 kb window using PLINK2.0 and constructed 20 PRS using independent SNPs at p-value thresholds of 5.0 × 10⁻⁸ ~ 1 for each LD threshold. In the validation phase, we determined the best pruning parameter with another Japanese dataset in which genotyping was conducted using the Illumina OmniExpressExome chip. We conducted data quality control in the same manner as in the OPLL GWAS. We used the calculated BMI PRS after standardization (mean = 0, standard deviation = 1). In the test phase, we calculated the Spearman’s rho score between BMI and PRS to assess the fit of the models and determined r2 = 0.9 and p-value = 0.6 as the best parameter. We applied BMI PRS for cases and controls in the present OPLL GWAS study.

We measured the association between BMI PRS and OPLL using logistic regression with principal components 1–10 as covariates for each OPLL dataset. Then, we meta-analyzed the effect sizes of BMI PRS in the three OPLL data sets using the inverse variance method under a fixed-effect model. We conducted this analysis for ALL-OPLL, C-, and T-OPLL. Furthermore, we applied BMI PRS for C- and T-OPLL cases and compared the effect of OPLL PRS on OPLL subtypes using logistic regression with principal components 1–10 as covariates.

To compare the effect size of BMI PRS in OPLL with T2D, for which BMI is known to be one of the major causes, we performed the same BMI PRS scoring on the T2D data set (39,758 cases and 111,487 controls). Unfortunately, the T2D data set overlaps almost entirely with the data from the discovery phase of the BMI PRS, which carries a high risk of statistical inflation due to model overfitting. However, since no other data was available for T2D, the comparison was made in this manner, knowing the above points.

Replication analysis for study validation

Request a detailed protocol

For replication cases, we extracted DNA from the peripheral blood of 230 OPLL patients, independent of the cases used in the GWAS meta-analysis described above. We genotyped them using Illumina Asian Screening Array. All case samples used here were of the T-OPLL subtype. For replication controls, we used genotyping data for 1889 Japanese individuals from the BBJ project genotyped with Illumina Asian Screening Array. Sample and SNP QC, phasing, and imputation were performed similarly to the GWAS meta-analysis described above. Finally, we conducted a logistic regression analysis using 212 case and 1866 control samples with the top 10 PCs as covariates to confirm the effect size of the lead SNP in each region in the GWAS meta-analysis. To validate the results of our GWAS meta-analysis, we performed a binomial test to assess the concordance in the direction of the betas in the original GWAS meta-analysis and the association analysis with the replication data.

In addition, for the SNPs used as instrumental variables in MR, we updated the SNP statistics by adding replication data to the data in sets 1–3 using meta-analysis with the inverse variance method under a fixed-effect model. Using these updated SNP statistics, we re-conducted MR and evaluated the changes in the results.

Appendix 1

SNP–obesity interaction

We evaluated the SNP–obesity interaction during the development of OPLL. We first calculated the best-guess genotypes for lead SNPs in 14 significant loci of the OPLL GWAS meta-analysis (ALL-OPLL) using PLINK. We then scored each individual based on the best-guess genotypes of each of the 14 SNPs: risk allele/risk allele = 2, risk allele/non-risk allele = 1, non-risk allele/non-risk allele = 0. Furthermore, we scored each individual according to the WHO classification of obesity: BMI < 18.5 (underweight) scored 0; 18.5 ≤ BMI < 25.0 (normal range) scored 1; 25.0 ≤ BMI < 30.0 (overweight) scored 2; 30.0 ≤ BMI < 35.0 (obese class 1) scored 3; 35.0 ≤ BMI < 40.0 (obese class 2) scored 4; and 40.0 ≤ BMI (Obese class 3) scored 5 (World Health Organization, 2000). We measured the association between the interaction term (SNP*obesity score) and OPLL using logistic regression with principal components 1–10 obtained by principal component analysis with SmartPCA (Patterson et al., 2006) as covariates.

We found no significant association between the development of OPLL and SNP-obesity interaction.

Appendix 2

Comparison of SNP effect sizes between OPLL and ankylosing spondylitis GWASs

Ankylosing spondylitis (AS) is a chronic immune-mediated arthritis characterized by ossified lesions of the spine known as bamboo spine. Although AS is considered a fundamentally different disease from OPLL, some authors reported that some AS patients also had OPLL: 3.5% of Koreans and 15.5% of Mexicans (Kim et al., 2007; Ramos-Remus et al., 1998).

We used the results of the largest GWAS for AS, which was a study on Europeans (Ellinghaus et al., 2016). We compared effect sizes between OPLL and AS GWASs for AS-associated SNPs and found no correlation (Figure 1—figure supplement 17). We could not make the same comparison for OPLL-associated SNPs because AS GWAS summary statistics were unavailable.

Data availability

Full GWAS results will be available after acceptance via the website of the Japanese ENcyclopedia of GEnetic associations by Riken (JENGER, http://jenger.riken.jp/en/).

The following data sets were generated
The following previously published data sets were used
    1. Ishigaki et al
    (2020) Japanese ENcyclopedia of GEnetic associations by Riken
    ID ID 28-104. Case-control GWAS IDs 28-104 (non sex-stratified data).
    1. Bakker MK
    2. Veldink J
    3. Ruigrok Y
    (2020) figshare
    Intracranial aneurysm genome-wide association study summary statistics 2020.
    https://doi.org/10.6084/m9.figshare.11303372
    1. Kemp et al
    (2017) GEnetic Factors for OSteoporosis Consortium
    ID ukbb-ebmd-gwas-data-release-2017. UKBB eBMD GWAS Data Release 2017.
    1. Locke et al
    (2015) GIANT consortium
    ID GIANT_consortium_data_files#GWAS_Anthropometric_2015_BMI_Summary_Statistics. GWAS Anthropometric 2015 BMI Summary Statistics.
    1. Pulit SL
    (2018) Zenodo
    Summary-level data from meta-analysis of fat distribution phenotypes in UK Biobank and GIANT (Meta-analysis of bmi).
    https://doi.org/10.5281/zenodo.1251813
    1. Menon R
    2. Levi B
    3. Huber A
    4. Sorkin M
    5. Marini S
    (2019) NCBI Gene Expression Omnibus
    ID GSE126060. Role of myeloid cells in heterotopic ossification (HO) in a burn and incision-induced mouse model.
    1. Tachibana N
    2. Saito T
    (2022) NCBI Gene Expression Omnibus
    ID GSE188758. scRNA-seq of Achilles tendons from Prg4-CreERT2;R26-tdTomato ATP mice.
    1. Tachibana N
    2. Saito T
    (2022) NCBI Gene Expression Omnibus
    ID GSE188759. RNA-seq in chondrocyte differentiation of human spinal ligament cells.

References

    1. Kim TJ
    2. Kim TH
    3. Jun JB
    4. Joo KB
    5. Uhm WS
    (2007)
    Prevalence of ossification of posterior longitudinal ligament in patients with Ankylosing Spondylitis
    The Journal of Rheumatology 34:2460–2462.
    1. Locke AE
    2. Kahali B
    3. Berndt SI
    4. Justice AE
    5. Pers TH
    6. Day FR
    7. Powell C
    8. Vedantam S
    9. Buchkovich ML
    10. Yang J
    11. Croteau-Chonka DC
    12. Esko T
    13. Fall T
    14. Ferreira T
    15. Gustafsson S
    16. Kutalik Z
    17. Luan J
    18. Mägi R
    19. Randall JC
    20. Winkler TW
    21. Wood AR
    22. Workalemahu T
    23. Faul JD
    24. Smith JA
    25. Zhao JH
    26. Zhao W
    27. Chen J
    28. Fehrmann R
    29. Hedman ÅK
    30. Karjalainen J
    31. Schmidt EM
    32. Absher D
    33. Amin N
    34. Anderson D
    35. Beekman M
    36. Bolton JL
    37. Bragg-Gresham JL
    38. Buyske S
    39. Demirkan A
    40. Deng G
    41. Ehret GB
    42. Feenstra B
    43. Feitosa MF
    44. Fischer K
    45. Goel A
    46. Gong J
    47. Jackson AU
    48. Kanoni S
    49. Kleber ME
    50. Kristiansson K
    51. Lim U
    52. Lotay V
    53. Mangino M
    54. Leach IM
    55. Medina-Gomez C
    56. Medland SE
    57. Nalls MA
    58. Palmer CD
    59. Pasko D
    60. Pechlivanis S
    61. Peters MJ
    62. Prokopenko I
    63. Shungin D
    64. Stančáková A
    65. Strawbridge RJ
    66. Sung YJ
    67. Tanaka T
    68. Teumer A
    69. Trompet S
    70. van der Laan SW
    71. van Setten J
    72. Van Vliet-Ostaptchouk JV
    73. Wang Z
    74. Yengo L
    75. Zhang W
    76. Isaacs A
    77. Albrecht E
    78. Ärnlöv J
    79. Arscott GM
    80. Attwood AP
    81. Bandinelli S
    82. Barrett A
    83. Bas IN
    84. Bellis C
    85. Bennett AJ
    86. Berne C
    87. Blagieva R
    88. Blüher M
    89. Böhringer S
    90. Bonnycastle LL
    91. Böttcher Y
    92. Boyd HA
    93. Bruinenberg M
    94. Caspersen IH
    95. Chen Y-DI
    96. Clarke R
    97. Daw EW
    98. de Craen AJM
    99. Delgado G
    100. Dimitriou M
    101. Doney ASF
    102. Eklund N
    103. Estrada K
    104. Eury E
    105. Folkersen L
    106. Fraser RM
    107. Garcia ME
    108. Geller F
    109. Giedraitis V
    110. Gigante B
    111. Go AS
    112. Golay A
    113. Goodall AH
    114. Gordon SD
    115. Gorski M
    116. Grabe H-J
    117. Grallert H
    118. Grammer TB
    119. Gräßler J
    120. Grönberg H
    121. Groves CJ
    122. Gusto G
    123. Haessler J
    124. Hall P
    125. Haller T
    126. Hallmans G
    127. Hartman CA
    128. Hassinen M
    129. Hayward C
    130. Heard-Costa NL
    131. Helmer Q
    132. Hengstenberg C
    133. Holmen O
    134. Hottenga J-J
    135. James AL
    136. Jeff JM
    137. Johansson Å
    138. Jolley J
    139. Juliusdottir T
    140. Kinnunen L
    141. Koenig W
    142. Koskenvuo M
    143. Kratzer W
    144. Laitinen J
    145. Lamina C
    146. Leander K
    147. Lee NR
    148. Lichtner P
    149. Lind L
    150. Lindström J
    151. Lo KS
    152. Lobbens S
    153. Lorbeer R
    154. Lu Y
    155. Mach F
    156. Magnusson PKE
    157. Mahajan A
    158. McArdle WL
    159. McLachlan S
    160. Menni C
    161. Merger S
    162. Mihailov E
    163. Milani L
    164. Moayyeri A
    165. Monda KL
    166. Morken MA
    167. Mulas A
    168. Müller G
    169. Müller-Nurasyid M
    170. Musk AW
    171. Nagaraja R
    172. Nöthen MM
    173. Nolte IM
    174. Pilz S
    175. Rayner NW
    176. Renstrom F
    177. Rettig R
    178. Ried JS
    179. Ripke S
    180. Robertson NR
    181. Rose LM
    182. Sanna S
    183. Scharnagl H
    184. Scholtens S
    185. Schumacher FR
    186. Scott WR
    187. Seufferlein T
    188. Shi J
    189. Smith AV
    190. Smolonska J
    191. Stanton AV
    192. Steinthorsdottir V
    193. Stirrups K
    194. Stringham HM
    195. Sundström J
    196. Swertz MA
    197. Swift AJ
    198. Syvänen A-C
    199. Tan S-T
    200. Tayo BO
    201. Thorand B
    202. Thorleifsson G
    203. Tyrer JP
    204. Uh H-W
    205. Vandenput L
    206. Verhulst FC
    207. Vermeulen SH
    208. Verweij N
    209. Vonk JM
    210. Waite LL
    211. Warren HR
    212. Waterworth D
    213. Weedon MN
    214. Wilkens LR
    215. Willenborg C
    216. Wilsgaard T
    217. Wojczynski MK
    218. Wong A
    219. Wright AF
    220. Zhang Q
    221. Brennan EP
    222. Choi M
    223. Dastani Z
    224. Drong AW
    225. Eriksson P
    226. Franco-Cereceda A
    227. Gådin JR
    228. Gharavi AG
    229. Goddard ME
    230. Handsaker RE
    231. Huang J
    232. Karpe F
    233. Kathiresan S
    234. Keildson S
    235. Kiryluk K
    236. Kubo M
    237. Lee J-Y
    238. Liang L
    239. Lifton RP
    240. Ma B
    241. McCarroll SA
    242. McKnight AJ
    243. Min JL
    244. Moffatt MF
    245. Montgomery GW
    246. Murabito JM
    247. Nicholson G
    248. Nyholt DR
    249. Okada Y
    250. Perry JRB
    251. Dorajoo R
    252. Reinmaa E
    253. Salem RM
    254. Sandholm N
    255. Scott RA
    256. Stolk L
    257. Takahashi A
    258. Tanaka T
    259. van ’t Hooft FM
    260. Vinkhuyzen AAE
    261. Westra H-J
    262. Zheng W
    263. Zondervan KT
    264. Heath AC
    265. Arveiler D
    266. Bakker SJL
    267. Beilby J
    268. Bergman RN
    269. Blangero J
    270. Bovet P
    271. Campbell H
    272. Caulfield MJ
    273. Cesana G
    274. Chakravarti A
    275. Chasman DI
    276. Chines PS
    277. Collins FS
    278. Crawford DC
    279. Cupples LA
    280. Cusi D
    281. Danesh J
    282. de Faire U
    283. den Ruijter HM
    284. Dominiczak AF
    285. Erbel R
    286. Erdmann J
    287. Eriksson JG
    288. Farrall M
    289. Felix SB
    290. Ferrannini E
    291. Ferrières J
    292. Ford I
    293. Forouhi NG
    294. Forrester T
    295. Franco OH
    296. Gansevoort RT
    297. Gejman PV
    298. Gieger C
    299. Gottesman O
    300. Gudnason V
    301. Gyllensten U
    302. Hall AS
    303. Harris TB
    304. Hattersley AT
    305. Hicks AA
    306. Hindorff LA
    307. Hingorani AD
    308. Hofman A
    309. Homuth G
    310. Hovingh GK
    311. Humphries SE
    312. Hunt SC
    313. Hyppönen E
    314. Illig T
    315. Jacobs KB
    316. Jarvelin M-R
    317. Jöckel K-H
    318. Johansen B
    319. Jousilahti P
    320. Jukema JW
    321. Jula AM
    322. Kaprio J
    323. Kastelein JJP
    324. Keinanen-Kiukaanniemi SM
    325. Kiemeney LA
    326. Knekt P
    327. Kooner JS
    328. Kooperberg C
    329. Kovacs P
    330. Kraja AT
    331. Kumari M
    332. Kuusisto J
    333. Lakka TA
    334. Langenberg C
    335. Marchand LL
    336. Lehtimäki T
    337. Lyssenko V
    338. Männistö S
    339. Marette A
    340. Matise TC
    341. McKenzie CA
    342. McKnight B
    343. Moll FL
    344. Morris AD
    345. Morris AP
    346. Murray JC
    347. Nelis M
    348. Ohlsson C
    349. Oldehinkel AJ
    350. Ong KK
    351. Madden PAF
    352. Pasterkamp G
    353. Peden JF
    354. Peters A
    355. Postma DS
    356. Pramstaller PP
    357. Price JF
    358. Qi L
    359. Raitakari OT
    360. Rankinen T
    361. Rao DC
    362. Rice TK
    363. Ridker PM
    364. Rioux JD
    365. Ritchie MD
    366. Rudan I
    367. Salomaa V
    368. Samani NJ
    369. Saramies J
    370. Sarzynski MA
    371. Schunkert H
    372. Schwarz PEH
    373. Sever P
    374. Shuldiner AR
    375. Sinisalo J
    376. Stolk RP
    377. Strauch K
    378. Tönjes A
    379. Trégouët D-A
    380. Tremblay A
    381. Tremoli E
    382. Virtamo J
    383. Vohl M-C
    384. Völker U
    385. Waeber G
    386. Willemsen G
    387. Witteman JC
    388. Zillikens MC
    389. Adair LS
    390. Amouyel P
    391. Asselbergs FW
    392. Assimes TL
    393. Bochud M
    394. Boehm BO
    395. Boerwinkle E
    396. Bornstein SR
    397. Bottinger EP
    398. Bouchard C
    399. Cauchi S
    400. Chambers JC
    401. Chanock SJ
    402. Cooper RS
    403. de Bakker PIW
    404. Dedoussis G
    405. Ferrucci L
    406. Franks PW
    407. Froguel P
    408. Groop LC
    409. Haiman CA
    410. Hamsten A
    411. Hui J
    412. Hunter DJ
    413. Hveem K
    414. Kaplan RC
    415. Kivimaki M
    416. Kuh D
    417. Laakso M
    418. Liu Y
    419. Martin NG
    420. März W
    421. Melbye M
    422. Metspalu A
    423. Moebus S
    424. Munroe PB
    425. Njølstad I
    426. Oostra BA
    427. Palmer CNA
    428. Pedersen NL
    429. Perola M
    430. Pérusse L
    431. Peters U
    432. Power C
    433. Quertermous T
    434. Rauramaa R
    435. Rivadeneira F
    436. Saaristo TE
    437. Saleheen D
    438. Sattar N
    439. Schadt EE
    440. Schlessinger D
    441. Slagboom PE
    442. Snieder H
    443. Spector TD
    444. Thorsteinsdottir U
    445. Stumvoll M
    446. Tuomilehto J
    447. Uitterlinden AG
    448. Uusitupa M
    449. van der Harst P
    450. Walker M
    451. Wallaschofski H
    452. Wareham NJ
    453. Watkins H
    454. Weir DR
    455. Wichmann H-E
    456. Wilson JF
    457. Zanen P
    458. Borecki IB
    459. Deloukas P
    460. Fox CS
    461. Heid IM
    462. O’Connell JR
    463. Strachan DP
    464. Stefansson K
    465. van Duijn CM
    466. Abecasis GR
    467. Franke L
    468. Frayling TM
    469. McCarthy MI
    470. Visscher PM
    471. Scherag A
    472. Willer CJ
    473. Boehnke M
    474. Mohlke KL
    475. Lindgren CM
    476. Beckmann JS
    477. Barroso I
    478. North KE
    479. Ingelsson E
    480. Hirschhorn JN
    481. Loos RJF
    482. Speliotes EK
    483. LifeLines Cohort Study
    484. ADIPOGen Consortium
    485. AGEN-BMI Working Group
    486. CARDIOGRAMplusC4D Consortium
    487. CKDGen Consortium
    488. GLGC
    489. ICBP
    490. MAGIC Investigators
    491. MuTHER Consortium
    492. MIGen Consortium
    493. PAGE Consortium
    494. ReproGen Consortium
    495. GENIE Consortium
    496. International Endogene Consortium
    (2015) Genetic studies of body mass index yield new insights for obesity biology
    Nature 518:197–206.
    https://doi.org/10.1038/nature14177
  1. Software
    1. World Health Organization
    (2000)
    Regional Office for the Western P. The Asia-Pacific Perspective: Redefining Obesity and Its Treatment Health Communications Australia
    WHO.
    1. Yonenobu K
    2. Nakamura K
    3. Toyama Y
    (2006)
    Pharmacotherapy for Ossification of the Spinal Ligaments: Clinical Trial of Disodium 1-Hydroxyethylidene Diphosphonate to Inhibit Progression of Ossification of the Posterior Longitudinal Ligament in the Cervical Spine after Posterior Decompression Surgery, 2nd Edition
    169–176, OPLL: ossification of the posterior longitudinal ligament, Pharmacotherapy for Ossification of the Spinal Ligaments: Clinical Trial of Disodium 1-Hydroxyethylidene Diphosphonate to Inhibit Progression of Ossification of the Posterior Longitudinal Ligament in the Cervical Spine after Posterior Decompression Surgery, 2nd Edition, Tokyo, Springer, 10.1007/978-4-431-32563-5.

Decision letter

  1. Cheryl Ackert-Bicknell
    Reviewing Editor; University of Colorado, United States
  2. Mone Zaidi
    Senior Editor; Icahn School of Medicine at Mount Sinai, United States

In the interests of transparency, eLife publishes the most substantive revision requests and the accompanying author responses.

Decision letter after peer review:

[Editors’ note: the authors submitted for reconsideration following the decision after peer review. What follows is the decision letter after the first round of review.]

Thank you for submitting the paper “Genetic insights into ossification of the posterior longitudinal ligament of the spine” for consideration by eLife. Your article has been reviewed by 3 peer reviewers, and the evaluation has been overseen by a Reviewing Editor and a Senior Editor. The following individual involved in the review of your submission has agreed to reveal their identity: Emma Duncan (Reviewer #3).

Comments to the Authors:

We are sorry to say that, after consultation with the reviewers, we have decided that this work will not be considered further for publication by eLife.

A spirited conversation was had among the reviewers regarding this paper. The reviewers unanimously agree that the topic of the paper is exciting and that this body of work has promise. Unfortunately, the reviewers ultimately agreed that this work is not yet ready to be accepted by eLife. There are several major issues that are too larger to consider this work for revision alone. The first issue is that this work lacks validation in any way. It is appreciated that a validation cohort may well be impossible at this time, but without other robust validation approaches, this work is too premature for publication. The other issue is with how the results were interpreted. The reviewers recognized that the perfect transcriptomic datasets for use with this work simply do not exist and that the authors cannot use Japanese GWAS data for every trait in their analyses. It was the overall impression that there was a lot of mix-and-matching of datasets going on to suit pre-ordained hypotheses rather than being more hypothesis-free in their co-heritability analyses. This biased/pre-conceived conclusion approach very much taints the discussion of this paper. A true exploration in a hypothesis-free manner is doable and would result in an outstanding paper. This point is the major reason that this work was rejected. We would like to reconsider this paper as a new submission to eLife after the authors have carefully explored their data to ensure that the study was conducted rigorously in a bias-free manner.

Reviewer #1 (Recommendations for the authors):

Overall, this study uses a comprehensive suite of statistical tools to move from GWAS through to attempts to identify the mechanism.

Strengths of this work include the thoroughness of the in silico genetics investigation of an understudied genetic condition. This study highlights putative causative mechanisms by which OPLL could arise.

There are two main weaknesses of this study. The first is that this study is largely lacking replication. The second issue is that this is all analytical, and there is no functional follow-up or biological validation. As a result, the mechanism is not yet proven.

1. The abstract does not follow the flow of the paper.

2. Lines 191-200: more is needed to justify the statement that “we found several candidate causal genes reported to be related to osteogenesis….” First of all, the genes listed are the closest to the peak genes and so the word causal should be removed. Second, only two of the genes are described in any detail to support this statement.

3. Additional detail is required for the methods for the application of the FUMA package. As presented, this work assumes a substantial understanding of how FUMA works and what the results are, which is not likely to be true for a non-genetics journal such as this one.

4. A similar issue applies as above for the application of SMR.

5. Lines 226-239 – only two of the three genes are mentioned. If nothing is known about the third, this should be stated.

6. Lines 340 – 345: High-fat diet is not considered to increase bone generally in animal models. This section is a misleading selection of references and is not presented in an unbiased fashion. For example, all of the following references found that a high-fat diet was detrimental to bone: (see following Pubmed ID’s, these are just the 2022 reference 19750487, 35788787, 35762155, 35718325, 35578981, 35257177) in animals models. In humans, the issue is more complex. This section needs to be expanded and be more transparent given that the BMI and OPLL link is a central conclusion.

7. Overall, this study is lacking a summarizing conclusion section.

8. The limitations of this work need to be more completely explored.

Reviewer #2 (Recommendations for the authors):

Ectopic ossification is a fairly common clinical finding and the posterior longitudinal spinal ligament is a common site for this to occur (hereafter abbreviated as OPLL). Previous work has identified associations between OPLL and various chronic conditions, including positive association with obesity and negative association with osteoporosis. The authors used a variety of genetic approaches to gain insight into OPLL pathogenesis, which is poorly understood. The authors report several genetic associations from GWAS and candidate gene-based associations and infer potential causal relationships from Mendelian randomization. These findings were used to develop a polygenic risk score. They identify H3K27 acetylation in hypertrophic chondrocytes as a potential critical process in OPLL pathogenesis. The single most compelling element of this work was the Mendelian randomization of BMI with thoracic, but not cervical, OPLL. This was the statistically most robust finding and it also resonates intuitively with the idea that a BMI-based association would be demonstrated in the anatomical region more affected by differences in weight-bearing. Positive associations with type 2 diabetes, uterine fibroids, and cataracts as well as negative associations with BMD, cerebral aneurysms, and HDL cholesterol were also noted. This work opens up the field to new experimental work and represents a clear advance in the field.

Strengths: Undertaking a variety of complementary genetic analyses is a clear strength of this work. In addition to the multiple approaches, there were several additional strengths worth noting. The team did an excellent job of exploiting informatics resources to support their investigation. The GWAS meta-analysis was conducted using a large cohort of Japanese subjects, limiting the risk that population stratification drove positive results. The Mendelian randomization used multiple approaches to seek violation of the pleiotropy assumption. They followed a best practice in conducting the “leave one out” analysis. These investigators did the opposite of “turn the crank” labs that have established pipelines for conducting a specific type of analysis and apply it to every problem. Instead, they used multiple tools to focus on a poorly understood disorder.

Weaknesses: The main limitation of this work was the lack of direct experimental evidence to support the role of the identified candidate genes in OPLL pathogenesis.

Validity and Impact: The authors report 14 genetic associations from GWAS, 5 from candidate gene-based associations, and infer 8 potential causal relationships from Mendelian randomization. Additional Mendelian randomization analyses yielded negative results. These findings were used to develop a polygenic risk score. They identify H3K27 acetylation in hypertrophic chondrocytes as a potential critical process in OPLL pathogenesis. The single most compelling element of this work, in my opinion, was the Mendelian randomization of BMI with thoracic, but not cervical, OPLL. This was the statistically most robust finding and it also resonates intuitively with the idea that a BMI-based association would be demonstrated in the anatomical region more affected by differences in weight-bearing. Positive associations with type 2 diabetes, uterine fibroids, and cataracts as well as negative associations with BMD, cerebral aneurysms, and HDL cholesterol were also noted. This work opens up the field to new experimental work and represents a clear advance in the field.

The main points are covered in the public review. In addition, please consider the following:

1. BMI is a fairly sloppy phenotype. It does not really reflect adiposity (eg some highly trained athletes have high BMIs but very low body fat %). Did you either adjust for stature or use another measure of obesity, and if so, what were the results?

2. It is notable that some of the BMD associations you observed were with pediatric rather than adult phenotypes. Do you think that this might reflect dysregulated prolongation of processes that normally are temporally constrained?

3. Did the analysis of genetic correlation and other conditions include any of the following: serum Ca, serum phosphate, aortic stenosis, injury-related ectopic ossification, or renal function? It might be worth listing all the tested conditions in a supplementary table.

4. I do not understand the distinction between diseases and quantitative traits in figure 3. Were the “diseases” coded categorically while the quantitative traits were classified continuously? You list “osteoporosis” as the disease, but most analyses are done on BMD (quantitative trait) or fracture. I suggest merging the 2 parts of the figure and omitting any attempt to distinguish diseases from traits. I like the way this figure displays effect size and statistical robustness together.

Reviewer #3 (Recommendations for the authors):

Here the authors have conducted a comprehensive genetic interrogation of the condition OPLL. The authors have shown that this disease is heritable and identified some interesting genome-wide significant loci – although these explain only a small proportion of the overall heritability. Their functional genomics analyses add to the paper, and their results are plausible – in that some of the identified genes are involved in bone metabolism (although they also show a relationship with immune/haematopoietic cell grouping, which is not explored or discussed). Further, that there is support for a genetic relationship between BMI and OPLL in the Japanese population which corresponds to the clinical epidemiology.

Through no fault of their own, some of the authors’ ability to perform and extrapolate gene expression analyses is hampered by a lack of transcriptomic datasets from arguably the most relevant tissue types (including bone, cartilage, ligamentous tissue) within the available datasets worldwide. Similarly, although the authors aimed in their MR analysis to use Japanese GWAS data, they were often constrained to needing to use other ethnic groups (e.g., for the BMD analysis) and thus the MR analyses are not uniform.

The authors have also restricted some of their analyses to 'the usual suspects' (e.g., BMI, T2DM, BMD) and not considered other ossification processes such as ankylosing spondylitis and heterotopic ossification. This seems to be unnecessarily limiting and counterproductive when considering the benefits of hypothesis-free approaches in generating new insights into aetiopathogenesis and future therapeutic directions.

The discussion needs more nuance and finesse, including placing results in context and considering strengths and weaknesses more carefully. Additionally, the authors have focused on new loci throughout this manuscript: in considering overall pathogenesis/aetiology the authors should include known loci in the discussion. The authors are encouraged to think about their results outside a bone filter.

Summary to Authors

1. There are some methodological issues that the authors cannot solve (e.g., lack of transcriptomic sets from all relevant tissue types; lack of GWAS in Japanese populations for some of the MR analyses); these are iterated in the methods and results but should be highlighted as part of the limitations in the discussion.

2. Most results appear robust (apart from T-OPLL data). Some additional analyses (specifically, some further co-heritability analyses) are suggested that would strengthen this manuscript and should be easily do-able within their dataset. The discussion needs some redrafting according to the comments below.

Introduction and methods

1. Why is the epidemiology of OPLL in Japanese individuals so different from other ethnicities? A three-fold difference in a polygenic disease between ethnicities is a massive difference. Although there may not be an answer here, this massive epidemiological difference needs more emphasis.

2. Are there any previous papers assessing heritability for OPLL? Some data regarding genetic epidemiology would add to this paper. Is there any evidence, for example, of a major gene effect on a polygenic background that might explain the ethnicity differences?

3. Three small GWAS, all conducted in a Japanese population, have been meta-analysed. What is the power of each GWAS individually and for meta-analysis overall? There is a large and differential dropout at the QC level (controls >> cases – e.g. set 1 – 92% of cases passed, 85% of controls; set 3: 97% of cases vs. 86% of controls) – Supplementary figure 1. The dropout Is unusually high and the reason for such differing rates is unclear, although the reviewer notes (lines 386-396 and Supplementary Table 1) that cases and controls were genotyped separately and in different laboratories (here the reviewer notes the high number of principal components used in the analysis – to ten). The authors should include this issue in their limitations. What where the co-variates used in the GWAS (?BMI ?weight ?presence/absence of T2DM) should be detailed. An Rsq>0.3 for imputation is generous; a more stringent threshold would be 0.8. could the authors justify this choice?

4. Are there any other GWAS in other ethnicities? [Perhaps not, given how specific this disease appears to be to Japan, and if this is the case it should be mentioned in the discussion. However, if so, this would make the meta-analysis more informative].

5. Figure 1: Manhattan plot for the meta-analysis. Here the authors appear to have somewhat selectively chosen to annotate some of their significant loci and not others. Line 448 suggests that this is because these are the novel loci. The reviewer thinks it would be more appropriate for all genome-wide significant peaks to be similarly annotated (perhaps in different colours for new vs. known loci), to give the reader the full view of the genetic information within this one image rather than having to refer to previous publications.

6. The reviewer notes that the criteria for cases vary between sets 1 and 2 vs. set 3. The authors do not really justify their decision to split the data into cervical and thoracic subsets from an epidemiological (genetic or otherwise) or clinical basis. Are these really discrete clinical entities, with separate epidemiology and disease course? The retro-assessment of C-OPLL and T-OPLL is not detailed (one reviewer? More than one reviewer? Quality control for calling this clinical phenotype?).

7. Supplementary Figure 3 – the locus zoom plots do not show which SNPs are imputed and which are genotyped. This should be added to the diagrams.

8. Line 461 Decisions around the associated locus of a lead variant is usually set by LD rather than physical distance.

9. Line 488 – Gene set enrichment analysis – although this is a reasonable process, either here or elsewhere the authors should provide reference justification for choosing to assess genes based on physical location (within 1Mb of leading SNP plus up to five genes 'closest' to leading SNPs) as there are now notable examples in the literature where the leading SNP signal does not correlate physically to the causative gene, with obesity being a lead example here.

10. Line 498 – eQTL analysis in 'all available tissues' – the authors need to comment in their discussion on the relevance/appropriateness of the tissues captured in GTEx v8 (noting here bone and/or cartilage and/or ligamentous tissue are not included in GTEx v8).

11. Line 503 – unclear why v7 is used here whereas v8 is used above.

12. Line 518ff Genetic correlations were assessed using bivariate LD score regression and Japanese data – it is implied here that this only used Japanese data (which is appropriate) but this should be definitively confirmed.

13. Lines 528ff for the MR study, the authors used GWAS data from varying ethnic backgrounds, including Japanese and European and east-Asian (presumably Chinese+Japanese here), which varied from trait to trait (e.g European GWAS was used for the BMD analysis, and east Asian for the T2DM analysis). This limits the robustness of this section, as these were not equally valid tools for the MR analysis. In particular, the BMI data were informed from both Japanese and European GWAS data. As the relationship between BMI and OPLL is one of the major findings of this paper, this analysis should be repeated using data ONLY from Japanese BMI GWAS, as a sensitivity analysis.

14. Line 555ff – the authors appropriately assessed their data to ensure no overlap between exposure and outcome datasets – but it is not clear what they then did, having found that there were small overlaps.

15. Considering the PRS of BMI wrt application to OPLL GWAS – the authors appropriately use a Japanese-population GWAS here.

16. Line 577 – the reviewer notes in line 582 that having tried out differing r2 and p values they eventually chose r2 of 0.9 tho' P-value=0.6 – this would mean almost any result in the BMI GWAS could be included. From the image Supplementary Figure 20 they could have chosen p=0.05 without much difference in their rho value, and this would seem at least a little more stringent.

Results

1. Line 175FF: have the authors corrected their p-value for significance by this (modest) genomic inflation factor (1.11)?

2. Line 209ff: the authors should make an explicit comment on their lack of enrichment in DXA-assessed BMD in adults (e.g. using data from GEFOS2).

3. Line 219ff: the authors' decision as to which are and which are not plausible causative genes seems arbitrary [based mainly on previous data for monogenic skeletal dysplasias it would seem]. If only these genes for which there is prior knowledge are considered it somewhat defeats the point of trying to gain new knowledge from hypothesis-free approaches. This continues to be an issue in the discussion too. The authors should describe the known function of other genes too.

4. Similarly Line 241ff. Whilst reporting their significant enrichment in the connective/bone cell group, the authors have not mentioned here that they also had significant enrichment for the immune/hematopoietic cell group, with a significant result for skeletal muscle which did not survive after FDR adjustment. These other cell groups are highly relevant to the phenotype and should be mentioned here similarly.

5. The authors' choice for co-heritability studies is limited. The authors have not considered GWAS for AS, for example, which may be highly relevant. The authors should consider an unbiased coheritability analysis rather than only the 'usual suspects' – as the latter will only really confirm prior thoughts and not illustrate novel pathways/mechanisms (for example see the recent paper on IBS).

6. Supp Figure 5: the calling of eight new loci for T-OPLL is over-enthusiastic. There is very little genetic support for ZBTB40, for example (see Locuszoom plot in Supplementary Figure 8), and it's not clear whether this is a genotyped or imputed SNP (not shown in Supplementary table 11). Similar comments are made about the alleged novel loci in plots c, e, f, g, and h. The only believable putative novel loci are shown in plots b and d. The authors should tone down their claims about discrete novel loci for T-OPLL substantially, therefore, throughout the manuscript (including abstract, results, and discussion). Related to this, the authors should reconsider rewriting sections where they feature T-OPLL. In discussing these possible site-specific T-OPLL GWAS results, the authors do not avail themselves of the opportunity to discuss the two plausible loci but only discuss ZBTB40. What is known about genes within the two more plausible loci?

7. Line 265ff the authors should flag at first mention here and in the methods (at line 520) that there is a supplementary table listing the complex traits considered here, especially as this is limited (appropriately) to previous genetic studies in Japanese populations (as per the methods). Although the authors' approach here is appropriate (i.e., limited to the Japanese population), the point is that these GWAS represent only a subset of the many traits mapped by GWAS internationally [this is given later in the paragraph but should be flagged earlier for the reader].

8. Line 271: ossification and bone mineral density accrual are quite different processes. In particular, BMD is likely to be artefactually elevated by the presence of OPLL, if this affects lower spinal areas, as it is also in AS, DISH, etc. The authors need to provide more clarity, nuance, and detail here.

9. The results would benefit from editorial comments being removed from the results and placed in the discussion (e.g. lines 269-271).

10. Line 316ff PRS scores – these β values may be significant but they are small. Can the authors contextualize their results with, say, the PRS for BMI and T2D?

11. The authors have attempted to split their data by clinical phenotype (cervical vs. thoracic OPLL); the data supporting multiple novel loci for T-OPLL do not appear robust from the locuszoom plots and the authors are encouraged to tone down this component substantially (for example, focusing on ZBTB40 as a locus for T-OPLL appears implausible from the Locuszoom plot (one is left with an impression that there was some prior hypothesis contribution to this point [e.g., it being a known BMD locus]) whereas other much more plausible loci (based on the Locuszoom images) do not receive similar attention).

Discussion

Their discussion is inadequate; and needs much more care and non-biased interpretation, and detailing of the [many] limitations. Also, there is an obvious clinical question, that they haven't posed: has weight loss been trialled as a therapeutic approach to mxmt of OPLL?

1. The authors' functional assessment in their first paragraph on bone formation needs toning down. Certainly, the authors' results are enriched for signals in bone metabolism pathways – but they don't know that these are necessarily anabolic, or anti-catabolic; and line 324ff bone formation and resorption are normally tightly coupled processes so it would be unusual for these to be uncoupled in OPLL uniquely. Moreover, the authors have mainly featured those genes that suit their argument; and have not commented, for example, that their gene enrichment analyses also identified immune/haematopoietic cell groups. Allowing for the time being their comment to stand: is there any evidence that bisphosphonates (that suppress both bone formation and bone resorption) improve outcomes with OPLL?

2. The relationship between EB and osteoporosis needs far more nuance if the authors are to include it in their argument regarding PLEC: it is thought to be multifactorial and related more to nutrition, drugs, mobility, etc, and there is not, to my knowledge, a known underlying mechanistic link directly related to the mutation and bone per se.

3. The benefits of considering this approach as novel knowledge-generating have been somewhat lost by the authors only focusing on bone in their discussion, and as they mostly do not mention information about previously reported loci it's hard to contextualise their newer findings with older knowledge regarding bone pathways vs. other pathways in terms of OPLL overall.

4. Lines 340ff – here the authors should be careful not to conflate BMD with ossification processes, and this section requires more nuance. The relationship between obesity and BMD is extremely contentious, and only referring to Lv et al. is a very simplistic reflection of the literature. (most of this paragraph really discusses the relationship between BMI and BMD, and not, as is pertinent here, BMD and OPLL, so it should be revised to focus on the newer loci presented here).

5. The authors have missed an opportunity to consider a relationship between OPLL and other ossifying processes, such as ankylosing spondylitis and heterotopic ossification. Whilst these may not have had GWAS performed in Japanese populations the authors have not always had Japanese population data for those studies that they have included (e.g., BMD).

6. The PRS suggests that there is a genetic relationship between BMI and OPLL, with BMI driving OPLL. However, the β suggests the clinical impact is extremely small. Contextualising their results with other PRS would help the reader understand the clinical impact of their findings.

7. The authors do not discuss the strengths and weaknesses of their paper, which would add sobriety to their discussion.

8. Paradoxically, the authors focus a lot on talking about novel treatments, etc but by only looking at previously known pathways they've limited the ability to look at these. Also, the most obvious way to manage high BMI would be weight loss. Not sure this really represents a novel treatment for OPLL, as such.

9. The authors have also not contextualized their results in light of previous data. For example, here they have shown heritability of OPLL of >50%. Have there been any previous studies of heritability?

https://doi.org/10.7554/eLife.86514.sa1

Author response

Editors’ note: the authors resubmitted a revised version of the paper for consideration. What follows is the authors’ response to the first round of review.

Reviewer #1 (Recommendations for the authors):

Overall, this study uses a comprehensive suite of statistical tools to move from GWAS through to attempts to identify the mechanism.

Strengths of this work include the thoroughness of the in silico genetics investigation of an understudied genetic condition. This study highlights putative causative mechanisms by which OPLL could arise.

There are two main weaknesses of this study. The first is that this study is largely lacking replication. The second issue is that this is all analytical, and there is no functional follow-up or biological validation. As a result, the mechanism is not yet proven.

We thank you for the comprehensive review of our manuscript and valuable suggestions. We have again discussed the two weaknesses you have pointed out.

As for the lack of replication, we added new replication data and evaluated the reproducibility. Our study originally conducted meta-analyses using three datasets. The result showed that the directions of effect sizes of all 14 lead SNPs in the significant loci were consistent across the three cohorts. The analyses of OPLL subtypes also showed that the directions of effect sizes for most lead SNPs were consistent among the three cohorts. With these results, we believed that our results were valid. However, as you pointed out, we understood that to make our report more reliable, it is important to further check the reproducibility using another data set even after confirming that the directions of the signals in the meta-analysis are consistent in each cohort. Therefore, we evaluated the reproducibility of the lead SNP signals using OPLL data independent of the data used in the meta-analysis. As for ALL-OPLL, we confirmed that the direction of betas for the lead SNPs in most regions (13/14) is consistent between the original GWAS meta-analysis and the replication study (P value of the binomial test was 1.83E-03). In this way, we were then able to further reinforce the validity of our data.

Furthermore, to evaluate the validity of the results of Mendelian randomization (MR), which is one of the main analyses in this study to assess the causal relationship between other traits and OPLL, we re-conducted MR with the addition of data from the replication cohort and compared them with the original data. As a result, the MR conducted again successfully reinforced the validity of our original results.

As for functional follow-up or biological validation, we evaluated the expression levels of the candidate genes discovered in our study using gene expression data from spinal ligament tissue and related tissues/cells. As you pointed out, biological validation, such as confirmation of gene expression in the actual target tissue, is very important to examine the involvement of the target gene in the disease. Although gene expression data for spinal ligament tissue is scarce, there were some useful available deposited data in a recently published paper (PMID: 35984875): gene expression data in a spinal ligament in patients with OPLL and cervical spondylotic myelopathy (CSM) (GSE126060), and in human ligament cells following chondrogenic differentiation (GSE126060). We were able to confirm the expression of the candidate genes in these tissues and cells, reinforcing the validity of this study. To further validate our findings, we evaluated the expression of the candidate genes using available single-cell RNA sequencing data from a mouse Achilles tendon ossification model (GSE126060 and GSE188758). As a result, we could confirm the gene expression with single-cell resolution.

By improving these two points you mentioned, we believe our study's findings have become more robust. We would like to thank you again for the valuable review comments.

1. The abstract does not follow the flow of the paper.

Thank you for the comments. We have changed the style of the abstract to match the flow of the results.

2. Lines 191-200: more is needed to justify the statement that "we found several candidate causal genes reported to be related to osteogenesis…." First of all, the genes listed are the closest to the peak genes and so the word causal should be removed. Second, only two of the genes are described in any detail to support this statement.

Thank you very much for the comments. We agree that the word “causal” is somewhat overstated for genes closest to lead variants (while closest genes are the best candidates of causal genes in many GWAS papers). We have modified to “potentially causal”.

3. Additional detail is required for the methods for the application of the FUMA package. As presented, this work assumes a substantial understanding of how FUMA works and what the results are, which is not likely to be true for a non-genetics journal such as this one.

Thank you very much for the comments. We agree to provide a more detailed explanation of the FUMA to broad readers. We have added a description of FUMA and the gene-based analysis called MAGMA used in FUMA as follows.

p28, L663

“FUMA is a web-based platform in which we can perform GWAS-related analyses such as gene-based analysis and gene set enrichment analysis (Watanabe et al., 2017).”

p28, L671

“MAGMA uses input GWAS summary statistics to compute gene-based P-values. For this analysis, the gene-based P-value is computed for protein-coding genes by mapping SNPs to genes if SNPs are located within the genes.”

4. A similar issue applies as above for the application of SMR.

Thank you very much for the comments. As you suggested, we also added an explanation for SMR as follows.

p29, L684

“SMR is used to determine associations between genetically determined traits, such as gene expression and protein abundance, and a complex trait of interest, such as OPLL. This analysis is designed to test if the effect size of an SNP on the phenotype is mediated by gene expression.”

5. Lines 226-239 – only two of the three genes are mentioned. If nothing is known about the third, this should be stated.

Thank you very much for the comments. We agree to mention all three genes we found in the SMR. I searched the literature regarding the gene RP11-967K21.1, but could not find anything related to OPLL. The following was added to the text as a description of RP11-967K21.1.

p11, L251

“As for RP11-967K21.1, its function in OPLL development is currently unknown and is expected to be elucidated in future studies.”

6. Lines 340 – 345: High-fat diet is not considered to increase bone generally in animal models. This section is a misleading selection of references and is not presented in an unbiased fashion. For example, all of the following references found that a high-fat diet was detrimental to bone: (see following Pubmed ID's, these are just the 2022 reference 19750487, 35788787, 35762155, 35718325, 35578981, 35257177) in animals models. In humans, the issue is more complex. This section needs to be expanded and be more transparent given that the BMI and OPLL link is a central conclusion.

Thank you very much for the very important remarks. We agree that the selection of the references in the original submission might be misleading and might be regarded as biased.

Many papers in clinical studies show that obesity affects the direction of bone gain, but in animal models, there are two sides to the argument. Rather, high-fat diets are often reported to have a negative effect on bone in animal models. We agree to mention these points fairly. Thus, we modified the manuscript as follows.

p19, L452

“Yamamoto et al. reported a high incidence of OPLL in the Zucker fatty rat, a model mouse of obesity with a loss-of-function mutation in the leptin receptor gene (Yamamoto et al., 2004). However, basic studies with small animals have reported conflicting results regarding the effects of obesity on bone formation. In general, high-fat diet (HFD)-induced obesity is detrimental to bone formation and results in low bone density in mice (Zhang et al., 2022). On the other hand, Lv et al. reported that the mRNA level of Runx2 in bone marrow-derived mesenchymal stem cells from HFD mice was significantly higher; in contrast, that of Pparγ, which suppresses osteoblast differentiation and promotes osteoclast differentiation, was significantly lower than the control mice (Lv et al., 2010). Thus, the results of basic experiments are varied and controversial.”

7. Overall, this study is lacking a summarizing conclusion section.

Thank you for the comments. We agree to include a conclusion section; we have added one in the last paragraph of the Discussion section as follows.

p23, L542

In conclusion, this study identified candidate genes in genomic loci associated with OPLL, and subsequent post-GWAS analyses showed a causal relationship between other traits and OPLL: obesity and high BMD. This study will serve as a basis for future research to elucidate the pathogenesis of OPLL in more detail and to develop new treatment methods.

8. The limitations of this work need to be more completely explored.

Thank you very much for your comments. Another reviewer also commented on describing the limitations of this study. Thus, we describe the limitations of this study in the Discussion section as follows.

p22, L525

“There are some limitations in this study. The first is the GWAS sample size. Although this study is the largest OPLL GWAS in the world and used samples collected from facilities throughout Japan, additional samples are needed to clarify the pathogenesis of OPLL further and better define subtype differences. In addition, OPLL GWAS in other ethnic groups has not been reported. We expect future international meta-analysis using data from non-Japanese ethnic groups to elucidate regional differences in the frequencies of OPLL. Second, gene expression data in spinal ligament tissue is scarce. Therefore, we were forced to use tissue data different from ligament tissue, such as GETx (GTEx Consortium, 2015), which did not include bone, cartilage, or ligamentous tissue, and data from a mouse Achilles tendon ossification model, which resembles spinal ligament ossification. We also used bulk data from spinal ligaments, but the sample sizes were limited. It is desirable to increase the number of spinal ligament tissue samples and perform expression analysis using scRNAseq in the future. If so, genes other than those focused on in this study could be identified as causal genes. Another limitation is that the Japanese GWAS data used for genetic correlation analysis were limited to 96 traits, and other traits not analyzed for genetic correlation may be associated with OPLL. In addition, some of the data used for MR were not East Asian. While we cannot immediately improve upon the limitations listed above, we intend to strengthen these areas for future research for OPLL.”

Reviewer #2 (Recommendations for the authors):

Ectopic ossification is a fairly common clinical finding and the posterior longitudinal spinal ligament is a common site for this to occur (hereafter abbreviated as OPLL). Previous work has identified associations between OPLL and various chronic conditions, including positive association with obesity and negative association with osteoporosis. The authors used a variety of genetic approaches to gain insight into OPLL pathogenesis, which is poorly understood. The authors report several genetic associations from GWAS and candidate gene-based associations and infer potential causal relationships from Mendelian randomization. These findings were used to develop a polygenic risk score. They identify H3K27 acetylation in hypertrophic chondrocytes as a potential critical process in OPLL pathogenesis. The single most compelling element of this work was the Mendelian randomization of BMI with thoracic, but not cervical, OPLL. This was the statistically most robust finding and it also resonates intuitively with the idea that a BMI-based association would be demonstrated in the anatomical region more affected by differences in weight-bearing. Positive associations with type 2 diabetes, uterine fibroids, and cataracts as well as negative associations with BMD, cerebral aneurysms, and HDL cholesterol were also noted. This work opens up the field to new experimental work and represents a clear advance in the field.

Strengths: Undertaking a variety of complementary genetic analyses is a clear strength of this work. In addition to the multiple approaches, there were several additional strengths worth noting. The team did an excellent job of exploiting informatics resources to support their investigation. The GWAS meta-analysis was conducted using a large cohort of Japanese subjects, limiting the risk that population stratification drove positive results. The Mendelian randomization used multiple approaches to seek violation of the pleiotropy assumption. They followed a best practice in conducting the "leave one out" analysis. These investigators did the opposite of "turn the crank" labs that have established pipelines for conducting a specific type of analysis and apply it to every problem. Instead, they used multiple tools to focus on a poorly understood disorder.

Weaknesses: The main limitation of this work was the lack of direct experimental evidence to support the role of the identified candidate genes in OPLL pathogenesis.

Validity and Impact: The authors report 14 genetic associations from GWAS, 5 from candidate gene-based associations, and infer 8 potential causal relationships from Mendelian randomization. Additional Mendelian randomization analyses yielded negative results. These findings were used to develop a polygenic risk score. They identify H3K27 acetylation in hypertrophic chondrocytes as a potential critical process in OPLL pathogenesis. The single most compelling element of this work, in my opinion, was the Mendelian randomization of BMI with thoracic, but not cervical, OPLL. This was the statistically most robust finding and it also resonates intuitively with the idea that a BMI-based association would be demonstrated in the anatomical region more affected by differences in weight-bearing. Positive associations with type 2 diabetes, uterine fibroids, and cataracts as well as negative associations with BMD, cerebral aneurysms, and HDL cholesterol were also noted. This work opens up the field to new experimental work and represents a clear advance in the field.

We thank you for the comprehensive review and positive evaluations of our manuscript and for providing us with valuable suggestions.

The weaknesses in this study that you have pointed out also point other reviewers have raised, and we addressed them in the revised manuscript.

To remedy this weakness, we evaluated the expression levels of the candidate genes discovered in our study using gene expression data from spinal ligament tissue and related tissues/cells. We used available deposited data in a recently published paper (PMID: 35984875): Gene expression data in a spinal ligament in patients with OPLL and cervical spondylotic myelopathy (CSM) (GSE126060) and in human ligament cells following chondrogenic differentiation (GSE126060). Using these data, we examined the expression levels of the candidate genes of interest in our study. As a result, we confirmed that most genes are expressed in the spinal ligament of OPLL patients and chondrogenic differentiated cells. Furthermore, we confirmed that WWP2, the gene of particular interest in our study, is significantly upregulated in the spinal ligament of OPLL patients compared to CSM patients and that WWP2 is also significantly upregulated in chondrogenic differentiated cells compared to the control group. We have added these to the results and Methods section. Aside from gene expression analyses, we recruited another data set and confirmed genetic associations in the original submission.

To further reinforce the weaknesses of our study, we evaluated candidate gene expression using single-cell RNA sequencing data from available mouse Achilles tendon ossification models (GSE126060 and GSE188758). As a result, we could confirm gene expression at single-cell resolution.

We believe that by improving on this important point that you have pointed out, the findings of this study are now more robust. We would like to thank you again for your valuable review comments.

The main points are covered in the public review. In addition, please consider the following:

1. BMI is a fairly sloppy phenotype. It does not really reflect adiposity (eg some highly trained athletes have high BMIs but very low body fat %). Did you either adjust for stature or use another measure of obesity, and if so, what were the results?

Thank you very much for the important comments. We understand that we need to evaluate not only BMI but also other obesity traits. Therefore, we added MR using data from the Giant Consortium and UKBB meta-analysis on the waist-to-hip ratio (WHR), which is believed to reflect adiposity more than BMI. As a result, we confirmed a causal relationship between WHR and OPLL.

p17, L399

“Next, we conducted additional MR for obesity-related traits. We used the data from the large GWAS meta-analyses for obesity-related traits from UK Biobank (UKBB) and Giant Consortium: BMI, waist-to-hip ratio (WHR), and WHR adjusted by BMI (WHRadjBMI) (Pulit et al., 2019) (Supplementary Table 20). Regarding causality from BMI to OPLL, all four MR methods showed significant causality for ALL- and T-OPLL, while only IVW method showed causality for C-OPLL (Supplementary Figure 25, Supplementary Table 21). Regarding causality from WHR to OPLL, 2/4 and 3/4 MR methods showed significant causality for ALL- and T-OPLL, respectively, but no significant results were obtained for COPLL by either method. For both traits, the magnitude of the causal effect size estimated by MR tended to be larger for C-, ALL-, and T-OPLL, in that order, suggesting a strong influence of obesity on the development of T-OPLL. On the other hand, no significant causal relationship was found in the MR on OPLL from WHRadjBMI, a surrogate index of abdominal adiposity. It suggests that systemic obesity, rather than a simple high percentage of abdominal fat, influences the development of OPLL.”

In addition, large GWASs using UKB data (GWAS round 2, http://www.nealelab.is/uk-biobank) for other obesity-related traits existed, so we conducted MR as well. However, MR for these traits could not be estimated accurately because the results were considered highly biased based on the MR-Egger intercept, as shown in Author response table 1. Therefore, causal estimation for these traits could not be done, and we did not add them to the paper.

Author response table 1
Estimates of Egger intercept.
TraitOPLL typeEgger_intercept (se)p
Body fat percentageALL-0.0285 (0.0107)7.82E-03
Body fat percentageC-0.0120 (0.0148)4.16E-01
Body fat percentageT-0.0672 (0.0160)3.48E-05
Leg fat percentage (right)ALL-0.0302 (0.0084)3.98E-04
Leg fat percentage (right)C-0.0163 (0.0118)1.71E-01
Leg fat percentage (right)T-0.0608 (0.0125)2.10E-06
Leg fat percentage (left)ALL-0.0304 (0.0084)3.51E-04
Leg fat percentage (left)C-0.0161 (0.0118)1.73E-01
Leg fat percentage (left)T-0.0606 (0.0125)2.08E-06
Arm fat percentage (right)ALL-0.0272 (0.0092)3.32E-03
Arm fat percentage (right)C-0.0105 (0.0128)4.12E-01
Arm fat percentage (right)T-0.0604 (0.0136)1.34E-05
Arm fat percentage (left)ALL-0.0280 (0.0091)2.33E-03
Arm fat percentage (left)C-0.0121 (0.0127)3.41E-01
Arm fat percentage (left)T-0.0587 (0.0136)2.15E-05
Trunk fat percentageALL-0.0169 (0.0111)1.29E-01
Trunk fat percentageC-0.0050 (0.0152)7.46E-01
Trunk fat percentageT-0.0478 (0.0168)4.77E-03
  1. OPLL, ossification of the posterior longitudinal ligament of the spine; ALL, cervical + thoracic + others; C, cervical; T, thoracic.

2. It is notable that some of the BMD associations you observed were with pediatric rather than adult phenotypes. Do you think that this might reflect dysregulated prolongation of processes that normally are temporally constrained?

Thank you very much for the important comments. Please excuse us for making you confused. We do not believe that our results reflect dysregulated prolongation of processes that normally are temporally constrained. This is because OPLL is a disease that occurs predominantly in the 50s and beyond, which is a time apart from childhood.

Bone density is low at birth, increases gradually with age, peaks in the 20s, and then slowly declines (PMID: 27766484). Therefore, it is assumed that bone density in children reflects the degree of bone formation, although it is affected by various factors. Consequently, we believe that the results of this analysis, which relate to bone density in childhood, are data that support that OPLL is associated with bone formation. This point has been made clear in the Discussion section as follows.

p21, L485

“A gene set enrichment analysis identified significant enrichment in sets associated with BMD in children as well as adults. BMD is low at birth, increases gradually with age, peaks in the 20s, and then slowly declines (Iglesias-Linares et al., 2016). Therefore, it is assumed that BMD in children reflects the degree of bone formation, although it is affected by various factors. Our results can support that OPLL is closely associated with bone formation.”

3. Did the analysis of genetic correlation and other conditions include any of the following: serum Ca, serum phosphate, aortic stenosis, injury-related ectopic ossification, or renal function? It might be worth listing all the tested conditions in a supplementary table.

Thank you for your comment. We evaluated all the traits analyzed in the recently published GWAS paper from BioBank Japan (PMID: 29403010, 32514122, 28892062, and 32152314). Among them, serum Ca, serum phosphate, and renal function were included and analyzed in the previous submission. We had included a list of results in the supplemental figures, but we think the explanation in the text was not clear. Therefore, we revised the manuscript and flagged at first mention in the method and result of genetic correlation that there was a supplementary table listing the complex traits considered as follow.

p14, L306

“We investigated their relationship with OPLL using the GWAS data. We first calculated the genetic correlation between OPLL and 96 complex traits (mean number of around 130K) (Akiyama et al., 2019, 2017; Ishigaki et al., 2020; Kanai et al., 2018) (see Supplementary Table 13 for the traits analyzed).”

p31, L738

“We estimated the genetic correlations using a bivariate LD score regression (Bulik-Sullivan et al., 2015) using only recently published GWAS results for Japanese: 96 complex traits (Akiyama et al., 2019, 2017; Ishigaki et al., 2020; Kanai et al., 2018) (see Supplementary Table 13 for the traits analyzed).".

Injury-related ectopic ossification and aortic stenosis were not analyzed because they were not included in the above GWASs. We think it is a limitation of this study that only 96 traits out of the many diseases in the world have been evaluated for genetic correlation, so we mentioned it in the paragraph summarizing the limitations in the Discussion section.

p23, L537

“Another limitation is that the Japanese GWAS data used for genetic correlation analysis were limited to 96 traits, and other traits not analyzed for genetic correlation may be associated with OPLL.”

4. I do not understand the distinction between diseases and quantitative traits in figure 3. Were the "diseases" coded categorically while the quantitative traits were classified continuously? You list "osteoporosis" as the disease, but most analyses are done on BMD (quantitative trait) or fracture. I suggest merging the 2 parts of the figure and omitting any attempt to distinguish diseases from traits. I like the way this figure displays effect size and statistical robustness together.

As you pointed out, we reconsidered that it would be better to eliminate the distinction between disease and quantitative traits and integrate the results. We have revised the associated figures (Figure 3), tables, and text.

As a result of this correction for multiple testing, osteoporosis just barely did not meet the significance level (P=0.021, FDR=0.0504), but we included it in the MR evaluation because there have been several previous reports of a strong trend toward whole-body ossification in OPLL patients (30113323, 27903251, 30243519, and 6612370).

Reviewer #3 (Recommendations for the authors):

Here the authors have conducted a comprehensive genetic interrogation of the condition OPLL. The authors have shown that this disease is heritable and identified some interesting genome-wide significant loci – although these explain only a small proportion of the overall heritability. Their functional genomics analyses add to the paper, and their results are plausible – in that some of the identified genes are involved in bone metabolism (although they also show a relationship with immune/haematopoietic cell grouping, which is not explored or discussed). Further, that there is support for a genetic relationship between BMI and OPLL in the Japanese population which corresponds to the clinical epidemiology.

Through no fault of their own, some of the authors' ability to perform and extrapolate gene expression analyses is hampered by a lack of transcriptomic datasets from arguably the most relevant tissue types (including bone, cartilage, ligamentous tissue) within the available datasets worldwide. Similarly, although the authors aimed in their MR analysis to use Japanese GWAS data, they were often constrained to needing to use other ethnic groups (e.g., for the BMD analysis) and thus the MR analyses are not uniform.

The authors have also restricted some of their analyses to 'the usual suspects' (e.g., BMI, T2DM, BMD) and not considered other ossification processes such as ankylosing spondylitis and heterotopic ossification. This seems to be unnecessarily limiting and counterproductive when considering the benefits of hypothesis-free approaches in generating new insights into aetiopathogenesis and future therapeutic directions.

The discussion needs more nuance and finesse, including placing results in context and considering strengths and weaknesses more carefully. Additionally, the authors have focused on new loci throughout this manuscript: in considering overall pathogenesis/aetiology the authors should include known loci in the discussion. The authors are encouraged to think about their results outside a bone filter.

Thank you very much for the detailed review of our paper and for giving us very valuable comments.

We agree that the lack of transcriptome datasets from the most relevant tissue types (bone, cartilage, ligament tissue, etc.) is a limitation of this study. Thus, in the revised manuscript, we have sought publicly available transcriptome data of OPLL-related tissues and found reasonable expression of the genes we found in relevant tissues. We have added these results in the Result section and revised the Discussion section to state the lack of experimental evidence to consolidate the associations as a limitation of this study. We also added a limitation in the Discussion section: we had to use data from other ancestries in MR.

Regarding the selection of phenotypes to be tested in MR, we agree to select phenotypes in an unbiased manner. Please note that this study used data from all traits examined in a representative BioBank Japan, the largest Japanese biobank, reported in the past, and calculated genetic correlation (GC). Then, based on the results, we have limited the number of traits for which MR is performed in a hypothesis-free manner. Therefore, we do not believe that there is any bias here, but since the traits examined in the Japanese GWAS are limited to about 100 traits out of many, other traits not analyzed for GC in this study may actually be associated with OPLL. This is also a limitation of this study and has been added to the text. In addition, there were no appropriate data for heterotopic ossification, but a large GWAS had been reported for ankylosing spondylitis in the past, so we added an analysis using that data.

We have discussed the known loci as you have suggested regarding the Discussion section. In addition, we also discussed new findings outside of bone metabolism.

Summary to Authors

1. There are some methodological issues that the authors cannot solve (e.g., lack of transcriptomic sets from all relevant tissue types; lack of GWAS in Japanese populations for some of the MR analyses); these are iterated in the methods and results but should be highlighted as part of the limitations in the discussion.

Thank you for your very important remarks. As you pointed out, there are several limitations to this study. We have summarized those limitations in one paragraph in the Discussion section.

p22, L525

“There are some limitations in this study. The first is the GWAS sample size. Although this study is the largest OPLL GWAS in the world and used samples collected from facilities throughout Japan, additional samples are needed to clarify the pathogenesis of OPLL further and better define subtype differences. In addition, OPLL GWAS in other ethnic groups has not been reported. We expect future international meta-analysis using data from non-Japanese ethnic groups to elucidate regional differences in the frequencies of OPLL. Second, gene expression data in spinal ligament tissue is scarce. Therefore, we were forced to use tissue data different from ligament tissue, such as GETx (GTEx Consortium, 2015), which did not include bone, cartilage, or ligamentous tissue, and data from a mouse Achilles tendon ossification model, which resembles spinal ligament ossification. We also used bulk data from spinal ligaments, but the sample sizes were limited. It is desirable to increase the number of spinal ligament tissue samples and perform expression analysis using scRNAseq in the future. If so, genes other than those focused on in this study could be identified as causal genes. Another limitation is that the Japanese GWAS data used for genetic correlation analysis were limited to 96 traits, and other traits not analyzed for genetic correlation may be associated with OPLL. In addition, some of the data used for MR were not East Asian. While we cannot immediately improve upon the limitations listed above, we intend to strengthen these areas for future research for OPLL.”

2. Most results appear robust (apart from T-OPLL data). Some additional analyses (specifically, some further co-heritability analyses) are suggested that would strengthen this manuscript and should be easily do-able within their dataset. The discussion needs some redrafting according to the comments below.

As you indicated, we have revised the text to tone it down for interpretation of the T-OPLL results as follows.

p12, L266

“Of these loci, one in the C-OPLL analysis and nine in the T-OPLL analysis were not identified in the analysis of ALL-OPLL and other OPLL subtypes. However, most of the lead SNPs in these significant loci were rare variants. We cannot determine that these are the causal variants based on the present results alone, but there was an interesting variant among them. rs74707424, a leading SNP in the significant locus (19p12), is located in the 3’untranslated region of the ZBTB40 gene. In a recent study using primary osteoblasts of mouse calvaria, Doolittle et al. reported that Zbtb40 functions as a regulator of osteoblast activity and bone mass, and knockdown of Zbtb40, but not Wnt4, in osteoblasts drastically reduced mineralization (Doolittle et al., 2020).”

Furthermore, we conducted additional analyses: recruiting an additional data set to confirm the genetic associations and taking hip-waist-ratio as a phenotype for MR to show the causal relationship between adiposity and OPLL, and using transcriptome analysis to show expression of the genes we found in OPLL-relevant tissues. The discussion is redrafted according to your comments below.

Introduction and methods

1. Why is the epidemiology of OPLL in Japanese individuals so different from other ethnicities? A three-fold difference in a polygenic disease between ethnicities is a massive difference. Although there may not be an answer here, this massive epidemiological difference needs more emphasis.

Thank you for the comments. The reason for the difference in incidence among ethnic groups is unknown at this time (and not the topic to address in this paper, as you suggested). As you suggested, the massive epidemiological difference is more emphasized in the introduction.

p7, L135

“OPLL is a common disease; however, its frequency varies depending on the region of the world; high in Asian countries (0.4-3.0%), especially Japan (1.9-4.3%), compared with Europe and the United States (0.1-1.7%) (Matsunaga and Sakou, 2012; Ohtsuka et al., 1987; Sohn and Chung, 2013; Yoshimura et al., 2014).”

2. Are there any previous papers assessing heritability for OPLL? Some data regarding genetic epidemiology would add to this paper. Is there any evidence, for example, of a major gene effect on a polygenic background that might explain the ethnicity differences?

Thank you for the comments. There are no previous papers evaluating the heritability of OPLL such as twin studies. We tried to identify the possible explanation for ethnic differences in the prevalence of OPLL using polygenic signals with our data, but we could not obtain any evidence of a major genetic effect of polygenic background that would explain ethnic differences. We added these points to the Introduction and Discussion sections.

p7, L153

“Furthermore, because of the high incidence within families and close relatives in previous epidemiological studies, genetic factors have long been considered in OPLL development (Matsunaga et al., 1999; Sakou et al., 1991; Terayama, 1989), although there are no previous papers evaluating the heritability of OPLL such as twin studies.”

p22, L508

“This study demonstrates that OPLL is a highly heritable disease. Although previous clinical studies have suggested that OPLL is heritable, there have been no studies that have mentioned the heritability of OPLL. This study is the first to clarify the high heritability of OPLL quantitatively. Further elucidation of the pathogenesis of OPLL from a genetic approach is expected.”

p22, L525

“There are some limitations in this study. The first is the GWAS sample size. Although this study is the largest OPLL GWAS in the world and used samples collected from facilities throughout Japan, additional samples are needed to clarify the pathogenesis of OPLL further and better define subtype differences. In addition, OPLL GWAS in other ethnic groups has not been reported. We expect future international meta-analysis using data from non-Japanese ethnic groups to elucidate regional differences in the frequencies of OPLL.”

3. Three small GWAS, all conducted in a Japanese population, have been meta-analysed. What is the power of each GWAS individually and for meta-analysis overall? There is a large and differential dropout at the QC level (controls >> cases – e.g. set 1 – 92% of cases passed, 85% of controls; set 3: 97% of cases vs. 86% of controls) – Supplementary figure 1. The dropout is unusually high and the reason for such differing rates is unclear, although the reviewer notes (lines 386-396 and Supplementary Table 1) that cases and controls were genotyped separately and in different laboratories (here the reviewer notes the high number of principal components used in the analysis – to ten). The authors should include this issue in their limitations. What where the co-variates used in the GWAS (?BMI ?weight ?presence/absence of T2DM) should be detailed. An Rsq>0.3 for imputation is generous; a more stringent threshold would be 0.8. could the authors justify this choice?

Thank you for the comments.

Regarding a power analysis, as you suggested, we performed a power analysis for ALL-OPLL using GWAS results for each of the three data sets and meta-analysis results.

We examined the statistical power for MAF and odds ratio of variants to show a significance level of P-value = 5E-8 varying allele frequencies and odds ratio. As a result, using the results of the meta-analysis, all had a statistical power greater than 0.5. On the other hand, the results for each data set alone showed low statistical power (Author response image 1 and Figure 1—figure supplement 4). Since meta-analysis increases the statistical power by integrating data that would have low power on their own, we believe this result is reasonable. At the same time, we considered the results of the power analysis for each dataset alone to be meaningless and only included the results of the meta-analysis in the revised manuscript.

Author response image 1
Statistical power analysis.

X- and Y-axes represent minor allele frequencies and ORs, respectively. Α-error rate and statistical power are set to 5e-8 and 0.8 (red line) or 0.5 (blue line), respectively. Dots represent ORs of 14 OPLL-associated variants in GWAS meta-analysis for ALL-OPLL. We conducted analyses on each dataset and on the meta-analysis data: (a) Set 1, (b) Set 2, (c) Set 3.

Regarding QC, we noticed that the original submission contained some errors in numbers before QC. We sincerely thank the reviewers for pointing this out. We corrected these errors in the revised manuscript. As a result, the drop-out ratio is now as follows: 7.6 % of cases and 0.3 % of controls in set1; 9.6 % of cases and 0.3 % of controls in set 2; 2.9 % of cases and 5.2 % of controls in set 3 (Supplementary Figure 1). We modified them in the revision, and the differences became much smaller. While we still observed slight differences in passing rates of QC between cases and controls, it seems reasonable because control samples which previously used for other studies (in other words, we used a control data set previously filtered in prior) were subjected as controls in the current study and the majority of case drop-out is due to kinship (duplicated samples or familial cases with other cases – these were checked for controls in prior).

Regarding covariates, we used the top 10 PCs as covariates in our GWAS. This was mentioned in the previous submission. We have revised it and included it in the Methods section for better clarity.

While there is no golden standard for a threshold of imputation scores for meta-analyses, we believe that Rsq > 0.3 is a common threshold, in accordance with our team's previous reports (PMID: 34116867, 31417091, 33272962, 34850884, etc.). Importantly, all of the significant regions in ALL-, C- , and T-OPLL showed Rsq more than 0.638, 0.727, and 0.376, respectively.

This supports the validity of our findings, especially in ALL-OPLL.

4. Are there any other GWAS in other ethnicities? [perhaps not, given how specific this disease appears to be to Japan, and if this is the case it should be mentioned in the discussion. However, if so, this would make the meta-analysis more informative].

Thank you for your question. There are no reports of OPLL GWAS in other ethnicities. Since discovering the causes of ethnic differences is a future task, we have added the following statement to the Discussion section.

p22, L528

“In addition, OPLL GWAS in other ethnic groups has not been reported. We expect future international meta-analysis using data from non-Japanese ethnic groups to elucidate regional differences in the frequencies of OPLL.”

5. Figure 1: Manhattan plot for the meta-analysis. Here the authors appear to have somewhat selectively chosen to annotate some of their significant loci and not others. Line 448 suggests that this is because these are the novel loci. The reviewer thinks it would be more appropriate for all genome-wide significant peaks to be similarly annotated (perhaps in different colours for new vs. known loci), to give the reader the full view of the genetic information within this one image rather than having to refer to previous publications.

Thank you for your suggestion. As you suggested, all genome-wide significant peaks are annotated (Figure 1).

6. The reviewer notes that the criteria for cases vary between sets 1 and 2 vs. set 3. The authors do not really justify their decision to split the data into cervical and thoracic subsets from an epidemiological (genetic or otherwise) or clinical basis. Are these really discrete clinical entities, with separate epidemiology and disease course? The retro-assessment of C-OPLL and T-OPLL is not detailed (one reviewer? More than one reviewer? Quality control for calling this clinical phenotype?).

Thank you for the comments. We agree with the necessity to justify the separation of cases for COPLL and T-OPLL. In recent years, many clinical studies have been published showing that the clinical characteristics of OPLL differ between the cervical and thoracic types (PMID: 31290005, 35245901). This content is added to the text to emphasize the significance of analysis for each subtype.

In addition, it has been reported that T-OPLL in particular has a strong tendency to ossify and is often severe (PMID: 31290005, 35245901). So then, in recent years, we have focused on T-OPLL among OPLL cases and collected genomes. Therefore, cases in the set 3, which were collected recently, are only T-OPLL. This is why the criteria for cases vary between sets 1 and 2 vs. set 3.

p7, L140

In recent years, OPLL has been reported to have different clinical characteristics depending on the affected region: higher body mass index (BMI), earlier-onset of symptoms, and more diffuse progression of OPLL over the entire spine in the thoracic type of OPLL (T-OPLL) than in the cervical type (C-OPLL) (Endo et al., 2020; Hisada et al., 2022).

The evaluations of the OPLL images were performed at each facility, and it is impossible to trace how many orthopedic surgeons performed the evaluations at each. However, we believe the data are reliable because spine specialists among orthopedic surgeons performed the evaluation.

7. Supplementary Figure 3 – the locus zoom plots do not show which SNPs are imputed and which are genotyped. This should be added to the diagrams.

Following your suggestion, we have modified the locus zoom plots to distinguish between genotyped SNPs and imputed ones. (Supplementary Figure 3-c).

8. Line 461 Decisions around the associated locus of a lead variant is usually set by LD rather than physical distance.

Thank you for the comments. We believe that defining a region by distance rather than LD is a common method since the recent increase in sample size resulted in many significant signals (PMID: 34116867, 31417091, 33272962, 34850884, etc.). However, as you point out, it is important to assess by the LD calculations that each significant locus is independent. We defined regions by physical distance and then confirmed that there are no SNPs outside of each locus in LD (r2 > 0.1) with SNPs that met genome-wide significance levels within the locus.

p26, L620

“We confirmed that there are no SNPs outside each locus in LD (r2 > 0.1) with SNPs that met genome-wide significance levels within the locus.”

9. Line 488 – Gene set enrichment analysis – although this is a reasonable process, either here or elsewhere the authors should provide reference justification for choosing to assess genes based on physical location (within 1Mb of leading SNP plus up to five genes 'closest' to leading SNPs) as there are now notable examples in the literature where the leading SNP signal does not correlate physically to the causative gene, with obesity being a lead example here.

Thank you for your comment. While there are cases that distant genes are responsible for associations (as the reviewer suggested), the closest genes are still one of the best candidates of responsible genes for associations (even in the ABC paper, the closest genes show very good predictability of responsible genes, PMID: 33828297, 31784727). We added references to justify the selection of genes. In addition, we added to the Discussion section possible other responsible genes different from the closest genes.

p28, L665

“Because variants often act on genes that are close in the distance (Fulco et al., 2019; Nasser et al., 2021), we selected genes on a distance basis using the following criteria and used them as input data: genes (i) located within 1 Mb and (ii) the five closest to the leading SNPs of each genome-wide significant locus.”

10. Line 498 – eQTL analysis in 'all available tissues' – the authors need to comment in their discussion on the relevance/appropriateness of the tissues captured in GTEx v8 (noting here bone and/or cartilage and/or ligamentous tissue are not included in GTEx v8).

Thank you for the comments. We agree to mention tissues included in the GTEx. Since this is one of the limitations of this study, we have included the following in the limitation part of the discussion.

p22, L530

“Second, gene expression data in spinal ligament tissue is scarce. Therefore, we were forced to use tissue data different from ligament tissue, such as GETx (GTEx Consortium, 2015), which did not include bone, cartilage, or ligamentous tissue, and data from a mouse Achilles tendon ossification model, which resembles spinal ligament ossification.”

11. Line 503 – unclear why v7 is used here whereas v8 is used above.

We used GRCh37 as our reference genome sequence throughout this study. Therefore, in SMR, we downloaded and used data from GTEx v7, the same build as in this study, instead of v8 (GRCh38). We have added an explanation of the above in the Method section.

12. Line 518ff Genetic correlations were assessed using bivariate LD score regression and Japanese data – it is implied here that this only used Japanese data (which is appropriate) but this should be definitively confirmed.

As you suggested, we modified the manuscript to clearly state that we used only Japanese data.

p31, L738

“We estimated the genetic correlations using a bivariate LD score regression (Bulik-Sullivan et al., 2015) using recently published GWAS results for Japanese: 96 complex traits (Akiyama et al., 2019, 2017; Ishigaki et al., 2020; Kanai et al., 2018).”

13. Lines 528ff for the MR study, the authors used GWAS data from varying ethnic backgrounds, including Japanese and European and east-Asian (presumably Chinese+Japanese here), which varied from trait to trait (e.g European GWAS was used for the BMD analysis, and east Asian for the T2DM analysis). This limits the robustness of this section, as these were not equally valid tools for the MR analysis. In particular, the BMI data were informed from both Japanese and European GWAS data. As the relationship between BMI and OPLL is one of the major findings of this paper, this analysis should be repeated using data ONLY from Japanese BMI GWAS, as a sensitivity analysis.

Thank you for the comments. As suggested, we repeated the analysis using data from Japanese BMI GWAS as a sensitivity analysis. As a result, we could confirm the direction of the effect, although the results were not significant for ALL-OPLL. However, the results were significant for T-OPLL, reinforcing the causality of BMI on T-OPLL (Supplementary table 19).

p16, L356

“Based on the above MR results, we focused on the causal relationship between high BMI, that is obesity, and OPLL. First, we repeated MR using only Japanese BMI data (Akiyama et al., 2017) to estimate causal effects on OPLL as a sensitivity analysis. As a result, we confirmed the positive direction of the effect. Furthermore, the results were significant for TOPLL, reinforcing the causality of BMI on T-OPLL (Supplementary Table 19).”

14. Line 555ff – the authors appropriately assessed their data to ensure no overlap between exposure and outcome datasets – but it is not clear what they then did, having found that there were small overlaps.

The message here is that only the control sample of binary (OPLL) phenotype contains duplicated samples, so the data used for our MR were fine. However, the degree of overlap in the sample was emphasized and did not convey what we originally intended to convey. We have rewritten the method to ensure that our message gets across.

p32, L777

“We checked the cohort data used in our MR and found no overlap with the OPLL case sample, although the control samples used in the OPLL study overlapped with up to 2.2% of samples used in the BMI study and 3.4% in the T2D study.”

15. Considering the PRS of BMI wrt application to OPLL GWAS – the authors appropriately use a Japanese-population GWAS here.

Thank you for your feedback to the PRS of BMI.

16. Line 577 – the reviewer notes in line 582 that having tried out differing r2 and p values they eventually chose r2 of 0.9 tho' P-value=0.6 – this would mean almost any result in the BMI GWAS could be included. From the image Supplementary Figure 20 they could have chosen p=0.05 without much difference in their rho value, and this would seem at least a little more stringent.

Thank you for the comments. Sorry for making you confused.

The horizontal line in the figure represents Spearman’s rho between the BMI and the BMI polygenic risk score in validation data. And there is little change in the value of rho for any p-value selected above 0.05. So, as you pointed out, if we choose p-value = 0.05 and do the PRS scoring for test data, I think it would still be a good predictor. However, to perform a rigorous PRS, we believe it is optimal to select r2 = 0.9 and P-value = 0.6, which had the highest correlation (while the differences are small). Therefore, while we appreciate your feedback, we have not made any changes to the PRS methodology.

Results

1. Line 175FF: have the authors corrected their p-value for significance by this (modest) genomic inflation factor (1.11)?

Thank you for the comments. As you pointed out, the genomic inflation factor indicated mild inflation of statics in the GWAS (λGC = 1.11). Therefore, to assess whether this elevation was due to polygenicity or biases, we conducted LDSC and checked the intercept. The intercept was 1.03, and we found that the inflation was mostly due to polygenicity with little bias in the results. For this reason, we did not correct our results. This was described in the Results as follows.

p8, L177

“The genomic inflation factor (λGC) was 1.11 and showed slight inflation in GWAS; however, the intercept in linkage disequilibrium (LD) score regression (Bulik-Sullivan et al., 2015) was 1.03, indicating that inflation of the statistics was mainly from polygenicity and minimal biases of the association results (Supplementary Figure 2).”

2. Line 209ff: the authors should make an explicit comment on their lack of enrichment in DXA-assessed BMD in adults (e.g. using data from GEFOS2).

As you suggested, we made the explicit comment on the lack of enrichment of association signals in DXA-assessed BMD in adults.

p10, L219

“However, we observed no significant enrichment in BMD in adults measured by dual-energy X-ray absorptiometry in this analysis.”

3. Line 219ff: the authors' decision as to which are and which are not plausible causative genes seems arbitrary [based mainly on previous data for monogenic skeletal dysplasias it would seem]. If only these genes for which there is prior knowledge are considered it somewhat defeats the point of trying to gain new knowledge from hypothesis-free approaches. This continues to be an issue in the discussion too. The authors should describe the known function of other genes too.

Thank you for your very important remarks. We are afraid we confused you about plausible causative genes in the original submission.

We should interpret the associations after detecting association signals. To prioritize genes potentially responsible for associations, there are various ways shown in the previous studies, including gene functions, distance to lead variants, 3D interaction, and so on.

What we did is to prioritize genes as candidates of causal genes based on various information including gene functions previously known. We did not exclude possibility of other genes as candidates of causal genes. In addition, we cannot prioritize genes based on previous knowledge in the regions where there are no surrounding genes related to bone metabolism.

We made these points clear in the revision. We additionally mentioned in the Discussion section the possibility that genes with no reported function related to bone metabolism may be causal genes.

Additionally, there was an error in the previously reported analysis, and the results have changed slightly, and finally, we discovered three candidate genes: EIF3E, EMC2, and TMEM135. As you indicated, we have made descriptions for all genes.

p10, L225

“EIF3E (Eukaryotic translation initiation factor 3 subunit E) encodes a protein that is a component of the eukaryotic translation initiation factor 3 (eIF-3) complex, which functions in and is essential for several steps in the initiation of protein synthesis (Lee et al., 2015; Masutani et al., 2007). A Proteomics study in a rat model of heterotopic ossification reported that Eif3e was upregulated in ossified tissues and may be involved in tissue ossification by regulating hypoxia-inducible factor (HIF) signaling, which has an important role in osteogenesis (Wei et al., 2022). EMC2 (endoplasmic reticulum membrane protein complex subunit 2) encodes a part of the endoplasmic reticulum membrane protein complex (EMC) that functions in the energy-independent insertion of newly synthesized membrane proteins into the endoplasmic reticulum membrane, an essential cellular process (Chitwood et al., 2018; O’Donnell et al., 2020). However, basic experiments evaluating the effects of EMC2 on ligament and bone tissue have not been reported, and the mechanisms involved in OPLL are unknown. On the other hand, this analysis reinforced the possible involvement of TMEM135 in the development of OPLL.”

p18, L429

“Although the effects of EMC2 and RP11-967K21.1 on ligament and bone tissue have not been reported and are unknown, future studies may elucidate the mechanisms and reveal that they are the actual causal genes.”

4. Similarly Line 241ff. Whilst reporting their significant enrichment in the connective/bone cell group, the authors have not mentioned here that they also had significant enrichment for the immune/hematopoietic cell group, with a significant result for skeletal muscle which did not survive after FDR adjustment. These other cell groups are highly relevant to the phenotype and should be mentioned here similarly.

Thank you for your very important remarks.

As you suggested, we additionally mentioned the significant enrichment for the immune/hematopoietic cell group. As for the skeletal muscle cell group, we did not discuss it here because it was suggestive but not significant (P=0.059).

p11, L254

“We conducted partitioning heritability enrichment analyses to investigate cell groups related to OPLL. We observed significant enrichment in the active enhancers of the connective/bone cell group and the immune/hematopoietic cell group (Supplementary Table 9). We then analyzed each cell type belonging to these groups and found significant enrichment of H3K27ac in chondrogenic differentiation cells (Supplementary Table 10). These results concord with previous findings that in OPLL chondrocyte differentiation in the endochondral ossification process occurs (Sugita et al., 2013) and provide new insights into the involvement of immune system cells in OPLL development, which has received little attention to date.”

5. The authors' choice for co-heritability studies is limited. The authors have not considered GWAS for AS, for example, which may be highly relevant. The authors should consider an unbiased coheritability analysis rather than only the 'usual suspects' – as the latter will only really confirm prior thoughts and not illustrate novel pathways/mechanisms (for example see the recent paper on IBS).

Thank you for your comment. As noted above, since we analyzed all the representative Japanese traits in an unbiased manner for which GWAS was performed, we believe that there is little bias.

On the other hand, the fact that we analyzed only some of the numerous traits that exist in the world is a limitation of this study, and we have added this point in the Discussion section. In fact, there are no GWAS of AS in Japanese.

However, as you pointed out, adding an AS analysis would be nice. We took the data from Ellinghaus et al. 2016 and compared the SNP effect sizes with those in our OPLL GWAS, assuming fixed effects across populations. Please note that we could not perform GC analysis using LDSC due to ethnical differences. As a result, no significant results were observed (Figure 1—figure supplement 17).

6. Supp Figure 5: the calling of eight new loci for T-OPLL is over-enthusiastic. There is very little genetic support for ZBTB40, for example (see Locuszoom plot in Supplementary Figure 8), and it's not clear whether this is a genotyped or imputed SNP (not shown in Supplementary table 11). Similar comments are made about the alleged novel loci in plots c, e, f, g, and h. The only believable putative novel loci are shown in plots b and d. The authors should tone down their claims about discrete novel loci for T-OPLL substantially, therefore, throughout the manuscript (including abstract, results, and discussion). Related to this, the authors should reconsider rewriting sections where they feature T-OPLL. In discussing these possible site-specific T-OPLL GWAS results, the authors do not avail themselves of the opportunity to discuss the two plausible loci but only discuss ZBTB40. What is known about genes within the two more plausible loci?

We think this is the same point as the one you raised earlier. As you suggested, the claims about discrete novel loci for T-OPLL are substantially toned down throughout the manuscript. The sections where we featured T-OPLL are rewritten.

7. Line 265ff the authors should flag at first mention here and in the methods (at line 520) that there is a supplementary table listing the complex traits considered here, especially as this is limited (appropriately) to previous genetic studies in Japanese populations (as per the methods). Although the authors' approach here is appropriate (i.e., limited to the Japanese population), the point is that these GWAS represent only a subset of the many traits mapped by GWAS internationally [this is given later in the paragraph but should be flagged earlier for the reader].

Thank you very much for the important comments. As you suggested, we flagged at first mention here and in the methods that there is a supplementary table listing the complex traits considered.

p14, L306

“We investigated their relationship with OPLL using the GWAS data. We first calculated the genetic correlation between OPLL and 96 complex traits (mean number of around 130K) (Akiyama et al., 2019, 2017; Ishigaki et al., 2020; Kanai et al., 2018) (see Supplementary Table 13 for the traits analyzed).”

p31, L738

“We estimated the genetic correlations using a bivariate LD score regression (Bulik-Sullivan et al., 2015) using only recently published GWAS results for Japanese: 96 complex traits (Akiyama et al., 2019, 2017; Ishigaki et al., 2020; Kanai et al., 2018) (see Supplementary Table 13 for the traits analyzed).”

8. Line 271: ossification and bone mineral density accrual are quite different processes. In particular, BMD is likely to be artefactually elevated by the presence of OPLL, if this affects lower spinal areas, as it is also in AS, DISH, etc. The authors need to provide more clarity, nuance, and detail here.

Thank you very much for the important comments. We agree to add a description for the relationship between ossification and BMD and for the potential artifact in the measurement of BMD. We have provided a more detailed explanation of why we focus on the link between BMD and OPLL.

p14, L316

“The result of genetic correlation analysis for osteoporosis barely did not reach the false discovery rate (FDR)-corrected significance level, but we included it in the MR evaluation because there have been several previous reports of a strong trend toward whole-body ossification in OPLL patients (Hukuda et al., 1983; Mori et al., 2016; Nishimura et al., 2018; Yoshii et al., 2019). In the analysis, we used BMD, the main diagnostic criteria item for osteoporosis. BMD in the spine may reflect artifacts from OPLL itself, but higher BMD was also reported in patients with OPLL in the femur and the radius, a non-weight-bearing bone (Sohn and Chung, 2013; Yamauchi et al., 1999).”

9. The results would benefit from editorial comments being removed from the results and placed in the discussion (e.g. lines 269-271).

This content was already mentioned in the discussion and was removed because it would have been redundant. This part of the description has been removed.

10. Line 316ff PRS scores – these β values may be significant but they are small. Can the authors contextualize their results with, say, the PRS for BMI and T2D?

Thank you very much for your comment. As you suggested, we have compared the effect size of BMI PRS on T2D, for which BMI is known to be one major cause, with that on OPLL.

We generated PRS as the sum of risk alleles weighted by the log odds ratio. However, at the time of the last submission, the sum (PRS) was not scaled and we used the raw data for subsequent analysis. In this way, the magnitude of the β values is not directly interpretable. Then, after standardizing the PRS, we reran our subsequent analysis. The results are the same as before except for the y-axis values (Figure 5). Now the β of 1 SD of BMI is over 0.3, equivalent to OR of 1.35, which is a substantial increase in risk.

Next, we conducted BMI PRS scoring for the T2D cases and controls, resulting in a positive effect size of BMI PRS on T2D (β = 0.099, 95% CI: 0.087- 0.110). This T2D data set overlaps almost completely with the data from the discovery phase of the BMI PRS, then it carries a high risk of statistical inflation due to model overfitting. However, since no other data was available for T2D, the comparison was made in this manner, knowing the above points.

Comparing this result with that of OPLL, we found that the effect of BMI PRS on OPLL was higher than T2D, so we have added the following in our revised manuscript.

p17, L386

“Further, the effect sizes of BMI PRS on OPLL were all larger than that on T2D analyzed in a similar manner (Method) (β = 0.099, 95% CI: 0.087- 0.110), indicating that high BMI is a major cause of OPLL.”

p34, L822

“To compare the effect size of BMI PRS in OPLL with T2D, for which BMI is known to be one of the major causes, we performed the same BMI PRS scoring on the T2D data set (39,758 cases and 111,487 controls). Unfortunately, the T2D data set overlaps almost entirely with the data from the discovery phase of the BMI PRS, which carries a high risk of statistical inflation due to model overfitting. However, since no other data was available for T2D, the comparison was made in this manner, knowing the above points.”

11. The authors have attempted to split their data by clinical phenotype (cervical vs. thoracic OPLL); the data supporting multiple novel loci for T-OPLL do not appear robust from the locuszoom plots and the authors are encouraged to tone down this component substantially (for example, focusing on ZBTB40 as a locus for T-OPLL appears implausible from the Locuszoom plot (one is left with an impression that there was some prior hypothesis contribution to this point [e.g., it being a known BMD locus]) whereas other much more plausible loci (based on the Locuszoom images) do not receive similar attention).

Thank you for your comment. As you pointed out earlier, we have toned down the description for signals found in the OPLL subtype.

Discussion

Their discussion is inadequate; and needs much more care and non-biased interpretation, and detailing of the [many] limitations. Also, there is an obvious clinical question, that they haven't posed: has weight loss been trialled as a therapeutic approach to mxmt of OPLL?

Thank you very much for your detailed advice. We have taken your advice and modified the Discussion section.

1. The authors' functional assessment in their first paragraph on bone formation needs toning down. Certainly, the authors' results are enriched for signals in bone metabolism pathways – but they don't know that these are necessarily anabolic, or anti-catabolic; and line 324ff bone formation and resorption are normally tightly coupled processes so it would be unusual for these to be uncoupled in OPLL uniquely. Moreover, the authors have mainly featured those genes that suit their argument; and have not commented, for example, that their gene enrichment analyses also identified immune/haematopoietic cell groups. Allowing for the time being their comment to stand: is there any evidence that bisphosphonates (that suppress both bone formation and bone resorption) improve outcomes with OPLL?

As you suggested, we have toned down the functional assessment in the first paragraph on bone formation. Further, a new paragraph was added to the discussion regarding the possible involvement of immune/hematopoietic cells, as discovered by partitioning heritability enrichment analyses. Regarding your last question, one randomized controlled trial evaluated the prognosis of OPLL with a bisphosphonate, but this study did not show significant results (Yonenobu et al., 2006). We added to the manuscript a sentence that further study is needed to determine whether existing drugs such as bisphosphonates are effective or whether new drugs need to be developed.

p22, L513

“Although this study identified that OPLL is closely linked to bone metabolism, there are few studies examining the prognosis of OPLL with the use of bone-modifying agents such as bisphosphonates, which suppress both bone formation and resorption. A randomized controlled trial evaluated the effect of etidronate disodium on postoperative OPLL progression in patients with OPLL who had undergone posterior decompression surgery, but no significant effect was demonstrated (Yonenobu et al., 2006). Future studies are needed to determine whether existing agents are adequate or whether we need to develop new agents.”

2. The relationship between EB and osteoporosis needs far more nuance if the authors are to include it in their argument regarding PLEC: it is thought to be multifactorial and related more to nutrition, drugs, mobility, etc, and there is not, to my knowledge, a known underlying mechanistic link directly related to the mutation and bone per se.

As you describe, bone density has been reported to decrease in patients with EB due to various effects: reduced mobility, compromised nutritional intake by oral and gastrointestinal tract complications, low 25(OH) vitamin D levels caused by reduced ultraviolet rays access to the skin, and increased osteoclastic activity by inflammatory cytokines (PMID: 30118182). On the other hand, the underlying biological mechanism by which PLEC mutations affect bone metabolism is not clear. We have added these descriptions.

p18, L426

“The PLEC mutation causes epidermolysis bullosa, in which osteoporosis is one of the main comorbidities. Although various causes have been reported to induce osteoporosis in this disease (Chen et al., 2019), the underlying biological mechanism by which PLEC mutations affect bone metabolism is unclear, and future studies are expected to elucidate this mechanism.”

3. The benefits of considering this approach as novel knowledge-generating have been somewhat lost by the authors only focusing on bone in their discussion, and as they mostly do not mention information about previously reported loci it's hard to contextualise their newer findings with older knowledge regarding bone pathways vs. other pathways in terms of OPLL overall.

As you suggested, we have added a discussion of the previously reported loci.

p18, L411

“Although many unknowns exist regarding the function of the six regions found in the past, functional analysis of chromosome 8 (q23.1), where RSPO2 is located, has progressed. rs374810, the most significant variant in the present and the past study, is located on the promoter region of RSPO2 in chondrocytes. Its risk allele (C allele) causes a loss of transcription factor C/EBPβ binding; therefore, RSPO2 expression is reduced. Finally, the Wnt-β-catenin signal that blocks chondrocyte differentiation of ligament MSCs is suppressed, which triggers OPLL generation (Nakajima et al., 2016).”

As we responded to the previous comments, we did not restrict candidates of responsible genes to genes related to bone metabolism. What we did is to try to interpret the association signals by various information including gene functions. We did not exclude the possibility of other genes as responsible genes. We made this point clear in the revised manuscript.

p18, L429

“Although the effects of EMC2 and RP11-967K21.1 on ligament and bone tissue have not been reported and are unknown, future studies may elucidate the mechanisms and reveal that they are the actual causal genes.”

Also, as noted above, we have added a paragraph discussing the involvement of tissues other than bone.

p19, L435

“Partitioning heritability enrichment analyses by LD score regression identified that OPLL GWAS signals enrich not only the active enhancers of the connective/bone cell group but also those of the immune/hematopoietic cell group. It is well known that heterotopic ossification of ligaments and tendons, in which mesenchymal stem cells differentiate into osteochondrogenic cells rather than myocytes or tenocytes, is triggered by tissue damage due to trauma (Convente et al., 2018; Torossian et al., 2017). Tissue injury triggers a systematic inflammatory response with the mobilization of neutrophils, monocytes, and lymphocytes at various stages of inflammation. Monocytes/macrophages are involved in abnormal wound healing and influence the development of heterotopic ossification (Sorkin et al., 2020). This fact suggests that immune system cells are involved in the tissue repair process of the posterior longitudinal ligament tissue of the spine, which is the host that causes ossification in OPLL as well. In addition, gene expression analysis using scRNAseq data confirmed that the candidate genes discovered in this study were expressed not only in mesenchymal cells but also in immune cells.”

4. Lines 340ff – here the authors should be careful not to conflate BMD with ossification processes, and this section requires more nuance. The relationship between obesity and BMD is extremely contentious, and only referring to Lv et al. is a very simplistic reflection of the literature. (most of this paragraph really discusses the relationship between BMI and BMD, and not, as is pertinent here, BMD and OPLL, so it should be revised to focus on the newer loci presented here).

Thank you very much for your advice. This is very similar to the previous comments by the reviewer. As we responded to the comments above (Reply 5 for the Result section), for heterotopic ossification, there was no GWAS of AS in Japanese. Therefore, we took AS in the European populations and compared the effect sizes between OPLL and AS.

5. The authors have missed an opportunity to consider a relationship between OPLL and other ossifying processes, such as ankylosing spondylitis and heterotopic ossification. Whilst these may not have had GWAS performed in Japanese populations the authors have not always had Japanese population data for those studies that they have included (e.g., BMD).

Thank you very much for your advice. We think this is a point you pointed out earlier (advice 10 for Results). We cannot directly interpret the β coefficients since we did not normalize the PRS. In the revised manuscript, we showed that 1 SD of BMI increased the risk of OPLL with OR of 1.35. We also conducted BMI PRS scoring for the T2D data set and compared this result with that of OPLL, and the effect of BMI PRS on OPLL was higher than that of T2D, indicating that BMI has a substantial effect on OPLL.

6. The PRS suggests that there is a genetic relationship between BMI and OPLL, with BMI driving OPLL. However, the β suggests the clinical impact is extremely small. Contextualising their results with other PRS would help the reader understand the clinical impact of their findings.

Thank you very much for your advice. We think this is a point you pointed out earlier (advice 10 for Results). We cannot directly interpret the β coefficients since we did not normalize the PRS. In the revised manuscript, we showed that 1 SD of BMI increased the risk of OPLL with OR of 1.35. We also conducted BMI PRS scoring for the T2D data set and compared this result with that of OPLL, and the effect of BMI PRS on OPLL was higher than that of T2D, indicating that BMI has a substantial effect on OPLL.

7. The authors do not discuss the strengths and weaknesses of their paper, which would add sobriety to their discussion.

Thank you very much for your advice. We have emphasized only the strengths of our research and have not discussed the weaknesses (limitations) enough. We have added a paragraph to the Discussion section that discusses the limitations of this study.

8. Paradoxically, the authors focus a lot on talking about novel treatments, etc but by only looking at previously known pathways they've limited the ability to look at these. Also, the most obvious way to manage high BMI would be weight loss. Not sure this really represents a novel treatment for OPLL, as such.

As you pointed out, we did not consider enough pathways other than obesity and bone metabolism. In addition to obesity and bone metabolism, we have added to the manuscript a discussion on the involvement of the immune system in OPLL, as noted above.

We believe that the suppressive effect of weight loss on OPLL should be examined in future prospective studies.

p22, L519

“Regarding obesity, the cause of OPLL, weight loss guidance, and aggressive bariatric treatment, including surgery, for some patients may be considered. Long-term prospective studies are needed to evaluate the effect of weight loss on OPLL suppression.”

9. The authors have also not contextualized their results in light of previous data. For example, here they have shown heritability of OPLL of >50%. Have there been any previous studies of heritability?

This study is the first study on the heritability of OPLL. Since demonstrating high heritability is an important finding of this study, we have included the following in the Discussion section. As we responded to the other comments, such as Comment 8 in Discussion, we put additional descriptions in the context of previous results and data in the revised manuscript.

p22, L508

“This study demonstrates that OPLL is a highly heritable disease. Although previous clinical studies have suggested that OPLL is heritable, there have been no studies that have mentioned the heritability of OPLL. This study is the first to clarify the high heritability of OPLL quantitatively. Further elucidation of the pathogenesis of OPLL from a genetic approach is expected.”

https://doi.org/10.7554/eLife.86514.sa2

Article and author information

Author details

  1. Yoshinao Koike

    1. Laboratory for Bone and Joint Diseases, Center for Integrative Medical Sciences, RIKEN, Tokyo, Japan
    2. Laboratory for Statistical and Translational Genetics, Center for Integrative Medical Sciences, RIKEN, Yokohama, Japan
    3. Department of Orthopedic Surgery, Hokkaido University Graduate School of Medicine, Sapporo, Japan
    Contribution
    Conceptualization, Resources, Formal analysis, Funding acquisition, Visualization, Methodology, Writing - original draft, Project administration, Writing – review and editing
    Contributed equally with
    Masahiko Takahata and Masahiro Nakajima
    Competing interests
    No competing interests declared
    ORCID icon "This ORCID iD identifies the author of this article:" 0000-0002-5431-5572
  2. Masahiko Takahata

    Department of Orthopedic Surgery, Hokkaido University Graduate School of Medicine, Sapporo, Japan
    Contribution
    Conceptualization, Resources, Formal analysis, Funding acquisition, Visualization, Writing - original draft, Project administration, Writing – review and editing
    Contributed equally with
    Yoshinao Koike and Masahiro Nakajima
    For correspondence
    takamasa@med.hokudai.ac.jp
    Competing interests
    No competing interests declared
  3. Masahiro Nakajima

    Laboratory for Bone and Joint Diseases, Center for Integrative Medical Sciences, RIKEN, Tokyo, Japan
    Contribution
    Conceptualization, Resources, Formal analysis, Funding acquisition, Writing - original draft, Project administration, Writing – review and editing
    Contributed equally with
    Yoshinao Koike and Masahiko Takahata
    Competing interests
    No competing interests declared
  4. Nao Otomo

    1. Laboratory for Bone and Joint Diseases, Center for Integrative Medical Sciences, RIKEN, Tokyo, Japan
    2. Laboratory for Statistical and Translational Genetics, Center for Integrative Medical Sciences, RIKEN, Yokohama, Japan
    3. Department of Orthopedic Surgery, Keio University School of Medicine, Nagoya, Japan
    Contribution
    Formal analysis, Writing - original draft
    Competing interests
    No competing interests declared
  5. Hiroyuki Suetsugu

    1. Laboratory for Bone and Joint Diseases, Center for Integrative Medical Sciences, RIKEN, Tokyo, Japan
    2. Laboratory for Statistical and Translational Genetics, Center for Integrative Medical Sciences, RIKEN, Yokohama, Japan
    3. Department of Orthopaedic Surgery, Graduate School of Medical Sciences, Kyushu University, Fukuoka, Japan
    Contribution
    Formal analysis
    Competing interests
    No competing interests declared
  6. Xiaoxi Liu

    Laboratory for Statistical and Translational Genetics, Center for Integrative Medical Sciences, RIKEN, Yokohama, Japan
    Contribution
    Formal analysis
    Competing interests
    No competing interests declared
  7. Tsutomu Endo

    Department of Orthopedic Surgery, Hokkaido University Graduate School of Medicine, Sapporo, Japan
    Contribution
    Resources, Formal analysis, Funding acquisition
    Competing interests
    No competing interests declared
  8. Shiro Imagama

    Department of Orthopedics, Nagoya University Graduate School of Medicine, Nagoya, Japan
    Contribution
    Resources, Funding acquisition
    Competing interests
    No competing interests declared
  9. Kazuyoshi Kobayashi

    Department of Orthopedics, Nagoya University Graduate School of Medicine, Nagoya, Japan
    Contribution
    Resources
    Competing interests
    No competing interests declared
  10. Takashi Kaito

    Department of Orthopaedic Surgery, Osaka University Graduate School of Medicine, Suita, Japan
    Contribution
    Resources
    Competing interests
    No competing interests declared
  11. Satoshi Kato

    Department of Orthopaedic Surgery, Graduate School of Medical Science, Kanazawa University, Kanazawa, Japan
    Contribution
    Resources
    Competing interests
    No competing interests declared
  12. Yoshiharu Kawaguchi

    Department of Orthopaedic Surgery, Toyama University, Toyama, Japan
    Contribution
    Resources
    Competing interests
    Consulting fees from Medacta International
  13. Masahiro Kanayama

    Department of Orthopedics, Hakodate Central General Hospital, Hakodate, Japan
    Contribution
    Resources
    Competing interests
    No competing interests declared
  14. Hiroaki Sakai

    Department of Orthopaedic Surgery, Spinal Injuries Center, Iizuka, Japan
    Contribution
    Resources
    Competing interests
    No competing interests declared
  15. Takashi Tsuji

    1. Department of Orthopedic Surgery, Keio University School of Medicine, Nagoya, Japan
    2. Department of Spine and Spinal Cord Surgery, Fujita Health University, Toyoake, Japan
    Contribution
    Resources
    Competing interests
    No competing interests declared
  16. Takeshi Miyamoto

    1. Department of Orthopedic Surgery, Keio University School of Medicine, Nagoya, Japan
    2. Department of Orthopedic Surgery, Kumamoto University, Kumamoto, Japan
    Contribution
    Resources
    Competing interests
    No competing interests declared
  17. Hiroyuki Inose

    Department of Orthopaedic Surgery, Tokyo Medical and Dental University, Tokyo, Japan
    Contribution
    Resources
    Competing interests
    No competing interests declared
    ORCID icon "This ORCID iD identifies the author of this article:" 0000-0003-4195-2545
  18. Toshitaka Yoshii

    Department of Orthopaedic Surgery, Tokyo Medical and Dental University, Tokyo, Japan
    Contribution
    Resources
    Competing interests
    No competing interests declared
  19. Masafumi Kashii

    Department of Orthopaedic Surgery, Osaka University Graduate School of Medicine, Suita, Japan
    Contribution
    Resources
    Competing interests
    No competing interests declared
  20. Hiroaki Nakashima

    Department of Orthopedics, Nagoya University Graduate School of Medicine, Nagoya, Japan
    Contribution
    Resources
    Competing interests
    No competing interests declared
  21. Kei Ando

    Department of Orthopedics, Nagoya University Graduate School of Medicine, Nagoya, Japan
    Contribution
    Resources
    Competing interests
    No competing interests declared
  22. Yuki Taniguchi

    Department of Orthopaedic Surgery, Faculty of Medicine, The University of Tokyo, Tokyo, Japan
    Contribution
    Resources
    Competing interests
    No competing interests declared
    ORCID icon "This ORCID iD identifies the author of this article:" 0000-0002-2329-123X
  23. Kazuhiro Takeuchi

    Department of Orthopaedic Surgery, National Okayama Medical Center, Okayama, Japan
    Contribution
    Resources
    Competing interests
    No competing interests declared
  24. Shuji Ito

    1. Laboratory for Statistical and Translational Genetics, Center for Integrative Medical Sciences, RIKEN, Yokohama, Japan
    2. Department of Orthopedic Surgery, Shimane University Faculty of Medicine, Izumo, Japan
    Contribution
    Resources, Formal analysis
    Competing interests
    No competing interests declared
  25. Kohei Tomizuka

    Laboratory for Statistical and Translational Genetics, Center for Integrative Medical Sciences, RIKEN, Yokohama, Japan
    Contribution
    Formal analysis
    Competing interests
    No competing interests declared
  26. Keiko Hikino

    Laboratory for Pharmacogenomics, Center for Integrative Medical Sciences, RIKEN, Yokohama, Japan
    Contribution
    Formal analysis
    Competing interests
    No competing interests declared
  27. Yusuke Iwasaki

    Laboratory for Genotyping Development, Center for Integrative Medical Sciences, RIKEN, Yokohama, Japan
    Contribution
    Data curation
    Competing interests
    No competing interests declared
  28. Yoichiro Kamatani

    Laboratory for Statistical Analysis, Center for Integrative Medical Sciences, RIKEN, Yokohama, Japan
    Contribution
    Supervision
    Competing interests
    No competing interests declared
  29. Shingo Maeda

    Department of Bone and Joint Medicine, Graduate School of Medical and Dental Sciences, Kagoshima University, Kagoshima, Japan
    Contribution
    Resources
    Competing interests
    No competing interests declared
  30. Hideaki Nakajima

    Department of Orthopaedics and Rehabilitation Medicine, Faculty of Medical Sciences, University of Fukui, Fukui, Japan
    Contribution
    Resources
    Competing interests
    No competing interests declared
  31. Kanji Mori

    Department of Orthopaedic Surgery, Shiga University of Medical Science, Otsu, Japan
    Contribution
    Resources
    Competing interests
    No competing interests declared
  32. Atsushi Seichi

    Department of Orthopedics, Jichi Medical University, Shimotsuke, Japan
    Contribution
    Resources
    Competing interests
    No competing interests declared
  33. Shunsuke Fujibayashi

    Department of Orthopaedic Surgery, Graduate School of Medicine, Kyoto University, Kyoto, Japan
    Contribution
    Resources
    Competing interests
    No competing interests declared
  34. Tsukasa Kanchiku

    Department of Orthopedic Surgery, Yamaguchi University Graduate School of Medicine, Ube, Japan
    Contribution
    Resources
    Competing interests
    No competing interests declared
  35. Kei Watanabe

    Department of Orthopaedic Surgery, Niigata University Medical and Dental General Hospital, Nankoku, Japan
    Contribution
    Resources
    Competing interests
    No competing interests declared
  36. Toshihiro Tanaka

    Department of Orthopaedic Surgery, Hirosaki University Graduate School of Medicine, Hirosaki, Japan
    Contribution
    Resources
    Competing interests
    No competing interests declared
  37. Kazunobu Kida

    Department of Orthopaedic Surgery, Kochi Medical School, Nankoku, Japan
    Contribution
    Resources
    Competing interests
    No competing interests declared
  38. Sho Kobayashi

    Department of Orthopaedic Surgery, Hamamatsu University School of Medicine, Hamamatsu, Japan
    Contribution
    Resources
    Competing int