Target-specific membrane potential dynamics of neocortical projection neurons during goal-directed behavior
- École Polytechnique Fédérale de Lausanne (EPFL), Switzerland
- Research Institute of Environmental Medicine, Nagoya University, Japan
Figures
Figure 1 with 4 supplements

Target-specific Vm dynamics in S1 projection neurons during task performance.
(A) Top, the experimental setup. Bottom, a representative two-photon image of a CTB-labeled M1-p neuron (green) with a recording pipette (red). (B) Detection task trial structure (FA: false alarm, CR: correct rejection). (C) Behavioral performance during whole-cell recordings (HR: hit rates, FAR: false alarm rates, GP: ‘Good performer’, N: ‘Naive’). (D, E) Left, grand average changes in Vm (thick line: mean, thin lines: ± sem) and action potential (AP) firing rate for hit trials recorded from S2-p neurons (red) and M1-p neurons (blue) in ‘Good performer’ (D) and ‘Naive’ (E) mice (Arrow: 1 ms stimulation of the C2 whisker). A box plot indicates reaction time (1st lick). Right, box plots for postsynaptic potential (PSP) amplitude, secondary late Vm depolarization quantified at 0.05–0.25 s, Vm depolarization during the lick period (at 0.25–1.0 s), and evoked AP rates at early (0–0.05 s), late (0.05–0.25 s) and lick (0.25–1.0 s) periods.
-
Figure 1—source data 1
Data values and statistics underlying Figure 1.
- https://doi.org/10.7554/eLife.15798.004
-
Figure 1—source data 2
Data values and statistics underlying Figure 1—figure supplement 3.
- https://doi.org/10.7554/eLife.15798.005
-
Figure 1—source data 3
Data values and statistics underlying Figure 1—figure supplement 4.
- https://doi.org/10.7554/eLife.15798.006
Figure 1—figure supplement 1
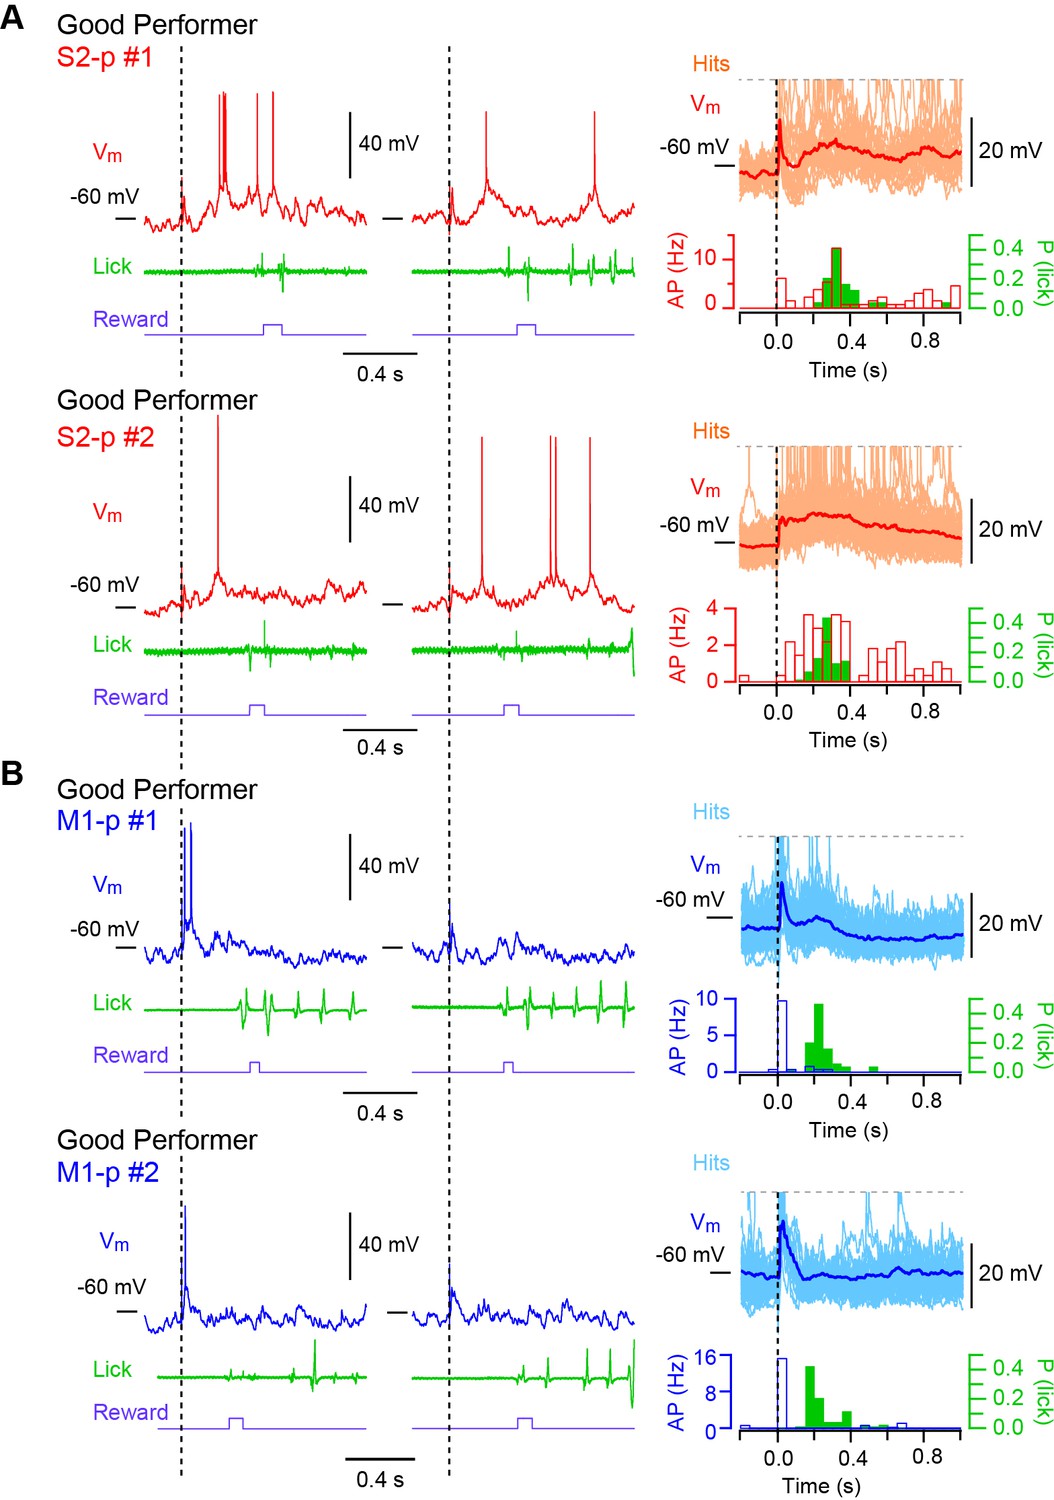
Hit Vm traces from S1 projection neurons in ‘Good performer’ mice.
(A) Left and middle, example Vm traces obtained from two individual S2-p neurons on two representative hit trials. Right, the averaged subthreshold Vm trace is superimposed with individual traces. APs are truncated. PSTHs for corresponding AP rates and the distribution of the first lick timings are also shown. (B) Same as A, but for M1-p neurons.
Figure 1—figure supplement 2
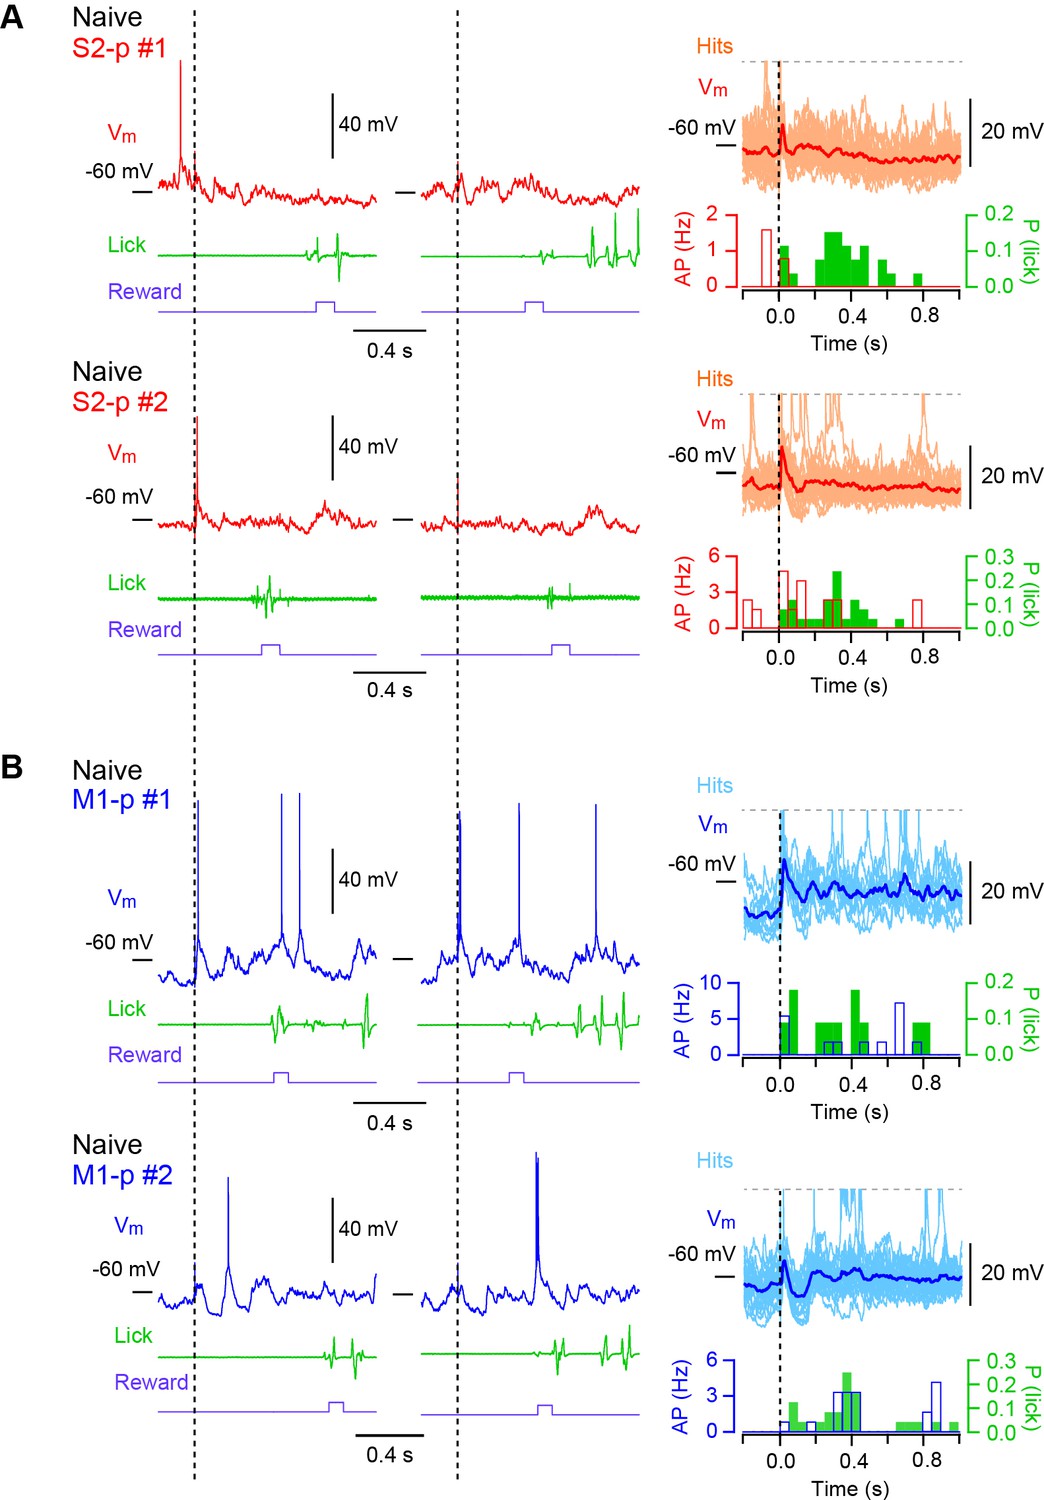
Hit Vm traces from S1 projection neurons in ‘Naive’ mice.
(A) Left and middle, example Vm traces obtained from two individual S2-p neurons on two representative hit trials. Right, the averaged subthreshold Vm trace is superimposed with individual traces. APs are truncated. PSTHs for corresponding AP rates and the distribution of the first lick timings are also shown. (B) Same as A, but for M1-p neurons.
Figure 1—figure supplement 3
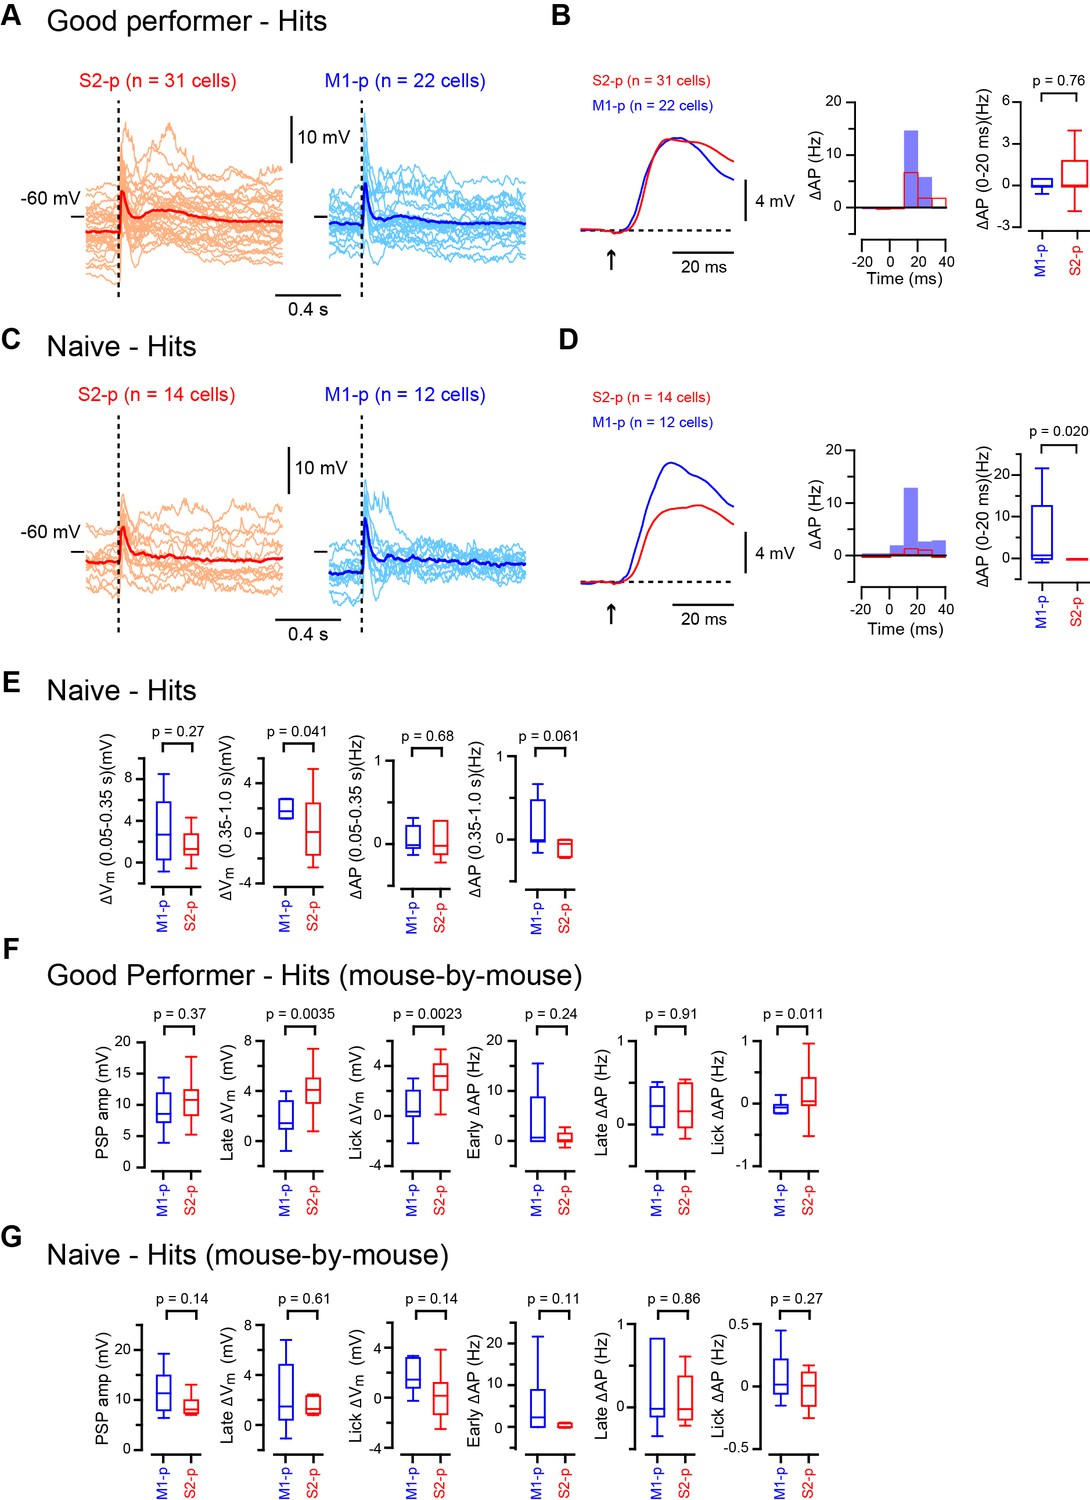
Average hit Vm traces and PSTHs.
(A) Average hit Vm traces obtained from individual cells (thin lines) from S2-p (left) and M1-p (right) neurons of ‘Good performer’ mice. The grand average Vm traces (thick lines) are superimposed. The dotted line indicates the stimulus onset. (B) Left, grand average of subthreshold responses from S2-p (red) and M1-p (blue) neurons are shown at high temporal resolution (superimposed with the baseline Vm subtracted). An arrow indicates the onset of whisker stimulation. Middle, grand average PSTHs at high temporal resolution with the baseline AP rates subtracted. Time 0 is the onset of whisker stimulation. Right, quantification of evoked AP rate at initial 20 ms after whisker deflection. (C and D) Same as A and B, but for ‘Naive’ mice. (E) Quantification of △Vm and △AP rate at 0.05 – 0.35 s and 0.35 – 1.0 s on hit trials in ‘Naive’ mice. (F) PSP amplitude, Vm depolarization at the late (0.05–0.25 s) and lick (0.25 – 1.0 s) periods and evoked AP rates at early (0 – 0.05 s), late (0.05 – 0.25 s) and lick (0.25 – 1.0 s) periods were analyzed on a mouse-by-mouse basis for ‘Good performer’ mice (n = 9 mice for M1-p neurons; n = 17 mice for S2-p neurons). (G) Same as F, but for ‘Naive’ mice (n = 6 mice for M1-p neurons; n = 9 mice for S2-p neurons).
Figure 1—figure supplement 4
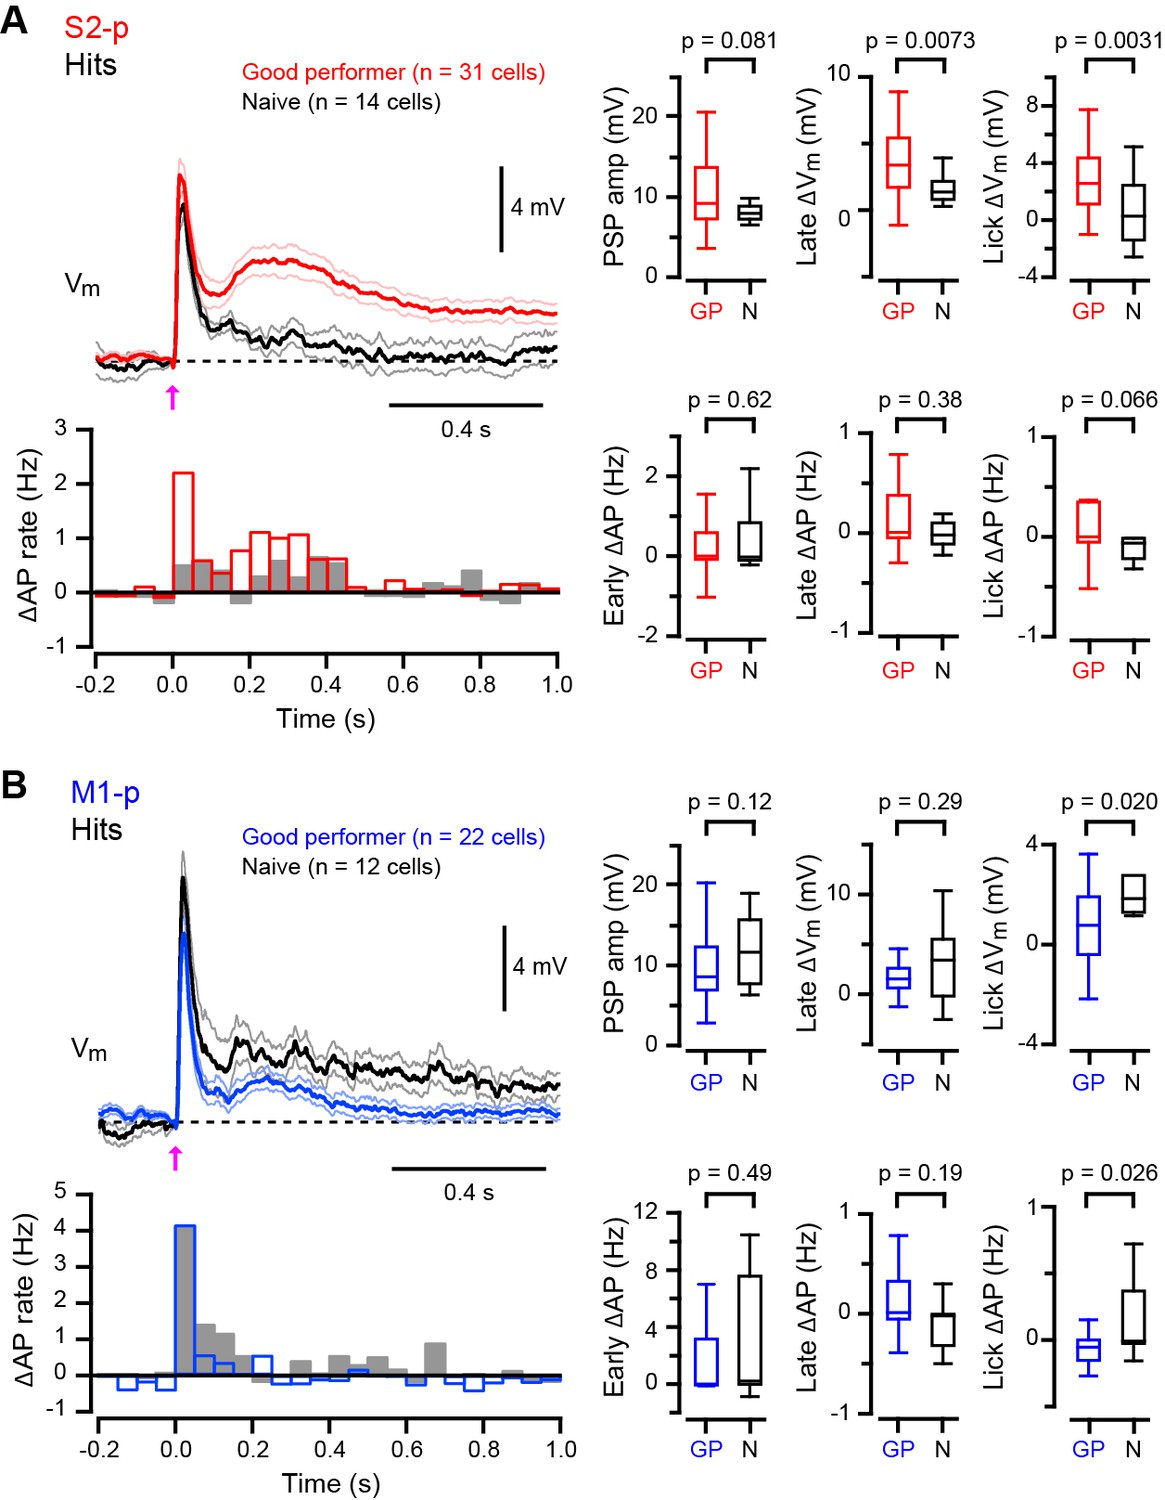
Target-specific changes of hit responses with task learning.
(A and B) Left, grand average changes in Vm (thick line: mean, thin lines: ± sem) and AP rate for hit trials recorded from S2-p neurons (A) and M1-p neurons (B) in ‘Good performer’ (colored) and ‘Naive’ (black) mice (Arrow: 1 ms stimulation of the C2 whisker). Right, box plots for PSP amplitude, Vm depolarization at the late (0.05–0.25 s) and lick (0.25 – 1.0 s) periods and evoked AP rates at early (0 – 0.05 s), late (0.05 – 0.25 s) and lick (0.25 – 1.0 s) periods.
Figure 2 with 2 supplements
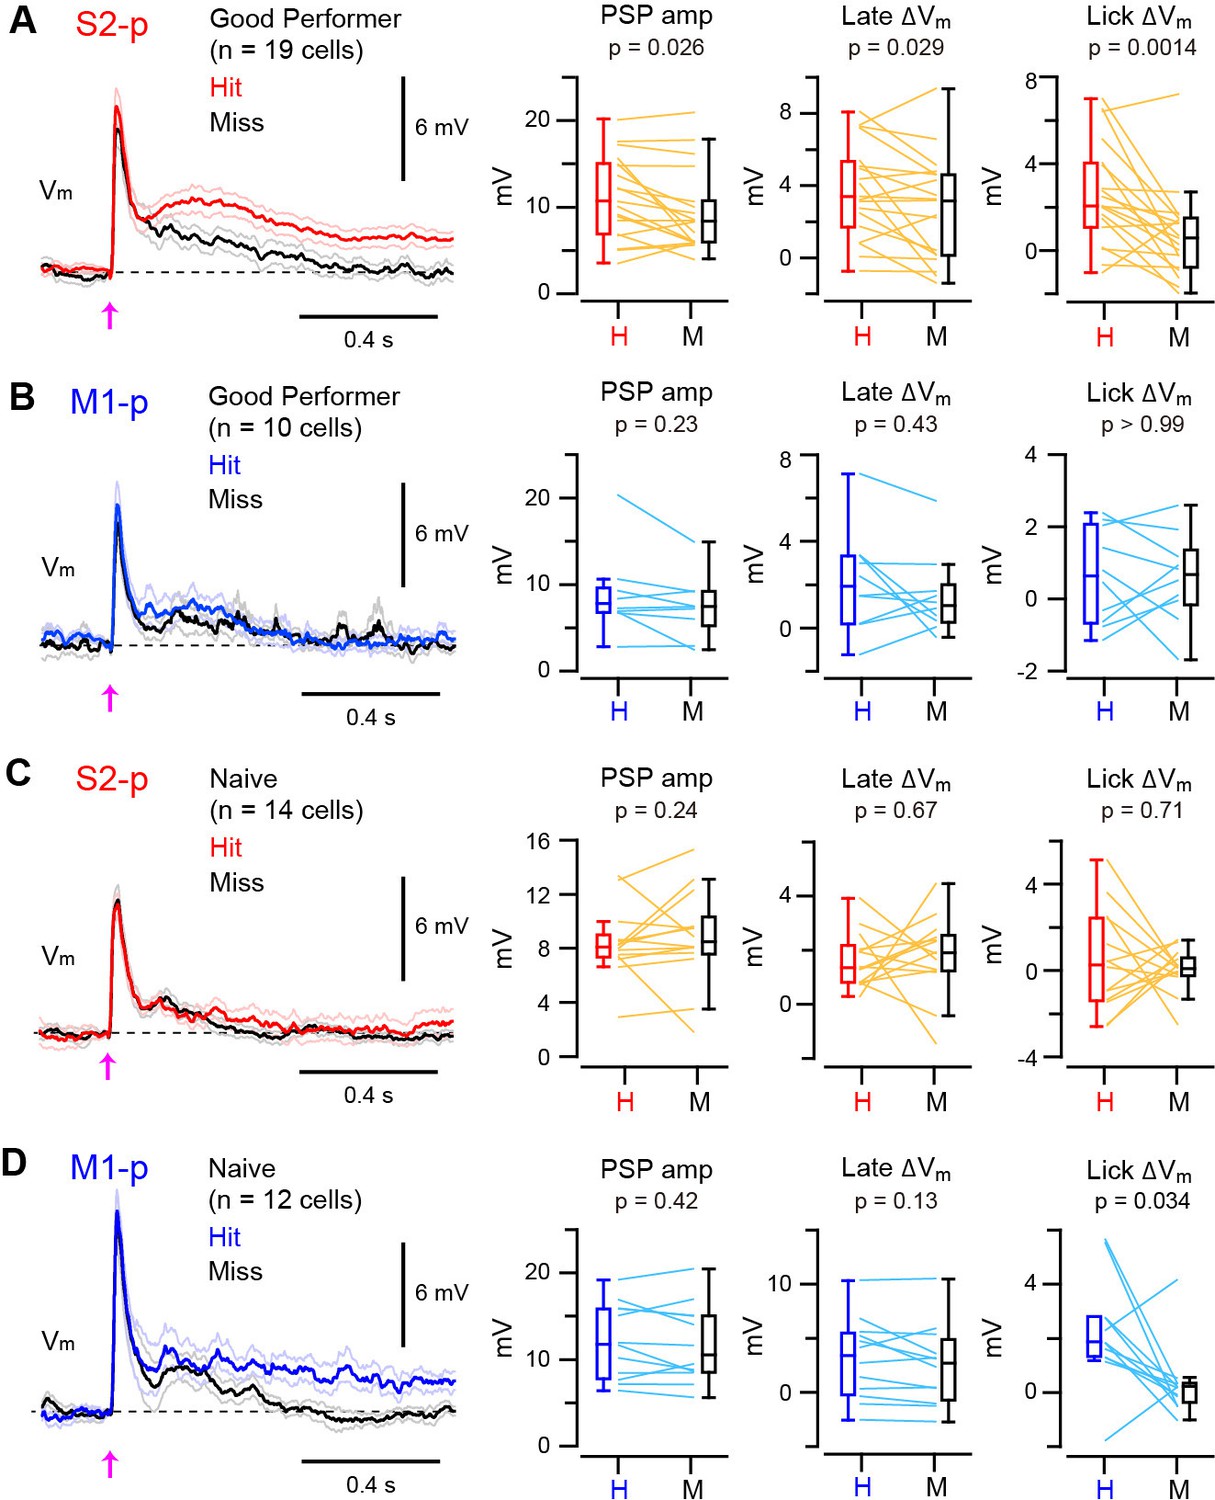
Target-specific Vm correlation with task execution.
(A) Left, grand average Vm traces (thick line: mean, thin lines: ± sem) of S2-p neurons during hit (red) and miss (black) trials for ‘Good performer’ mice. Right, data for each cell (thin lines) and box plots for PSP amplitude and Vm depolarization at the late (0.05–0.25 s) and lick periods (0.25–1.0 s) on hit (H) and miss (M) trials. (B) Same as A, but for M1-p neurons. (C) Same as A, but for S2-p neurons in ‘Naive’ mice. (D) Same as C, but for M1-p neurons.
-
Figure 2—source data 1
Data values and statistics underlying Figure 2.
- https://doi.org/10.7554/eLife.15798.012
-
Figure 2—source data 2
Data values and statistics underlying Figure 2—figure supplement 2.
- https://doi.org/10.7554/eLife.15798.013
Figure 2—figure supplement 1

Representative hit/miss Vm traces.
(A) Example average subthreshold Vm traces on hit (colored) and miss (black) trials from four individual S2-p neurons in trained ‘Good performer’ mice. Arrows: the onset of whisker stimulus. Insets: PSPs of corresponding traces at high temporal resolution. (B) Same as A, but for M1-p neurons. (C) Same as A, but for S2-p neurons in ‘Naive’ mice. (D) Same as C, but for M1-p neurons.
Figure 2—figure supplement 2
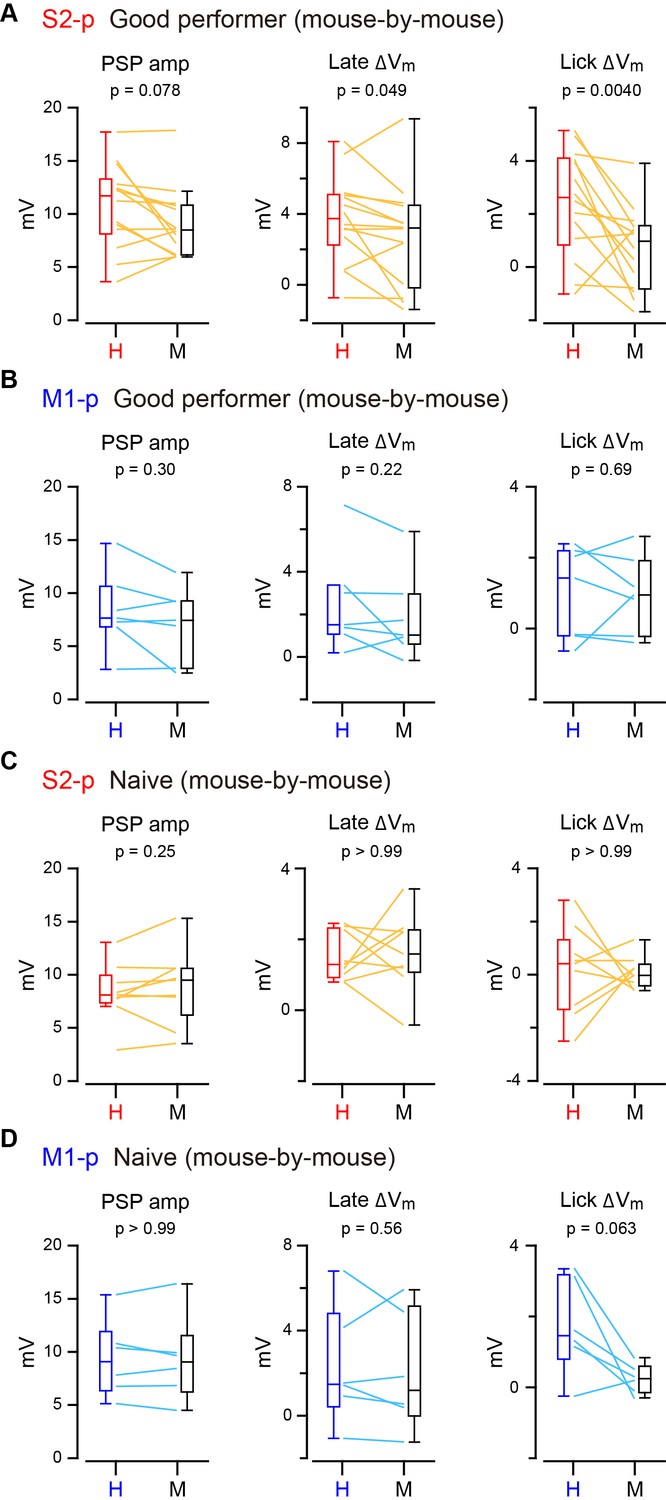
Mouse-by-mouse analysis of hit/miss responses.
(A) Data from S2-p neurons in ‘Good performer’ mice averaged for each mouse (thin lines, n = 14 mice) and box plots for PSP amplitude and Vm depolarization at the late (0.05–0.25 s) and lick periods (0.25–1.0 s) on hit (H) and miss (M) trials. (B) Same as A, but for M1-p neurons (n = 7 mice). (C) Same as A, but for S2-p neurons in ‘Naive’ mice (n = 9 mice). (D) Same as C, but for M1-p neurons (n = 6 mice).
Figure 3 with 3 supplements
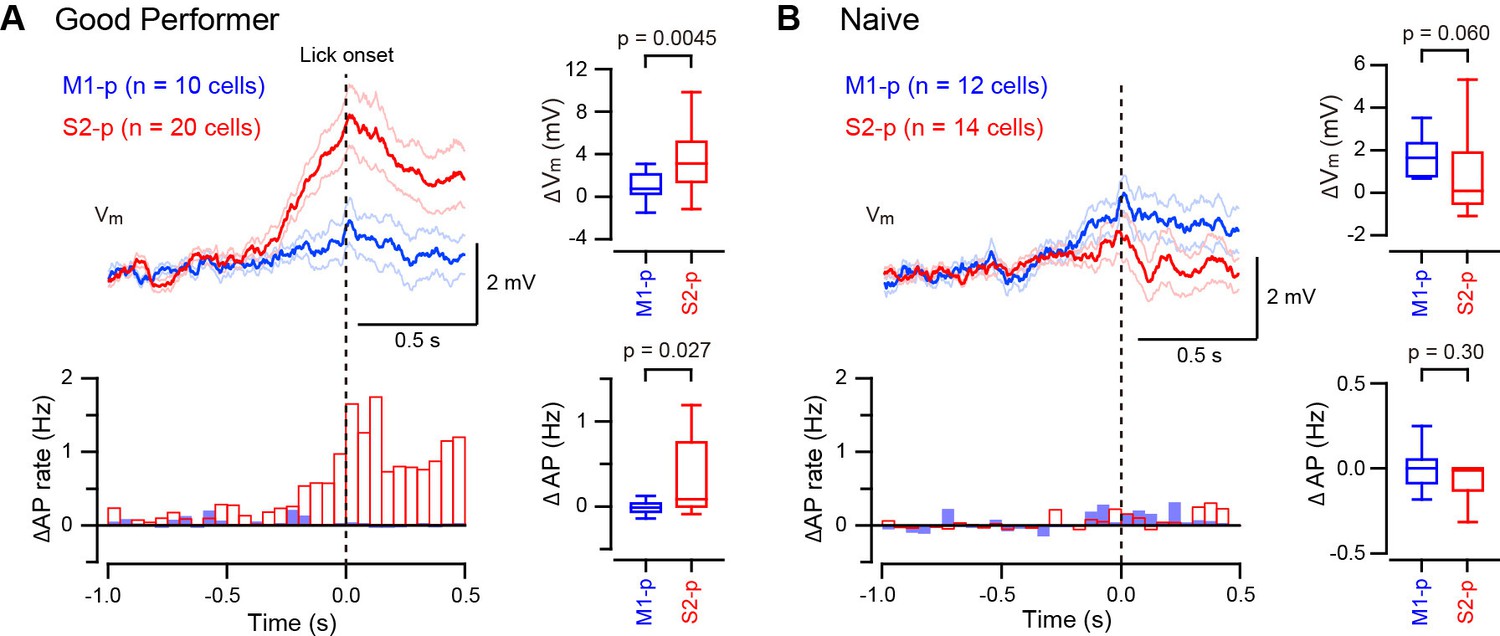
Target-specific Vm depolarization during spontaneous unrewarded licking.
(A, B) Left, grand average change in Vm (thick line: mean, thin lines: ± sem) and AP rate aligned at the onset of detected spontaneous licking (dotted line) in M1-p and S2-p neurons of ‘Good performer’ (A) and ‘Naive’ (B) mice. Right, quantifications at ± 0.1 s around the detected lick onset.
-
Figure 3—source data 1
Data values and statistics underlying Figure 3.
- https://doi.org/10.7554/eLife.15798.017
-
Figure 3—source data 2
Data values and statistics underlying Figure 3—figure supplement 3.
- https://doi.org/10.7554/eLife.15798.018
Figure 3—figure supplement 1

Licking-related Vm dynamics of S2-p and M1-p neurons in ‘Good performer’ mice.
(A) Left, an example Vm trace (below) from an S2-p neuron during spontaneous unrewarded licking and the corresponding lick-sensor signal (above). Right, individual lick-sensor signals (above) and Vm traces (below, thin lines; APs are truncated) aligned and superimposed at the onset of detected licking (the time when the tongue first contacted the water spout; dotted line), obtained from the cell shown on the left. The average subthreshold Vm trace (thick line) is superimposed. (B) Another example from an S2-p neuron different from the cell shown in A. (C) Same as A, but for an M1-p neuron. (D) Another example from an M1-p neuron different from the cell shown in C.
Figure 3—figure supplement 2
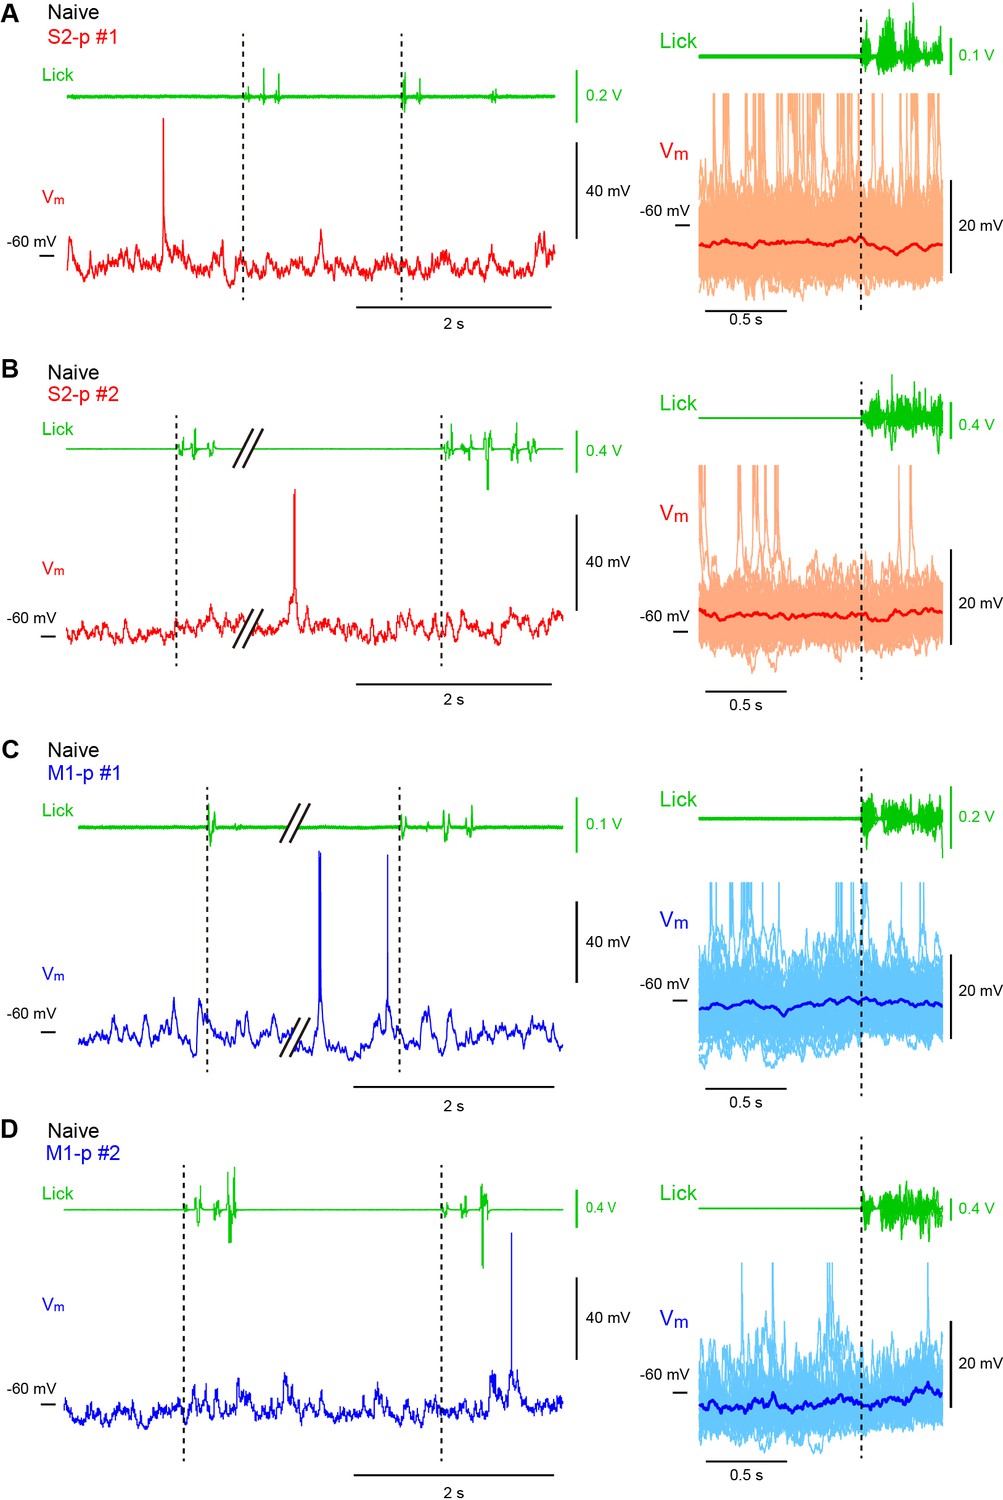
Licking-related Vm dynamics of S2-p and M1-p neurons in ‘Naive’ mice.
(A) Left, an example Vm trace (below) from an S2-p neuron during spontaneous unrewarded licking and the corresponding lick-sensor signal (above). Right, individual lick-sensor signals (above) and Vm traces (below, thin lines; APs are truncated) superimposed and aligned at the onset of detected licking (the time when the tongue first contacted the water spout; dotted line), obtained from the cell shown on the left. The average subthreshold Vm trace (thick line) is superimposed. (B) Another example from an S2-p neuron different from the cell shown in A. (C) Same as A, but for an M1-p neuron. (D) Another example from an M1-p neuron different from the cell shown in C.
Figure 3—figure supplement 3
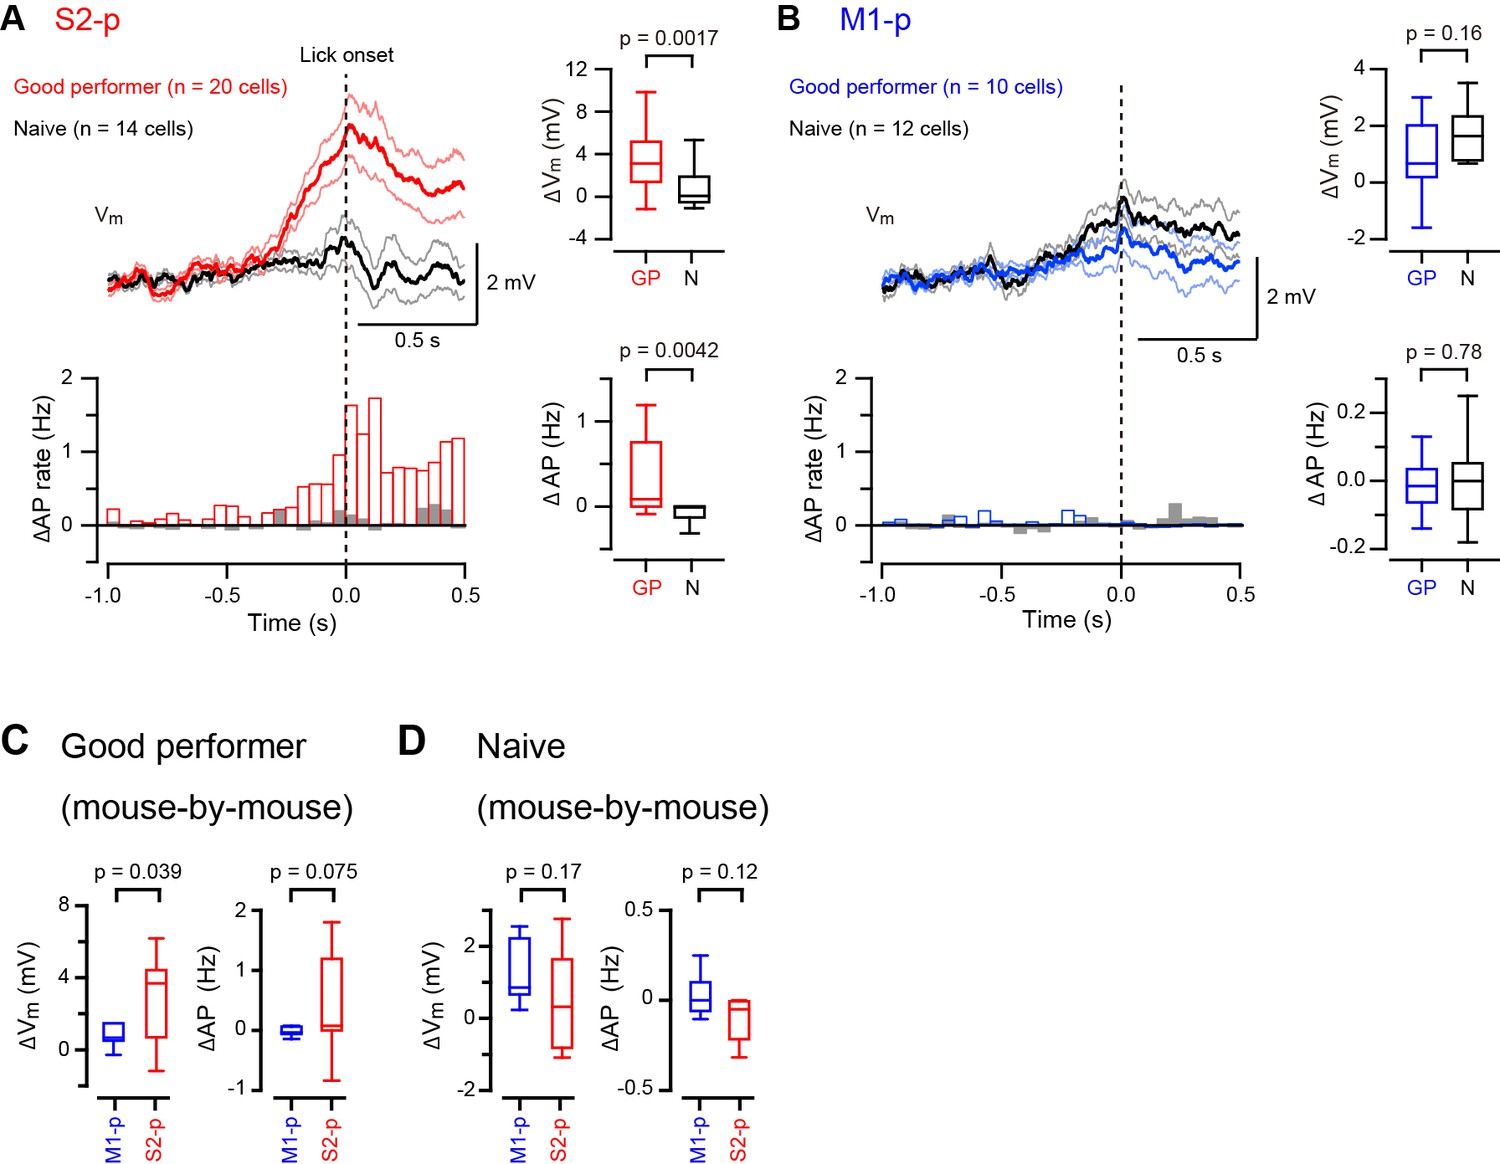
Further analysis of Vm dynamics during spontaneous unrewarded licking.
(A, B) Left, grand average change in Vm (thick line: mean, thin lines: ± sem) and AP rate aligned at the onset of detected spontaneous licking (dotted line) in S2-p (A) and M1-p (B) neurons of ‘Good performer’ and ‘Naive’ mice. Right, quantifications at ± 0.1 s around the detected lick onset. (C) The lick-related change of Vm and AP rate was analyzed on a mouse-by-mouse basis for ‘Good performer’ mice (n = 7 mice for M1-p neurons; n = 15 mice for S2-p neurons). (D) Same as C, but for ‘Naive’ mice (n = 7 mice for M1-p neurons; n = 9 mice for S2-p neurons).
Figure 4
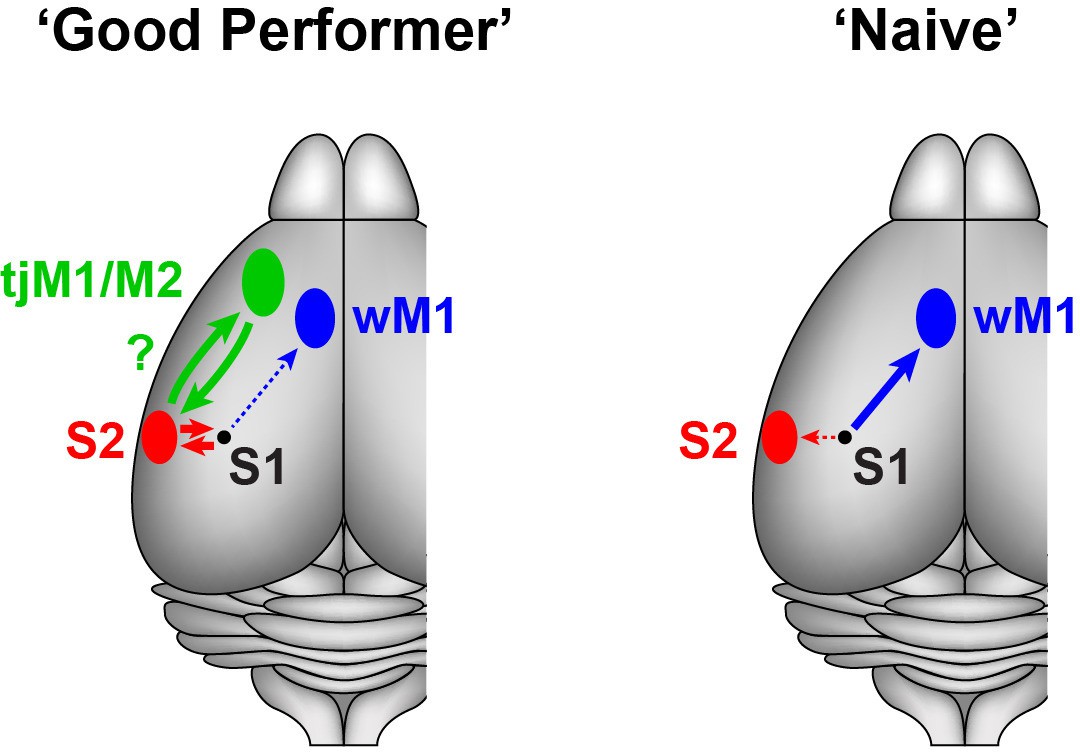
Schematic summary of target-specific output signals from S1 during execution of the whisker detection task, together with speculative hypothesis relating to possible cortico-cortical signalling pathways from S1 to tongue/jaw area of motor cortex.
Left, In ‘Good performer’ mice, S2-p neurons, not M1-p neurons, in S1 develop depolarization correlated with task performance. The activities of S2-p neurons could be routed toward the tongue/jaw area of M1/M2 (tjM1/M2). Right, In ‘Naive’ mice, M1-p neurons, not S2-p neurons, exhibit depolarization correlated with task execution. wM1: whisker M1.
Download links
A two-part list of links to download the article, or parts of the article, in various formats.
Downloads (link to download the article as PDF)
Open citations (links to open the citations from this article in various online reference manager services)
Cite this article (links to download the citations from this article in formats compatible with various reference manager tools)
Target-specific membrane potential dynamics of neocortical projection neurons during goal-directed behavior
eLife 5:e15798.
https://doi.org/10.7554/eLife.15798


