Computationally designed high specificity inhibitors delineate the roles of BCL2 family proteins in cancer
- University of Washington, United States
- University of Illinois, United States
- Fred Hutchinson Cancer Research Center, United States
- LaTrobe Institute for Molecular Science, Australia
- Olivia Newton-John Cancer and Wellness Centre, Australia
- La Trobe University, Australia
- The Walter and Eliza Hall Institute of Medical Research, Australia
- University of Melbourne, Australia
Figures
Figure 1 with 1 supplement
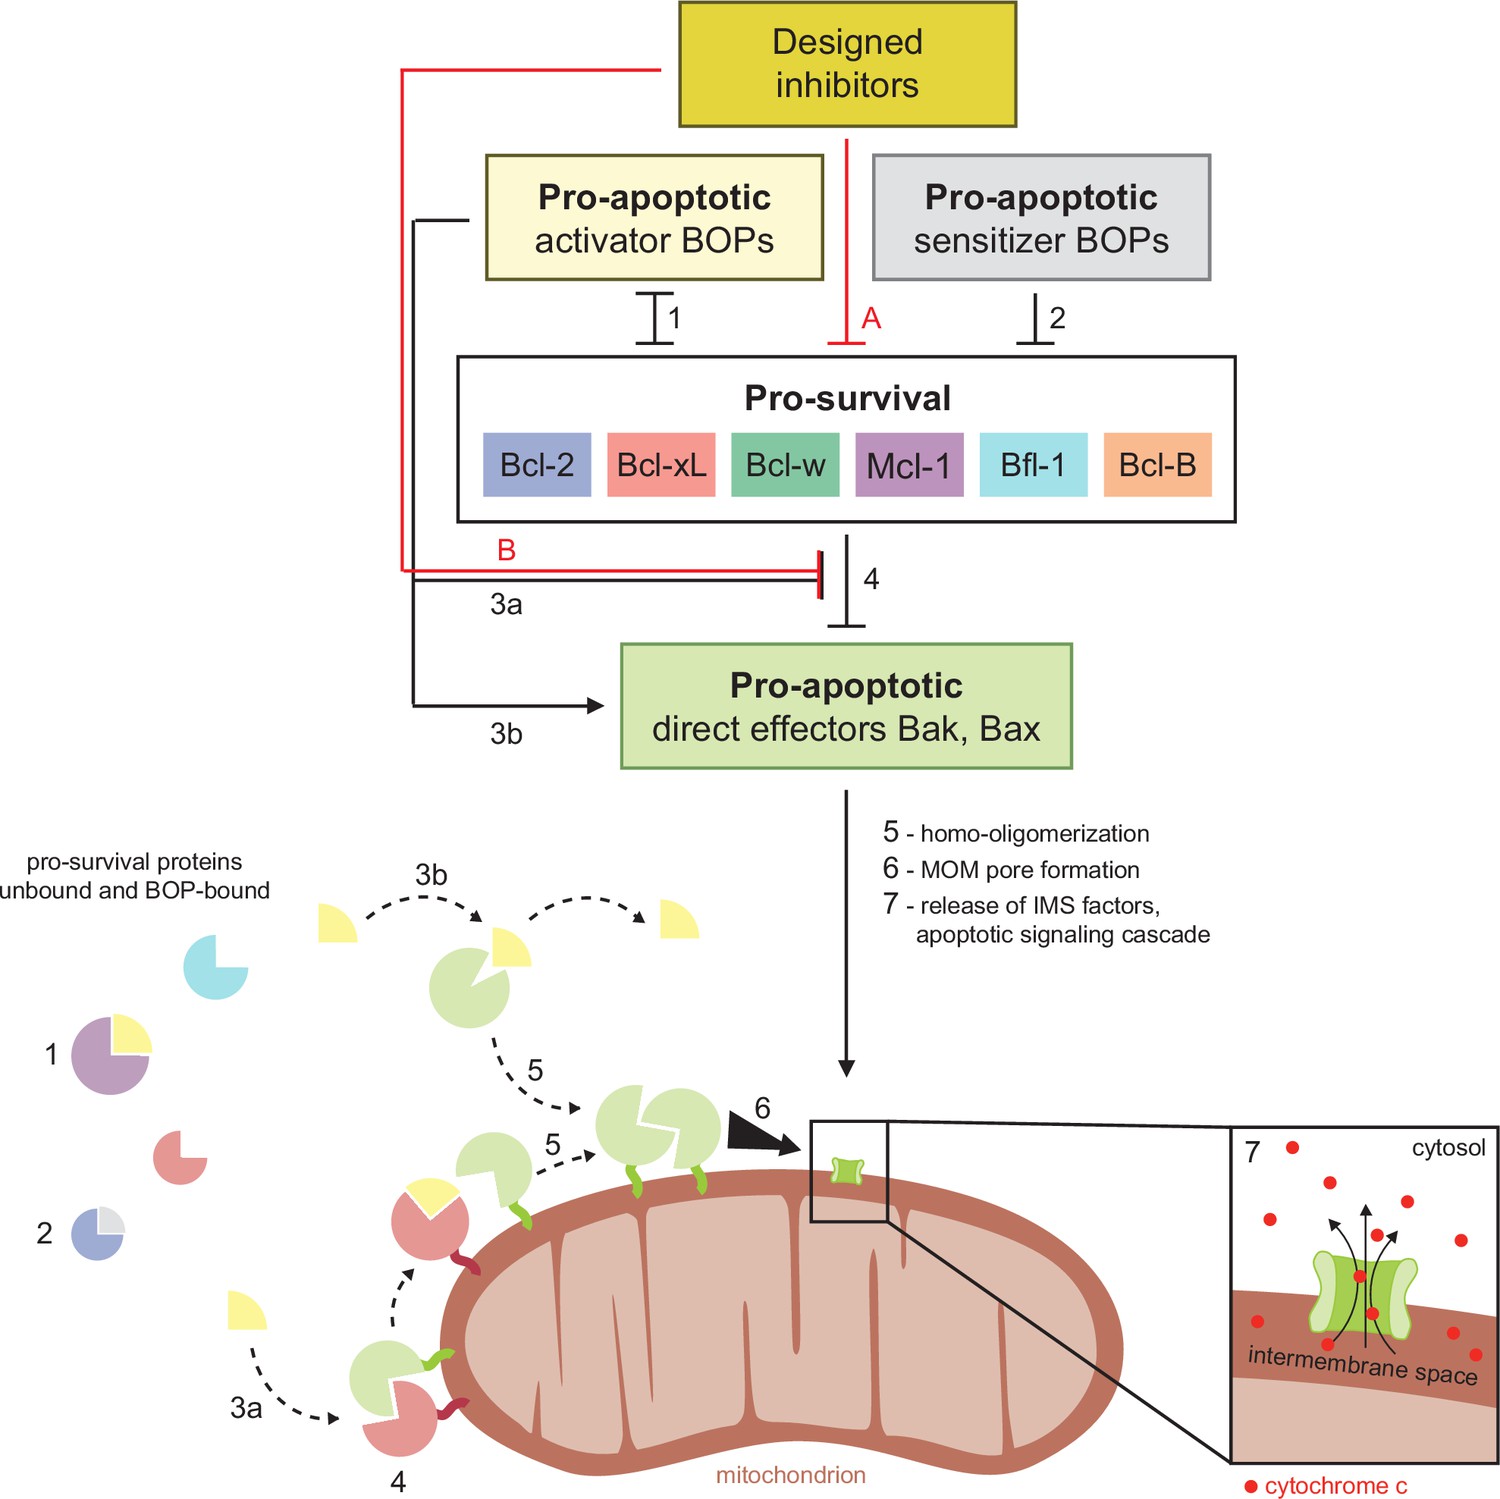
Schematic of BCL2 family interactions.
BCL2 proteins are categorized by their net effect on cell fate and the presence of shared structural domains. BH3-only proteins (BOPs) are sequestered by pro-survival homologs (labels 1 and 2), and some BOPs may activate the direct effectors Bak and Bax by disrupting their inhibition by pro-survival proteins (3a) and/or promoting their homo-oligomerization (3b). Pro-survival proteins, which are typically overexpressed in cancer, bind and inhibit Bak and Bax (4), which would otherwise homo-oligomerize upon activation (5) and form pores in the mitochondrial outer membrane (MOM; 6). MOM permeabilization allows the release of cytochrome c and other factors from the intermembrane space (IMS) and thus initiates the apoptotic signaling cascade (7). Designed inhibitors have a net pro-apoptotic effect by binding pro-survival proteins, which may both limit sequestration of BOPs (A) and disrupt inhibition of Bak and Bax (B).
Figure 1—figure supplement 1
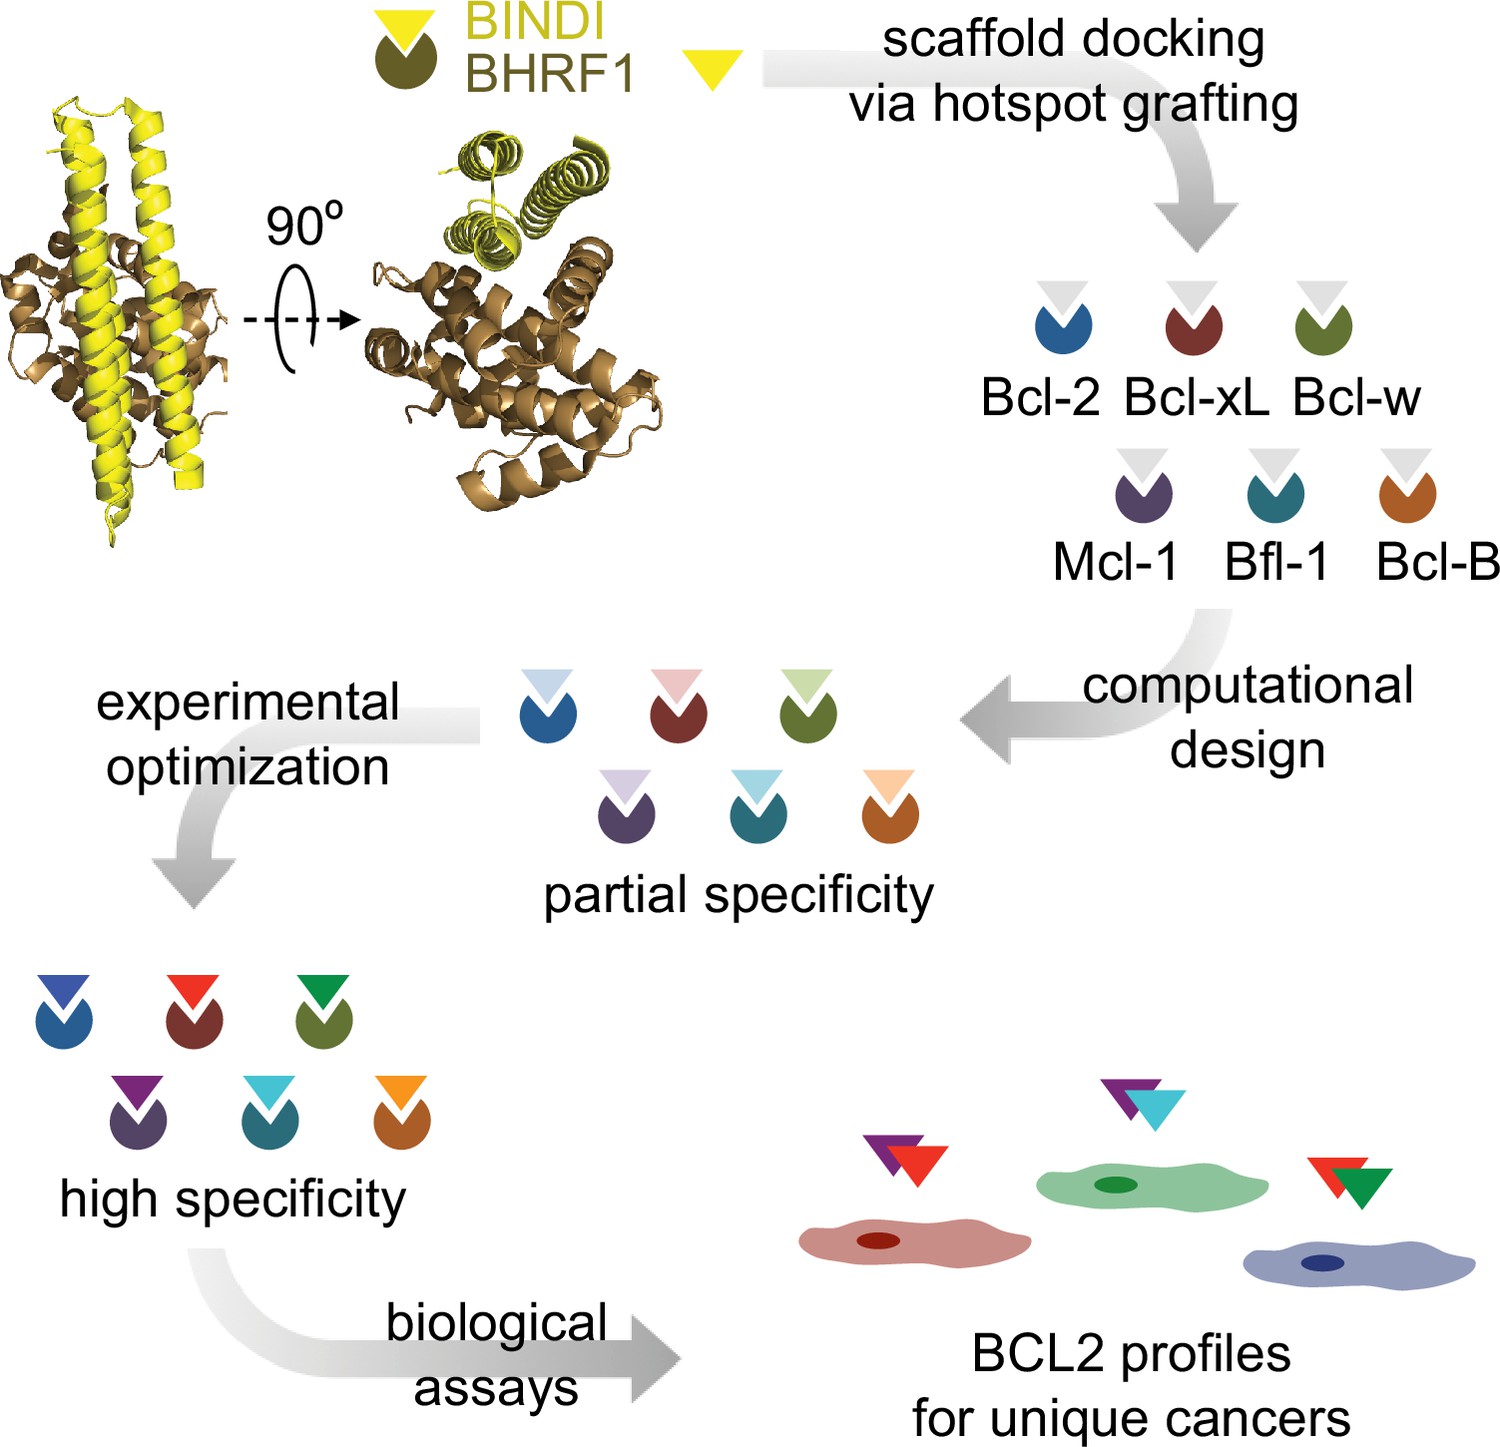
Design strategy.
BINDI, a de novo three-helix bundle inhibitor of BHRF1, was employed as a scaffold protein to engineer altered specificities toward each of six human pro-survival proteins. BINDI was first computationally docked into the binding groove of each BCL2 homolog and interface residues were computationally designed, yielding high affinity inhibitors with at least partial specificity. Some designs were further optimized for specificity and affinity via mutagenesis and in vitro evolution. Specific, optimized inhibitors were used to study BCL2 profiles of different cancers.
Figure 2 with 1 supplement
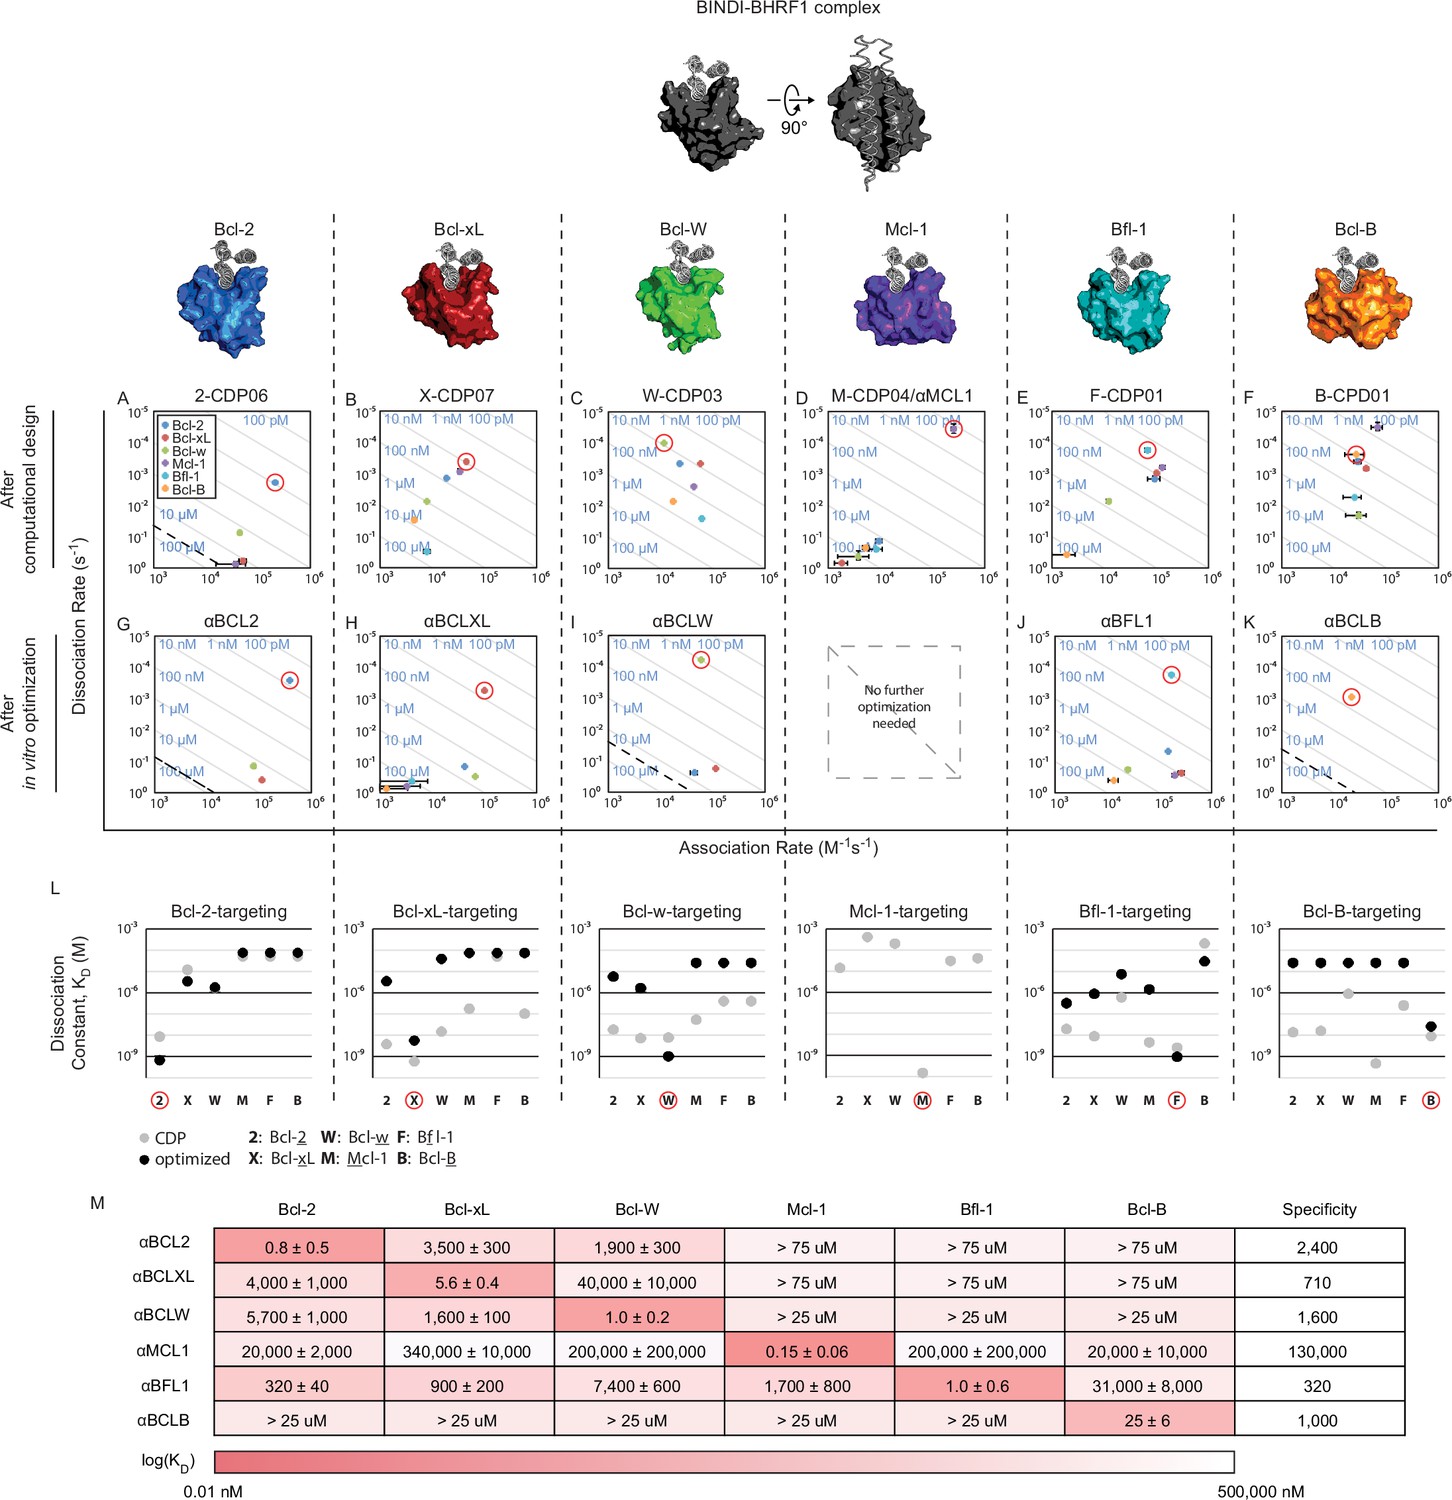
Design of specific inhibitors for each of the six human pro-survival BCL2 homologs.
On and off rates were determined by BLI with multiple-concentration binding titrations for each computationally designed protein (A–F) and optimized variants (G–K; mean ± SD; n = 3). On-target interactions are indicated with red circles. Diagonal lines represent dissociation constants (KD) as labeled. Dashed lines indicate affinities at which binding signals were too weak to be accurately measured; dissociation constants for interactions not plotted are assumed to be greater than these thresholds. (L) KD values for computational designs before (gray) and after optimization (black). (M) KD values for final optimized inhibitors (mean ± SD; n = 3).
-
Figure 2—source data 1
Source data relating to Figure 2A–M and Figure 2—figure supplement 1H.
Biolayer interferometry data fit to a 1:1 binding model using ForteBio analysis software. Three separate binding titrations (n = 3) were completed for each binding pair, except when negligible signal was detected at high analyte concentrations (indicated in file where applicable). Figure 2—source data 1. Source data relating to Figure 2—figure supplement 1I. CD data collected for chemical denaturation experiments in guanidinium hydrochloride from 0 to 6 M.
- https://doi.org/10.7554/eLife.20352.005
-
Figure 2—source data 2
Source data relating to Figure 2—figure supplement 1I.
CD data collected for chemical denaturation experiments in guanidinium hydrochloride from 0 to 6 M.
- https://doi.org/10.7554/eLife.20352.006
Figure 2—figure supplement 1
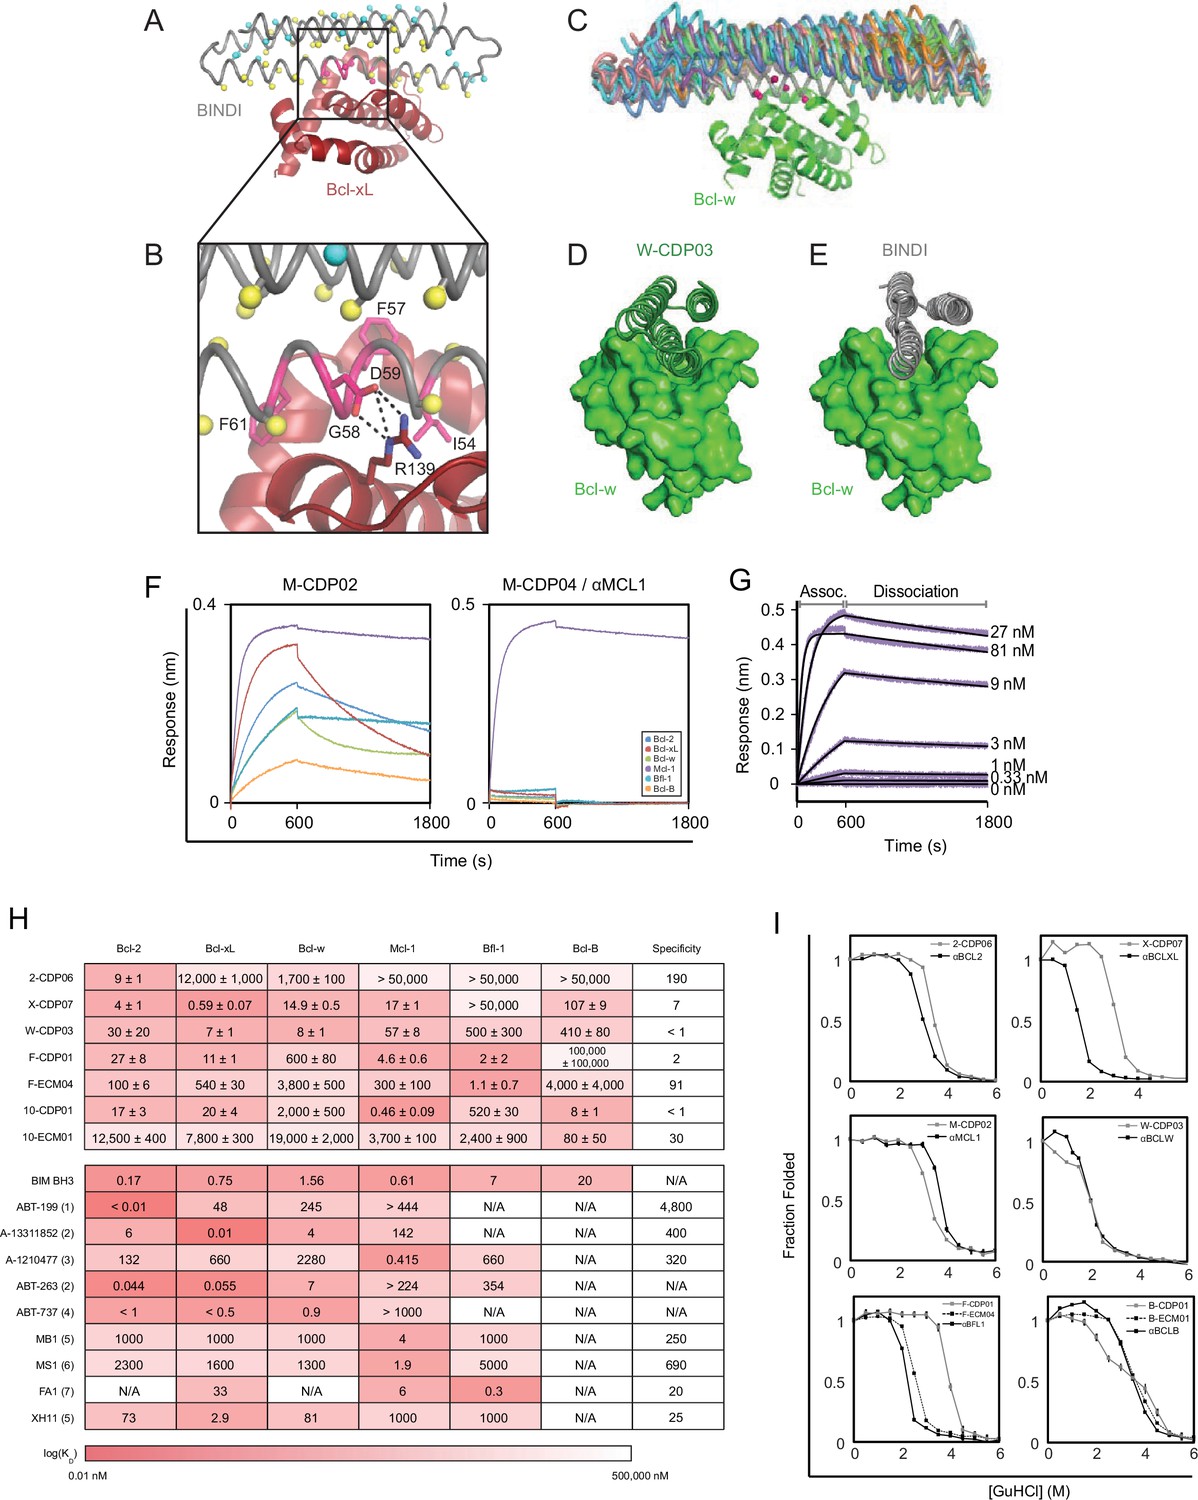
Computational design and screening methods.
(A) BINDI (gray) was docked to the hydrophobic binding groove of Bcl-xL (red) by alignment to a bound BH3 peptide (not shown). The docked pose undergoes successive rounds of design with ROSETTA, in which BINDI residues within 8 Å (Cβ atoms indicated by yellow spheres) and then 12 Å (cyan spheres) of the interface are available for computational mutation, while hotspot residues (pink spheres) are held constant. (B) Hotspots (pink) are borrowed from native BH3 motifs or designed peptides, transferred to the BINDI scaffold and restricted from mutation during design (termed ‘side chain grafting’). (C) A novel motif-grafting method samples all possible docked configurations of the BINDI scaffold (multiple colors) in the Bcl-w (green) binding groove. (D) The docked position of Bcl-w-targeting design W-CDP03 (green cartoon) is shifted one helical turn relative to (E) BINDI (gray cartoon) and exhibits better shape complementarity to Bcl-w (green surface). (F) Selected computationally designed proteins (CDPs) are qualitatively compared with single-concentration BLI assays. Design M-CDP02 is partially specific for Mcl-1, and M-CDP04 is highly specific. (G) Binding constants (KD) are accurately determined with multiple-concentration BLI titrations. Biotinylated Mcl-1 was immobilized to a streptavidin-coated sensor and incubated with the indicated concentrations of soluble αMCL1. Raw data are purple, fitted curves are black. (H) KD values of CDPs, intermediate ECMs, and Bim BH3 (as a fusion to maltose binding protein) were determined with BLI (mean ± SD; n = 3), and binding constants of competing small molecule and peptide inhibitors (citations noted below). (I) Computationally designed proteins (all gray, except M-CDP04/αMCL1 in black which required no further optimization) and their optimized successors (ECMs dashed; better variants solid black) were denatured with guanidinium hydrochloride. The CD signal at 222 nM was measured and loss of signal used to calculate the fraction folded. Mean CD signal ± SD from three scans. (1) Souers et al., 2013; (2) Leverson et al., 2015; (3) Leverson et al., 2015a; (4) Tse et al., 2008; (5) Dutta et al., 2010; (6) Foight et al., 2014; (7) Dutta et al., 2013.
Figure 3 with 1 supplement
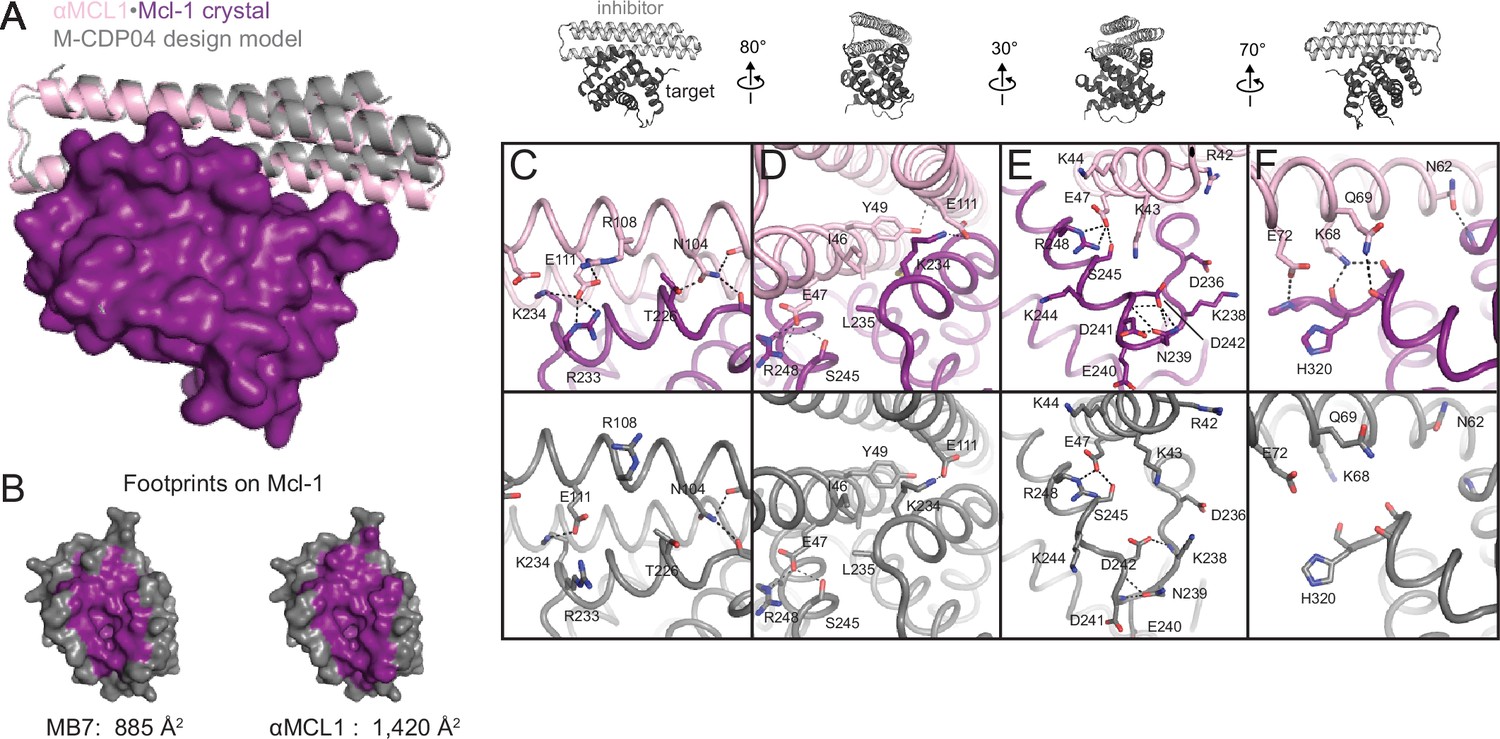
The crystal structure of αMCL1•Mcl-1 is very close to the design model.
(A) Alignment of the computational design model M-CDP04 (gray cartoon) and crystal structure (Mcl-1, purple surface; αMCL1, pink cartoon). (B) Buried contact surfaces on Mcl-1 bound to a BH3-like motif (designed peptide MB7; PDB 3KZ0) and αMCL1. (C–F) Comparison of crystal structure (top panels) with the design model (bottom panels) highlights accuracy of design and shows how high specificity was achieved. (C) αMCL1 computationally designed residues E111, R108 and N104 complement nearby Mcl-1 residues. (D) αMCL1 residue 46 was redesigned from glutamate (BINDI scaffold) to isoleucine to accommodate the hydrophobic Mcl-1 binding pocket. (E) Designed residues R42, K43 and K44 promote long-range electrostatic complementarity to the negatively-charged loop region of Mcl-1. αMCL1 residue E47 (borrowed from Bim) makes ionic interactions with Mcl-1 residues S245 and R248. (F) Designed residues K68, Q69, and E72, and Bim residue N62, make polar interactions with the Mcl-1 backbone. Though the design model does not place αMCL1 near enough to Mcl-1 to make these interactions, the design calculations selected residues with long-range electrostatic complementarity.
Figure 3—figure supplement 1
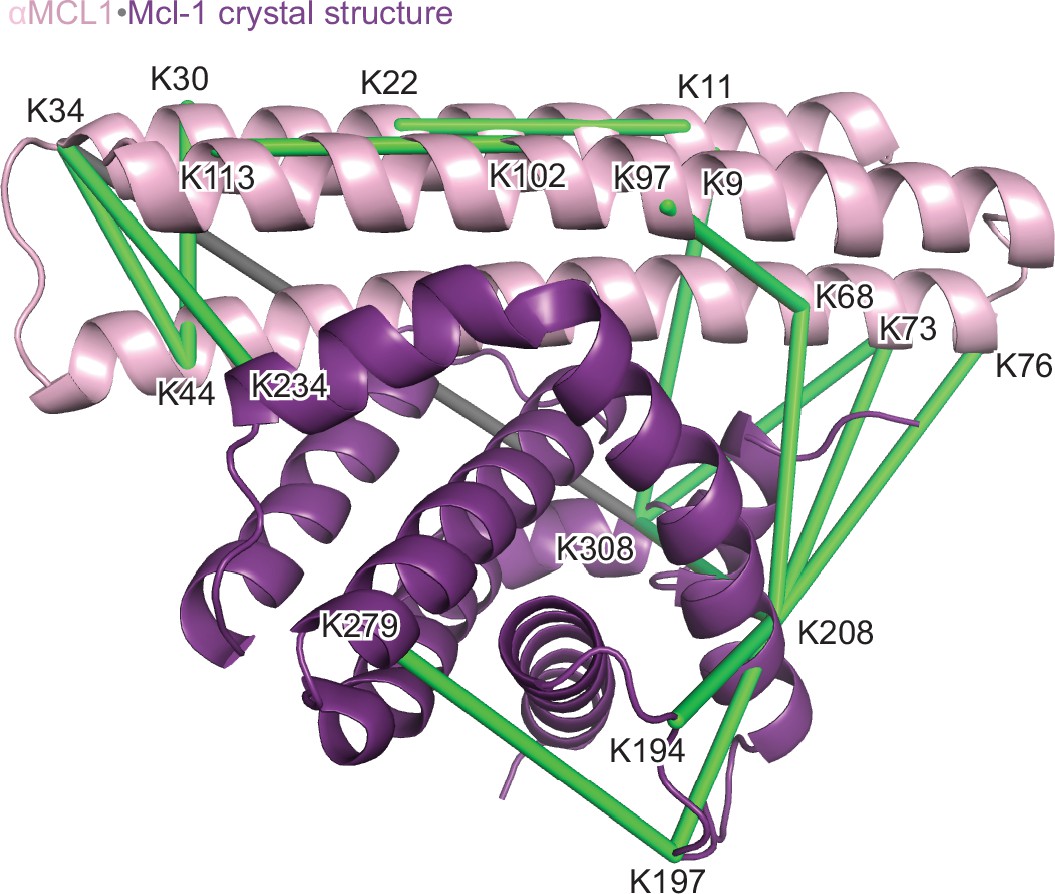
Structural analysis of the αMCL1•Mcl-1 complex via lysine-specific chemical cross-linking.
Cross-linking studies of αMCL1 bound to Mcl-1 were consistent with the computational design model and crystal structure. The protein complex was incubated with three different cross-linking agents; DSS and BS3 have spacer arms of 11.4 Å, and DSG has a 7.7 Å spacer arm. These agents link lysine residues whose alpha carbons are within ~30 Å or ~26 Å, respectively. The proteins were trypsin-digested and peptides analyzed by mass spectrometry. 38 of 44 cross-links mapped to the model are below the 30 Å limit for the cross-linking agents. In the crystal structure (chains A and B used for analysis; Mcl-1 is purple and αMCL1 is light pink in cartoon representation), electron density was observed for additional residues not included in the design model, allowing additional cross-links to be mapped to the structure. 41 out of 49 cross-links mapped to the crystal structure are below the 30 Å limit. As distances increase, residues are less likely to be linked by all three reagents. For residues linked by all three reagents, 20/20 agree with the crystal structure (18/18 agree with the model); for residues linked by two of the reagents, 10/11 agree with the crystal structure (10/11 agree with the model); and for residues linked by only one of the reagents, 11/18 agree with the crystal structure (10/15 agree with the model). Overall, cross-links with the greatest confidence (i.e. detected by at least two different cross-linking agents, shown as green lines) are in excellent agreement with the structure, and these data have insufficient resolution to distinguish the model from the crystal structure; only one of these cross-links (gray line) violates the 30 Å limit.
Figure 4
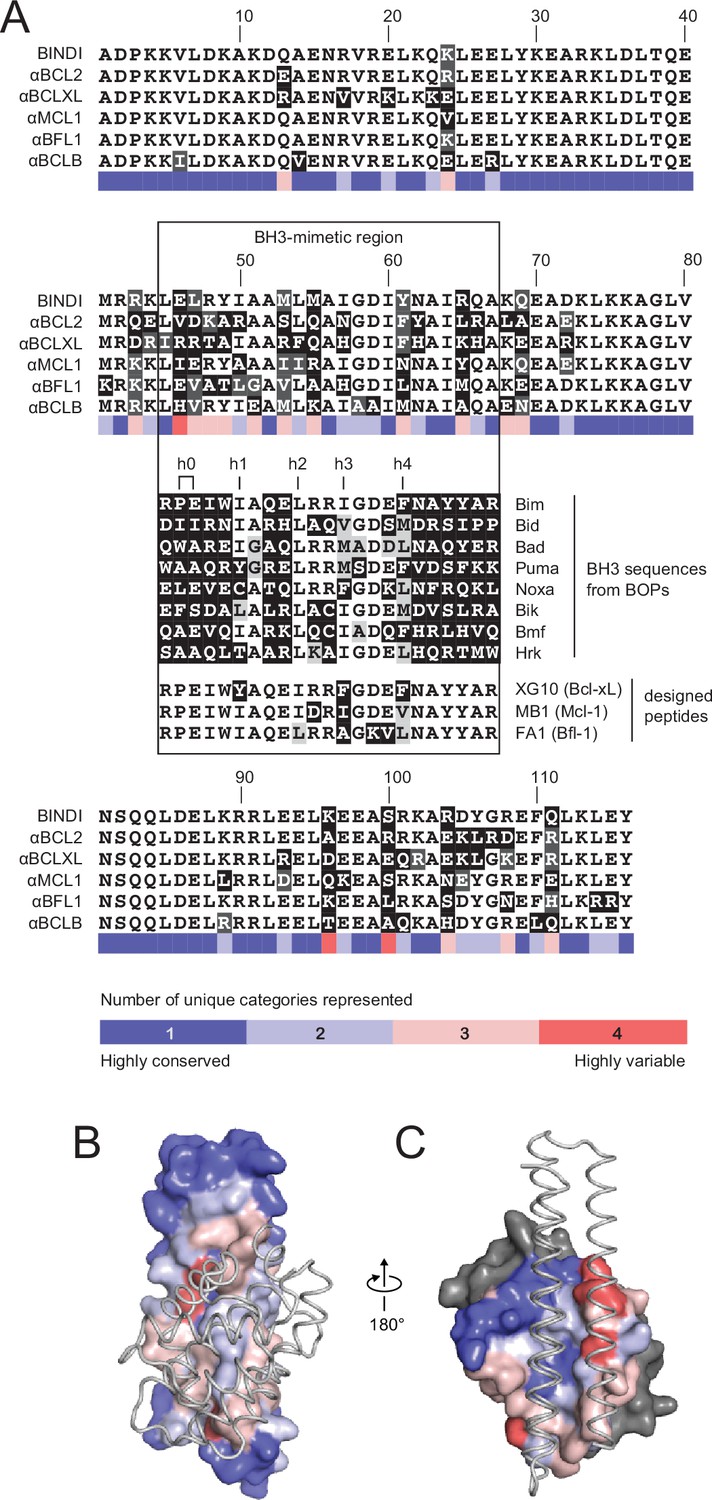
Comparison of design sequences with BH3-mimetic peptides and natural BH3 motifs.
(A) Sequences of optimized inhibitors are aligned, excluding αBCLW, which binds to Bcl-w using a shifted interaction surface. The BH3-mimetic region of designed inhibitors is compared to natural BH3 sequences and synthetic peptides designed for indicated specificities. Non-consensus residues are shaded gray if similar to consensus and black if different. (B) Conservation was assessed by counting the number of unique categories of amino acids (polar, charged, etc.) represented across each position. Conservation scores were mapped onto each position of BINDI (surface) bound to BHRF1 (gray ribbon; PDB 4OYD). (C) Conservation scores from a sequence alignment of BCL2 proteins are mapped to BHRF1 (surface) bound to BINDI (gray ribbon). The designed proteins differ considerably from BOPs and previously designed peptides and contain many additional specificity-enhancing residues outside the BH3 region.
Figure 5 with 3 supplements
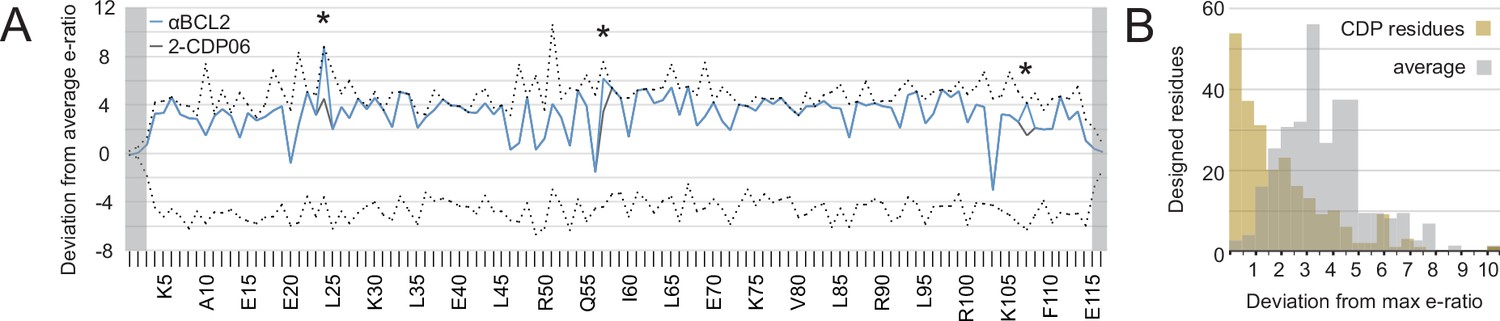
Analysis of computational design success.
(A) Deep sequencing analysis of the naïve and sorted 2-CDP06 SSM library enabled quantitative analysis of the fitness of each single amino acid substitution for specificity and affinity toward Bcl-2. Per position, the enrichment ratio (abbreviated e-ratio; a fitness score) of each 2-CDP06 residue (gray) was compared to the average value for all 20 amino acids (normalized to zero). Maximum deviations from the average are represented by dashed lines, positive values indicate the best score and negative the worst. SSM-guided mutations from 2-CDP06 to αBCL2 (blue) are starred. Gray shading indicates positions with insufficient sequencing data. (B) Deviation from maximum e-ratio was calculated for each designable residue of the five mutagenized CDPs, pooled, and the distribution of deviations plotted (gold; full SSM heatmaps in Figure 5—figure supplement 1); distribution of average deviations from maximum for each designable residue is shown in gray.
-
Figure 5—source data 1
Source data relating to Figure 5 and Figure 5—figure supplement 1.
Enrichment ratios of all SSM mutants, calculated from deep sequencing of naïve and sorted populations of SSM libraries based on the indicated CDP. Raw data have been deposited in the National Center for Biotechnology Information Gene Expression Omnibus repository with accession number GSE80194.
- https://doi.org/10.7554/eLife.20352.012
Figure 5—figure supplement 1
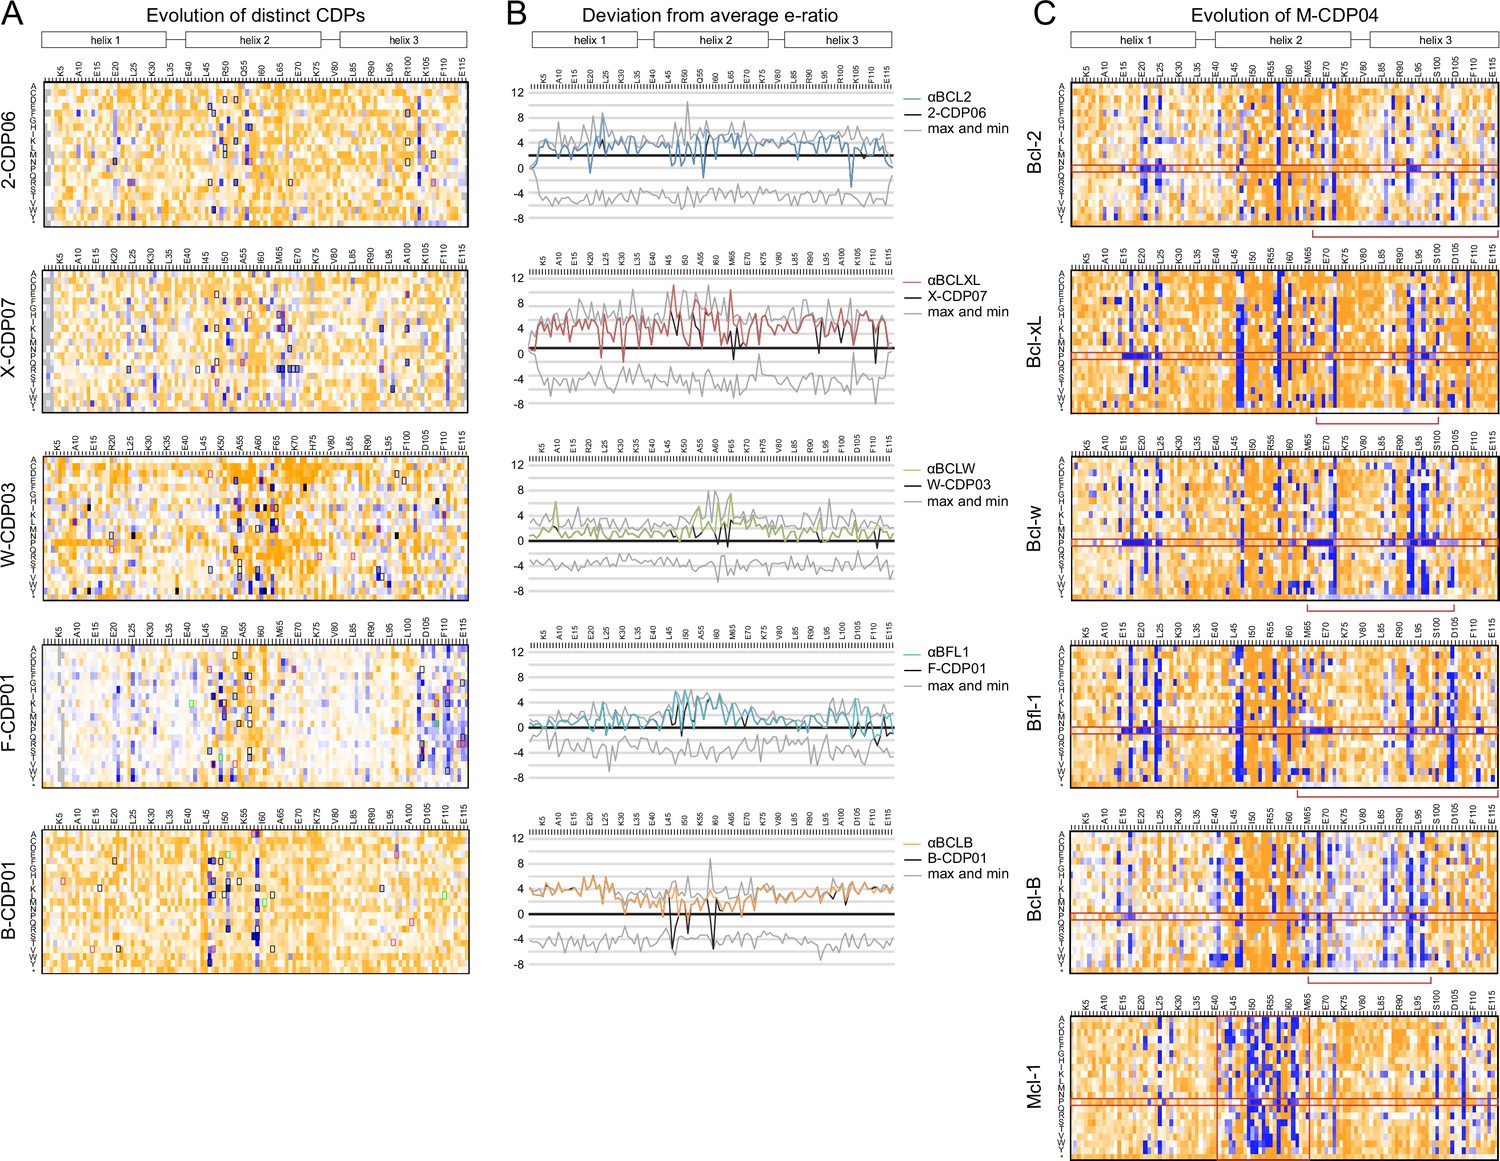
Sequence analysis of SSM libraries.
(A) SSM libraries were generated based on the indicated CDPs and sorted for high affinity and specificity to each target BCL2 homolog. Sequence fitness landscapes show enriched mutations (blue) that favor high affinity and/or specific binding and depleted mutations (orange) that do not. Mutations selected for a combinatorial library are boxed. Red boxes indicate mutations present in the optimized variant from each combinatorial library, and green boxes indicate mutations present in the best optimized variants from epPCR libraries. (B) For each computationally designed protein (black) and optimized variant (corresponding colors), at each position, the designed protein residue’s enrichment ratio was compared to the average value for all 20 amino acids, and this deviation from average is plotted. The x-axis represents the average enrichment ratio normalized to zero (deviation from average = 0), and the gray lines indicate the maximum and minimum deviation from average represented at each position. CDPs scored above average (> 0) at most positions, indicating that designed sequences were close to optimum. As expected, mutations incorporated in each optimized variant had more favorable enrichment ratios than their corresponding designed residues, except αBFL1 M53V, which could be preferred in context of other mutations. (C) An SSM library was generated based on the partially-specific Mcl-1-targeting design M-CDP02 (see Figure 2—figure supplement 1F) and sorted for high affinity and specificity to each indicated BCL2 homolog. Sequence fitness landscapes show enriched (blue) and depleted (orange) mutations. Red boxes highlight the enrichment of aberrant mutations to proline and stop codons.
Figure 5—figure supplement 2
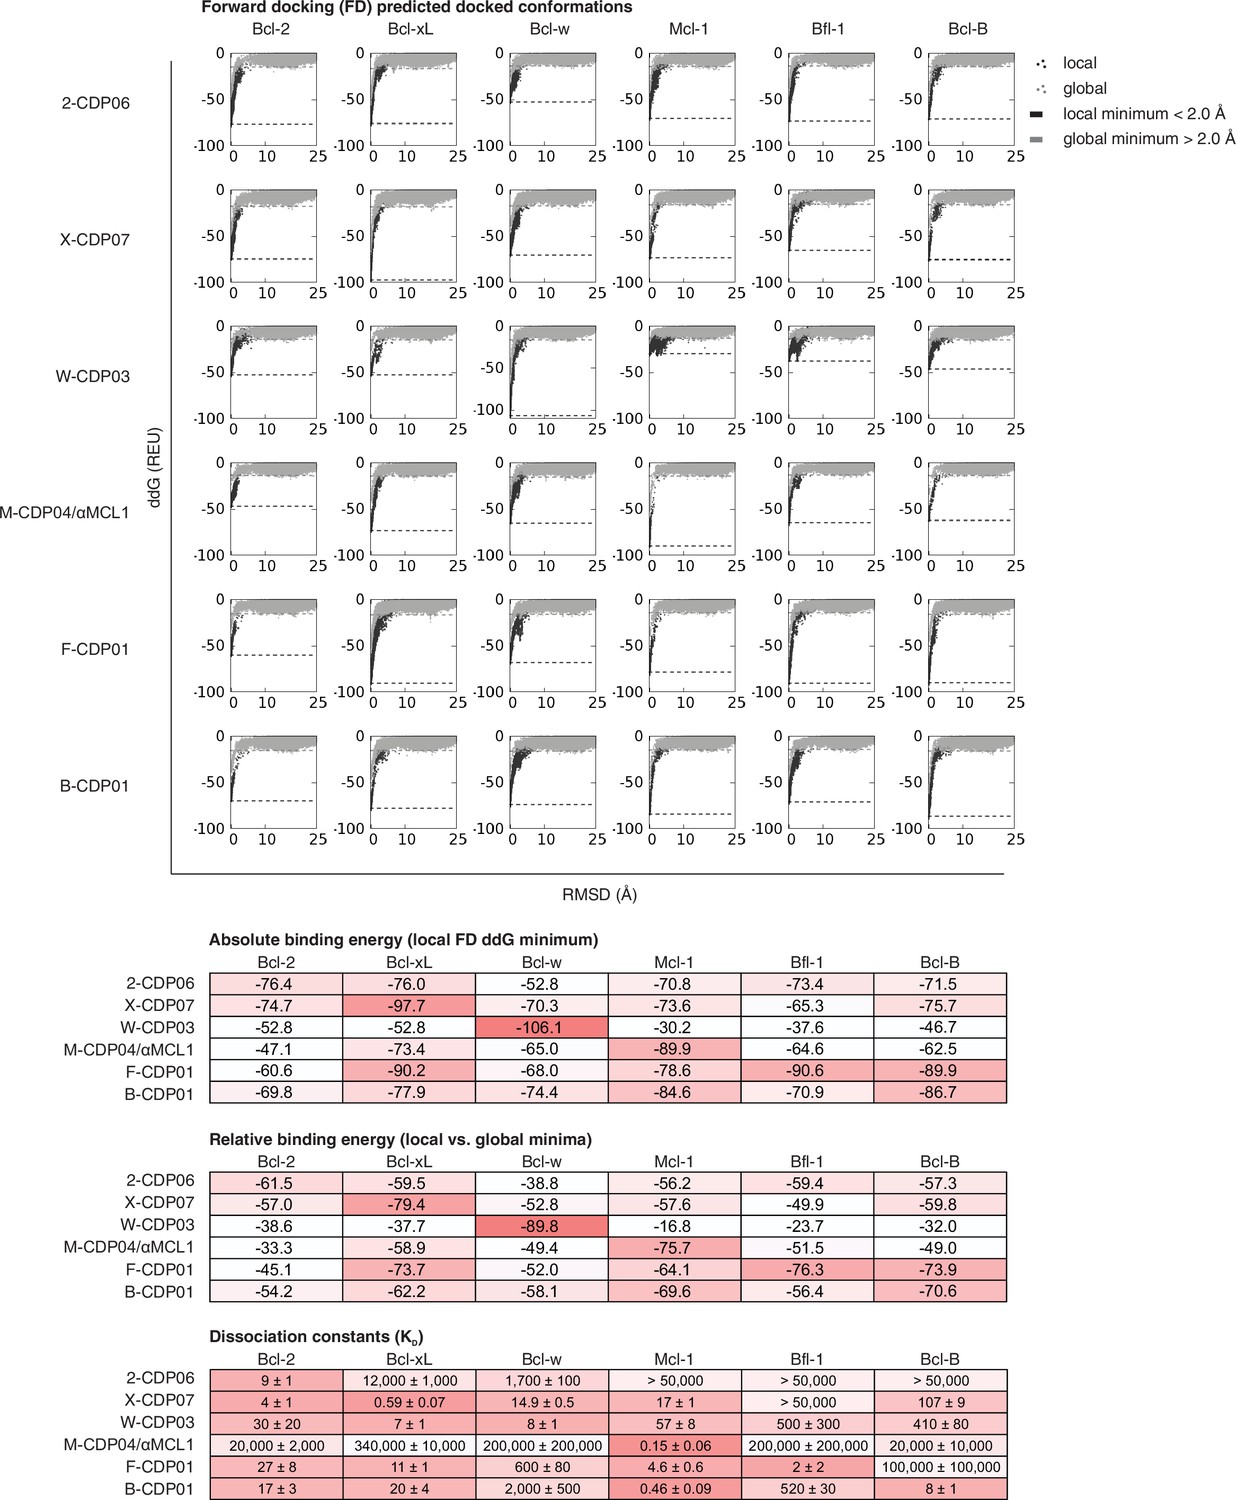
Computational docking calculations: CDPs.
CDPs were computationally docked into the canonical binding groove of each pro-survival BCL2 homolog, sampling both local (close to the input bound conformation) and global (entire protein surface) environments. Binding energy (ddG) and RMSD from the input bound conformation were calculated for each of the thousands of docked configurations and plotted (global docking models in gray, local in black). The average of the 100 lowest-scoring docked conformations were calculated for local (local minimum; black dashed line) and global (global minimum; gray dashed line) docking. Absolute binding energy (local minimum) and relative binding energy (difference between local and global minima) are plotted and compared to experimental binding data.
Figure 5—figure supplement 3
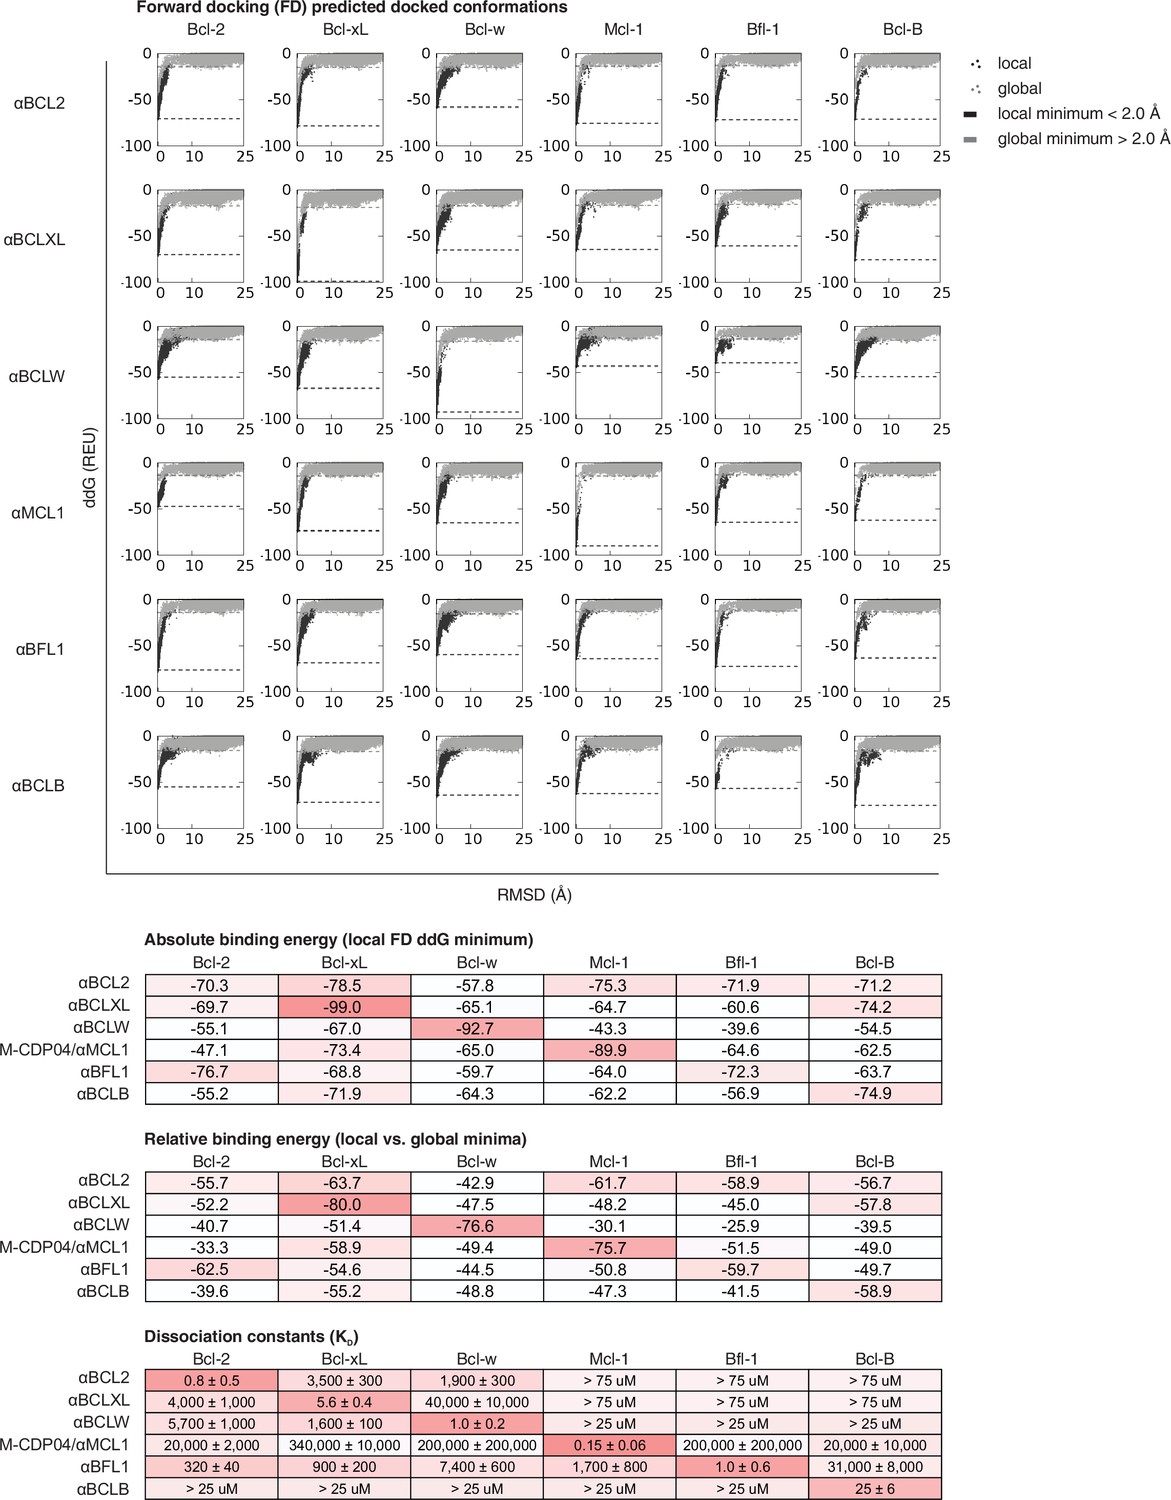
Computational docking calculations: optimized inhibitors.
Optimized, specific inhibitors were computationally docked into the canonical binding groove of each pro-survival BCL2 homolog, sampling both local (close to the input bound conformation) and global (entire protein surface) environments. Binding energy (ddG) and RMSD from the input bound conformation were calculated for each of thousands of docked configurations and plotted (global docking models in gray, local in black). The average of the 100 lowest-scoring docked conformations were calculated for local (local minimum; black dashed line) and global (global minimum; gray dashed line) docking. Absolute binding energy (local minimum) and relative binding energy (difference between local and global minima) are plotted and compared to experimental binding data.
Figure 6 with 1 supplement
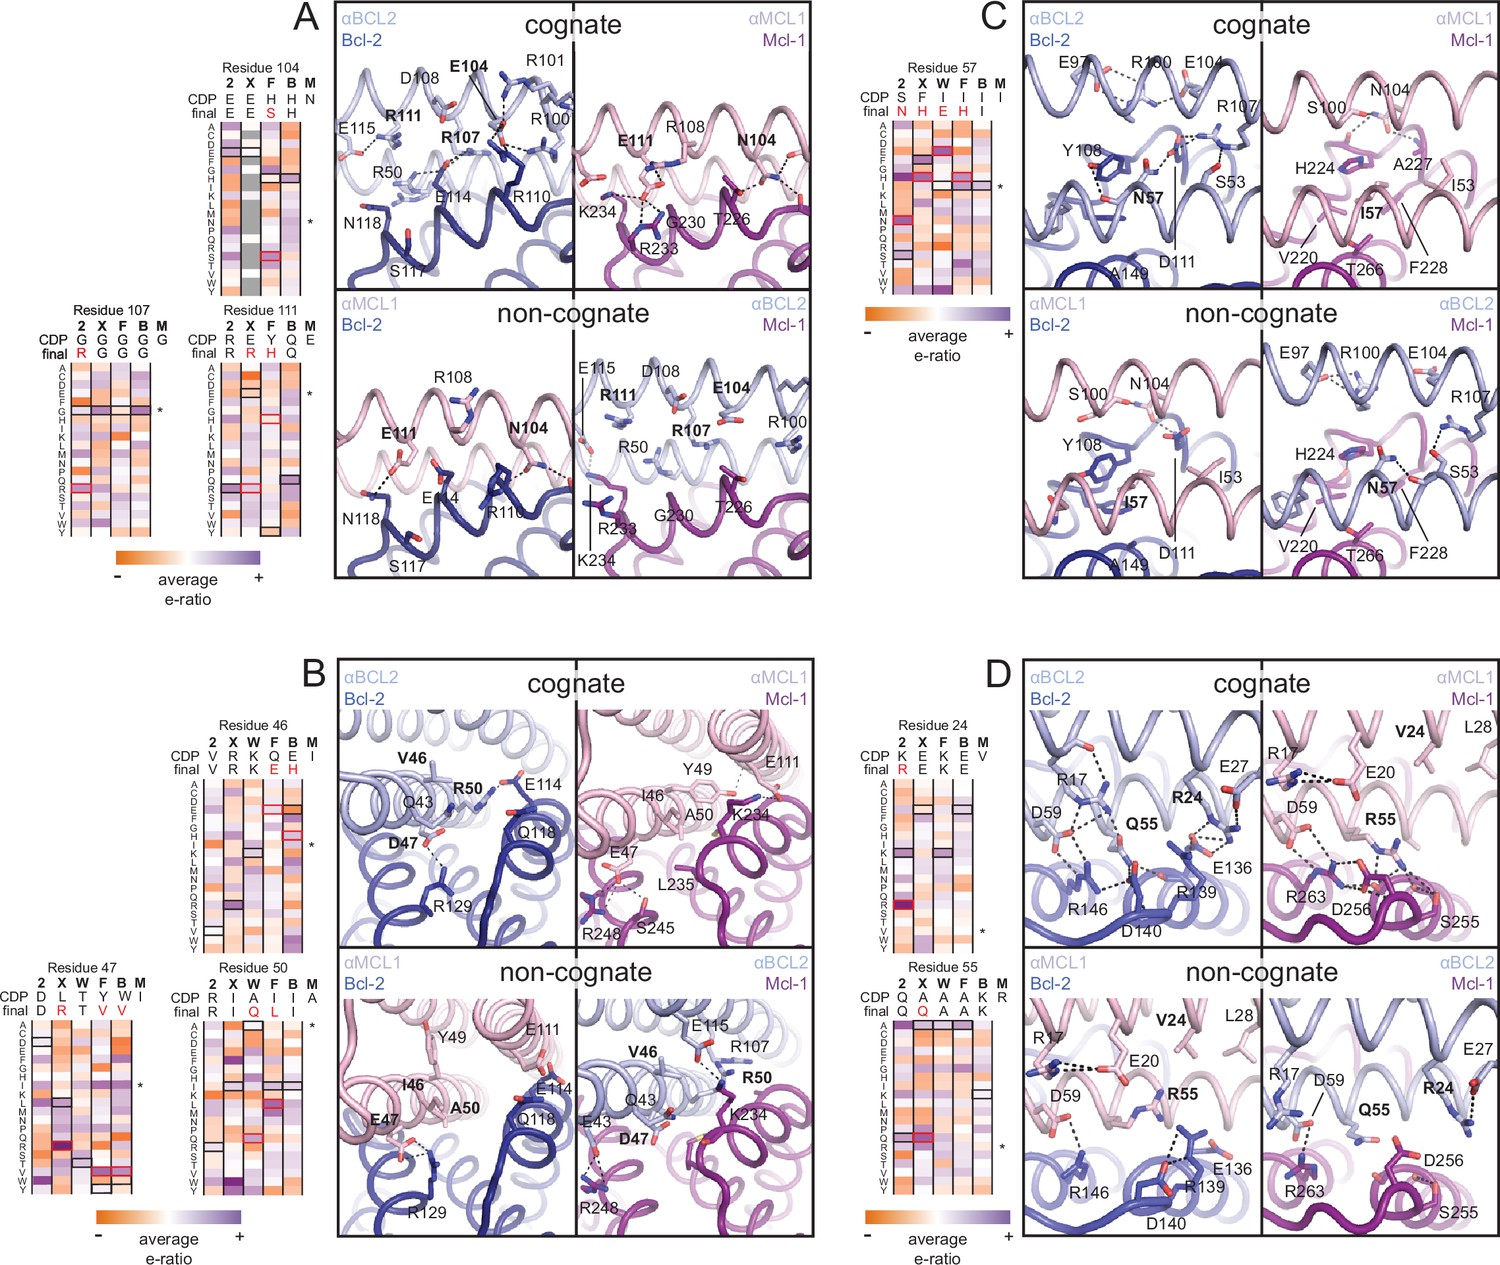
Determinants of binding specificity.
αMCL1•Mcl-1 and αBCL2•Bcl-2 crystal structures (upper panels, high complementarity) and non-cognate binding pairs modeled in Rosetta (lower panels, poor complementarity) were aligned. For select positions on the three-helix bundle scaffold, normalized enrichment of each mutant (indicated by amino acid code) toward specific binding to each homolog (indicated at the top of each column) are shown for comparison Black outlines indicate the identity of the homolog-specific CDP, and red outlines indicate the identity of the homolog-specific optimized inhibitor (if different from CDP). Stars indicate the identity of M-CDP04/αMCL1 (no in vitro evolution required, and thus no deep sequencing data available). Gray fill indicates positions with insufficient sequencing data. Analogous αBCLW residues were included for helix 2 (sequence shifted + 4 relative to others). (A) Designed αBCL2 residues E104 and R111 and αMCL1 N104 and E111 illustrate computational design success. Each contributes polar contact(s) with its target homolog, and deep sequencing data show these residues deplete binding toward one or more competitor homologs to improve specificity. αMCL1 E111 opposes Bcl-2 E114. SSM-guided αBCL2 mutation G107R contributes additional polar contacts with Bcl-2. (B) Designed αBCL2 residue R50 is tolerated by a more spacious Bcl-2 binding pocket and interacts with Bcl-2 E114. Designed αBCL2 residue D47 is partially satisfied by Bcl-2 R129. Both αBCL2 R50 and D47 fit poorly in the more hydrophobic analogous region of Mcl-1. (C) Evolved αBCL2 residue N57 introduces polar atoms in the hydrophobic interface but is partially satisfied by Bcl-2 D111. (D) Evolved αBCL2 residue R24 and designed Q55 make polar contacts with Bcl-2. αMCL1 R55, borrowed from Bim, caps an Mcl-1 helix and opposes Bcl-2 residue R139.
Figure 6—figure supplement 1
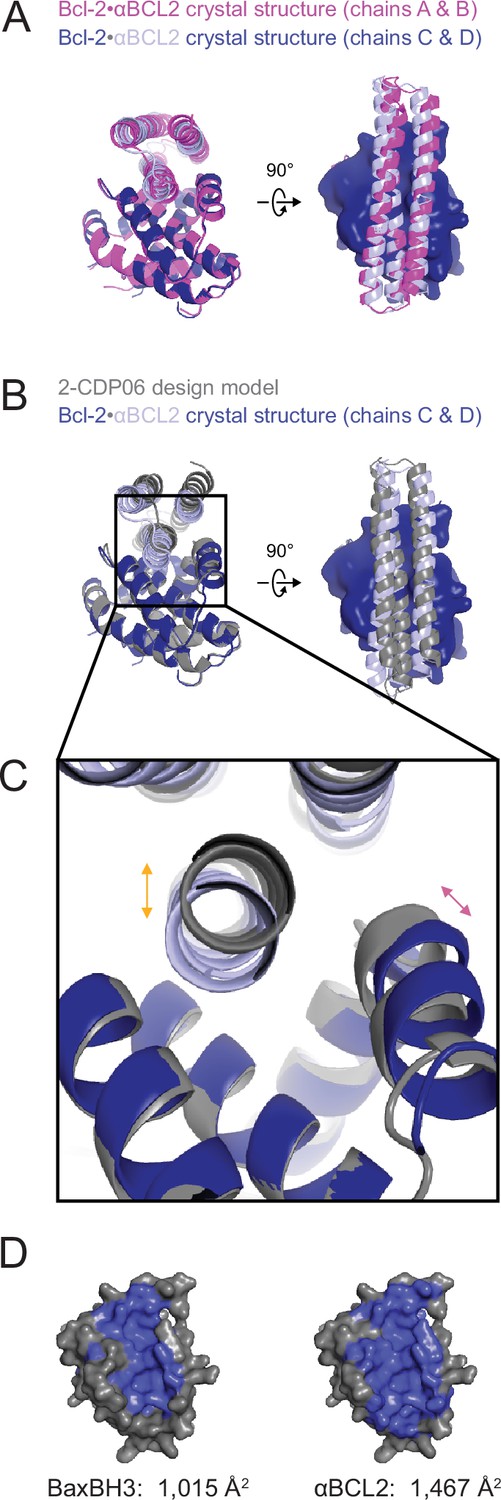
The crystal structure of the αBCL2•Bcl-2 complex.
(A) Alignment of the two non-crystallographic symmetry (NCS)-related Bcl-2 molecules show the binding modes of the two NCS-related αBCL2 molecules differ slightly (1.9 Å RMSD). (B) Alignment of Bcl-2 molecules of the design model and crystal structure (chain C) show that design model 2-CDP06 and crystal structure αBCL2 have significantly different binding modes (4.0 Å RMSD, average from crystal structure chains A and C). (C) Magnification of the Bcl-2 binding pocket. The design model Bcl-2, based on PDB 4LVT (Bcl-2 bound to small molecule inhibitor Navitoclax), has a binding pocket slightly closed relative to the Bcl-2 crystal structure (pink arrow), and 2-CDP06 is positioned further from Bcl-2 than the αBCL2 crystal structure (orange arrow). Bcl-2 backbone restriction during design likely prohibited Bcl-2-targeting designs from accessing the closer bound conformation. (D) The buried contact surfaces of Bcl-2 bound to a representative BH3 motif (BaxBH3; PDB 2XA0) and αBCL2.
Figure 7 with 1 supplement
Designed inhibitors induce apoptosis in vitro by engaging the BH3-binding grooves of specific pro-survival homologs.
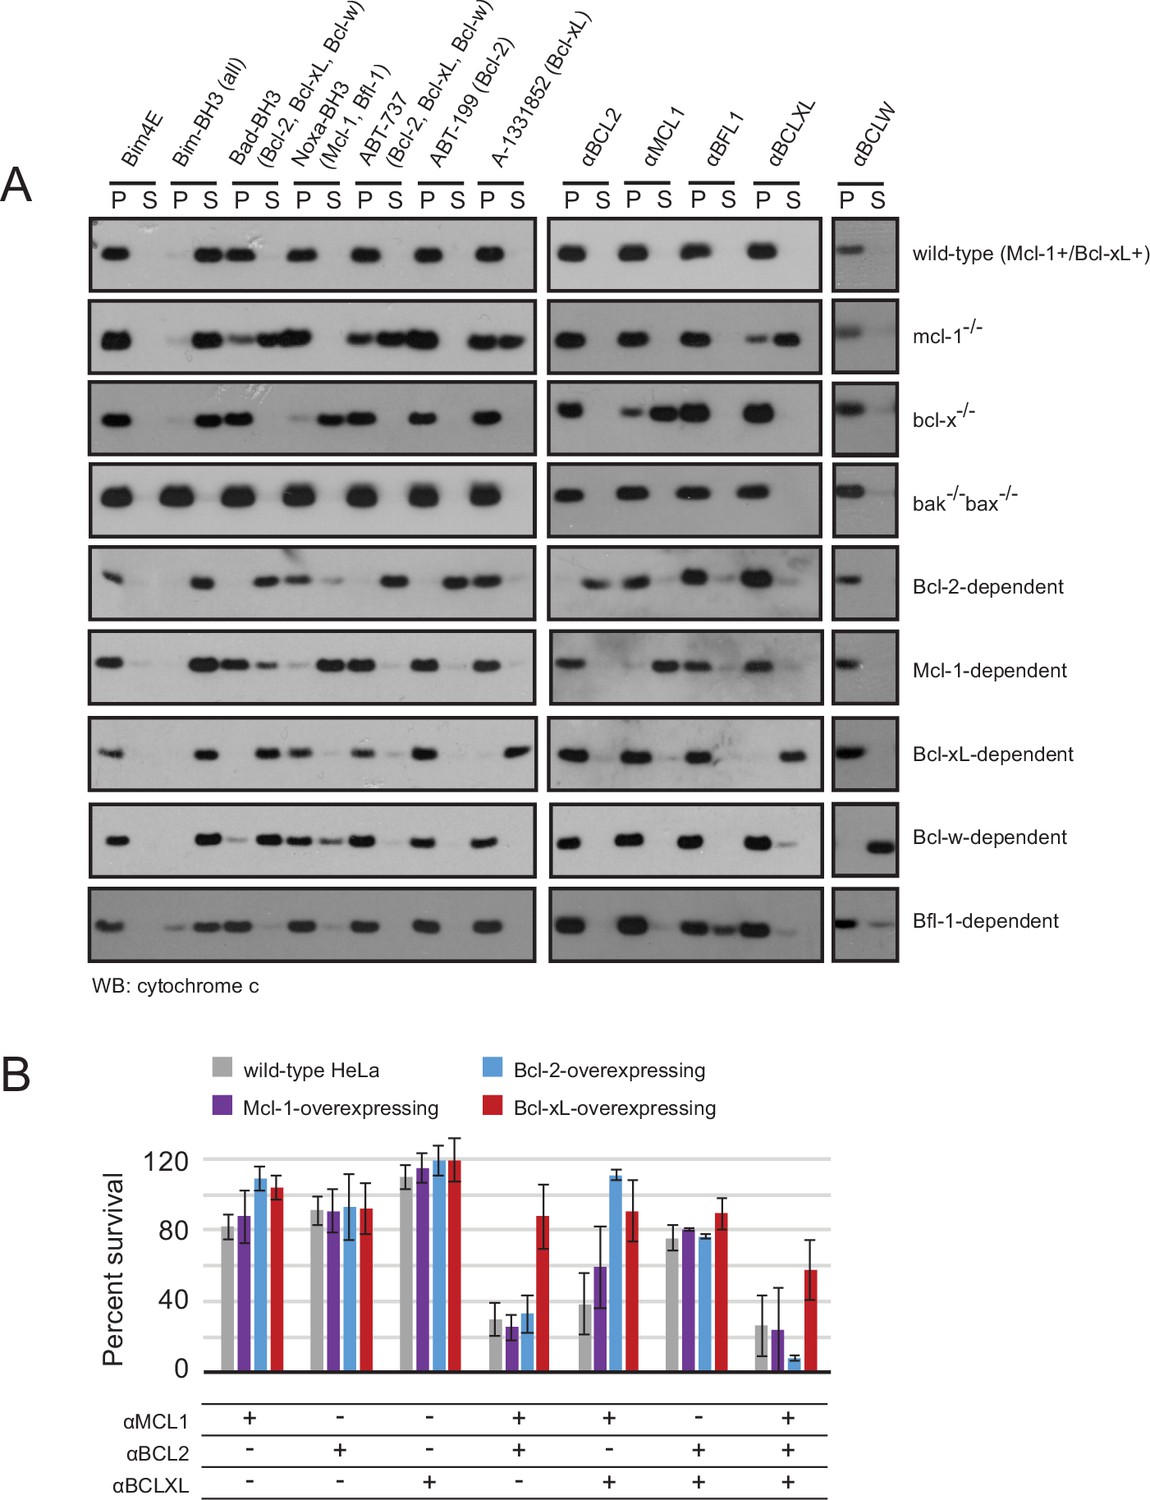
(A) Western blot for cytochrome c in pelleted (P) and soluble (S) fractions of engineered MEFs after permeabilization and treatment with 10 mM BCL2 inhibitors. Bim-BH3, which binds all pro-survival homologs, is a positive control. Bim-BH3 peptide with four mutations to glutamate at interface residues (Bim4E) is a negative control. BOPs Bad and Noxa, and small molecule drugs tested have the indicated binding specificities in parentheses. (B) HeLa cells were transduced with constructs for designed inhibitor expression, and viability was assayed after 72 hr (mean ± SD; n = 2 for Bcl-2+ double and triple combinations, n = 3 for all others).
-
Figure 7—source data 1
Source data relating to Figure 7B and Figure 7—figure supplement 1A.
(A) Survival assays for WT and modified HeLa cell lines after treatment with the indicated inhibitors or inhibitor combinations. Raw data have been normalized to the negative control (empty virus). (B) Long-term survival assays for engineered MEFs with indicated BCL2 dependency, after inducing expression of αMCL1 or αBFL1. All values have been normalized to uninduced controls.
- https://doi.org/10.7554/eLife.20352.019
Figure 7—figure supplement 1
Long-term MEF survival and HeLa co-immunoprecipitation studies.
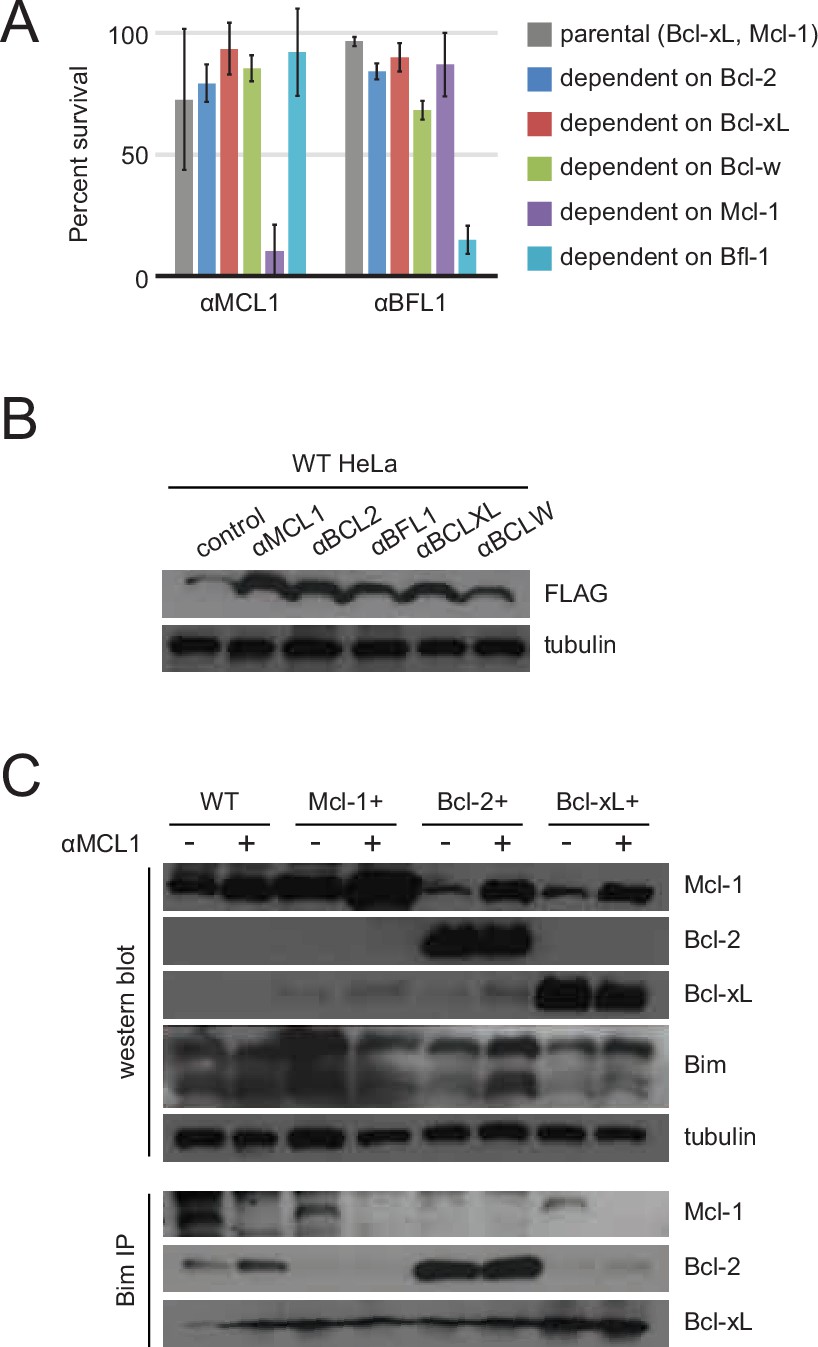
(A) Long-term survival of engineered MEFs (pro-survival protein dependence as indicated) was assayed by counting colonies after seven to ten days of doxycycline-induced expression of αMCL1 or αBFL1 (mean ± SD; for αMCL1, n = 3; for αBFL1, n = 2). (B) Expression of FLAG-tagged designed inhibitors in transduced HeLa cells validated with Western blotting. (C) Bim coIP experiments in wild-type and engineered HeLa cells, with and without expression of αMCL1. Expression of αMCL1 caused a dramatic increase in the quantities of Mcl-1 protein present in all cell lines, consistent with previous studies showing increased Mcl-1 half-life in the presence of BH3-peptides (Lee et al., 2008). Bound αMCL1 may stabilize Mcl-1 or occlude Mule (Mcl-1 ubiquitin ligase E3), which binds and ubiquitinates Mcl-1 via a BH3 motif. Despite elevating Mcl-1 protein levels, αMCL1 expression potently induces apoptosis in the expected cell contexts.
Figure 8
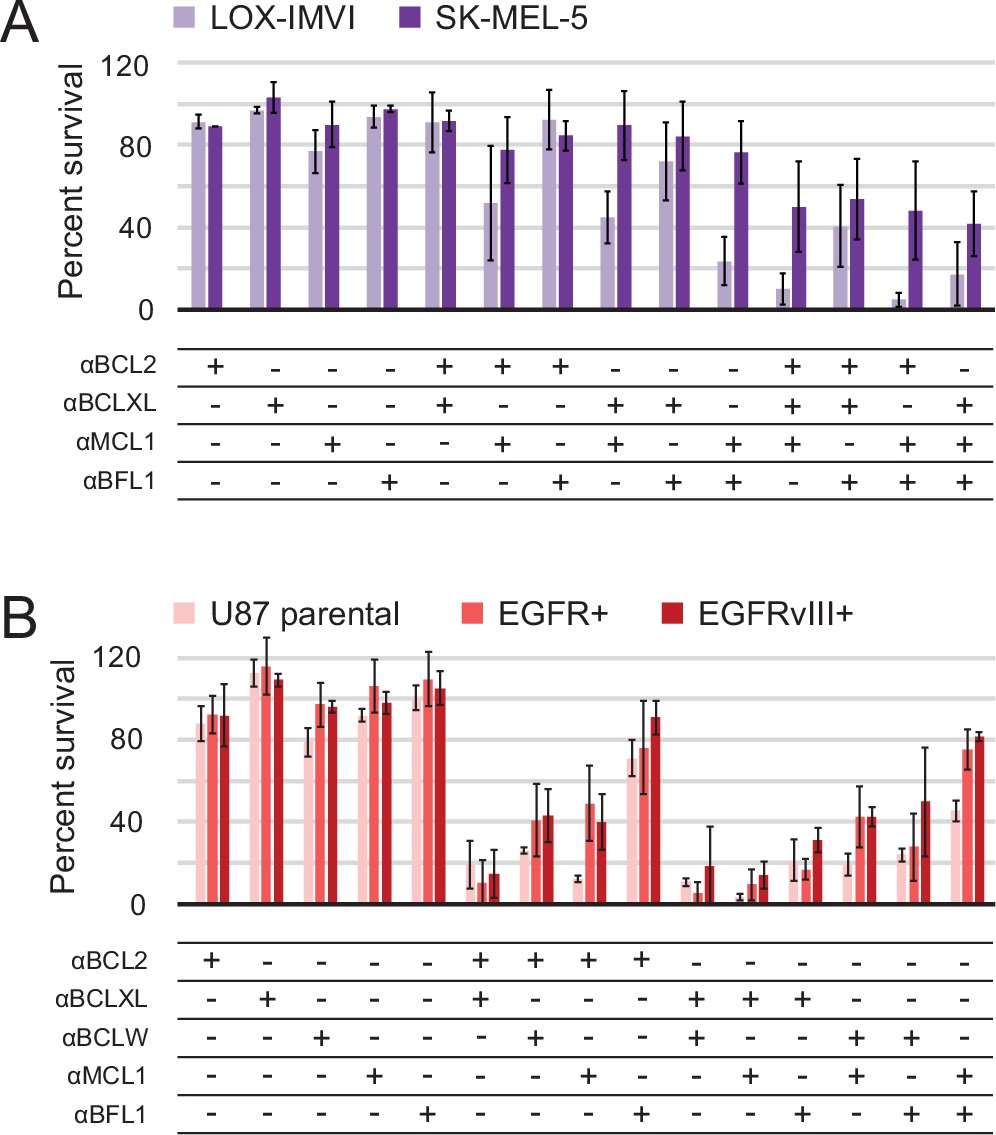
Determination of functional BCL2 profiles in melanoma and glioblastoma cell lines.
(A) Melanoma and (B) glioblastoma cell lines were transduced with constructs for designed inhibitor expression and viability was assayed after 72 hr (mean ± SD; for melanoma, n = 2 to 4; for glioblastoma, n = 4). See also Figure 9—figure supplement 1D for Western blot analysis of pro-survival proteins.
-
Figure 8—source data 1
Source data relating to Figure 8.
Survival assays for melanoma and glioblastoma. For each experiment, three technical replicates were averaged and normalized to the negative control (empty virus). The average and standard deviation were calculated using these values from independent experiments (experimental replicates).
- https://doi.org/10.7554/eLife.20352.022
Figure 9 with 1 supplement
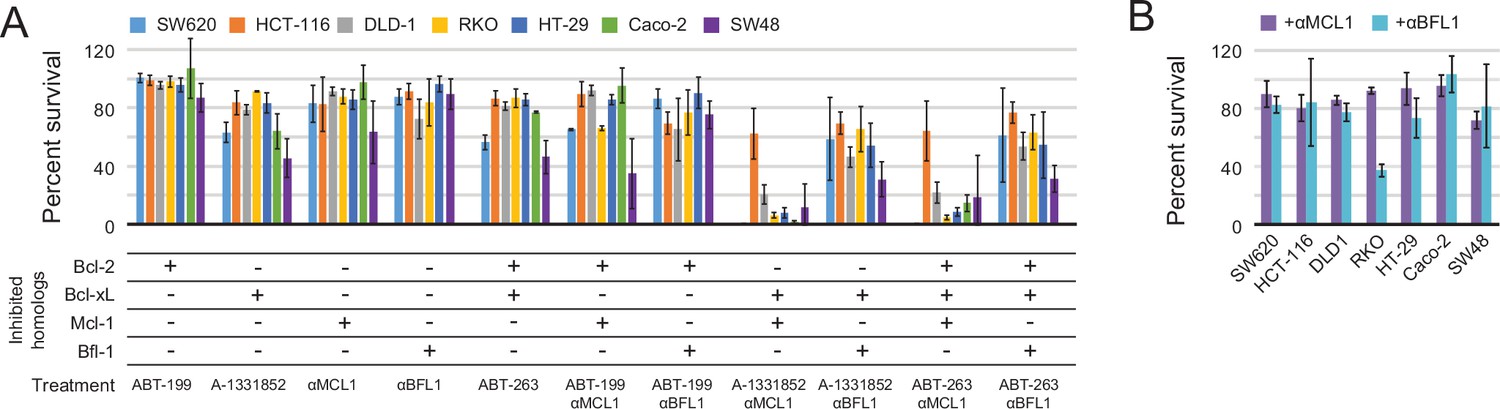
Determination of functional BCL2 profiles in colon cancer cell lines.
(A) Colon cancers were treated with small molecule drugs (2 µM) and/or doxycycline to induce expression of designed inhibitors, as indicated, and viability was assayed after 24 hr (mean ± SD; n = 3). (B) Long-term survival was assessed after seven to ten days of doxycycline-induced expression of αMCL1 or αBFL1 (mean ± SD; n = 3).
-
Figure 9—source data 1
Source data relating to Figure 9 and Figure 9—figure supplement 1.
Short- and long-term survival assay for colon cancers. For short-term assays, all values have been normalized to the negative control (DMSO in media, equivalent to DMSO concentration diluted from small molecule stock solution). For long-term survival assays, all values have been normalized to uninduced (no doxycycline) negative control.
- https://doi.org/10.7554/eLife.20352.024
Figure 9—figure supplement 1
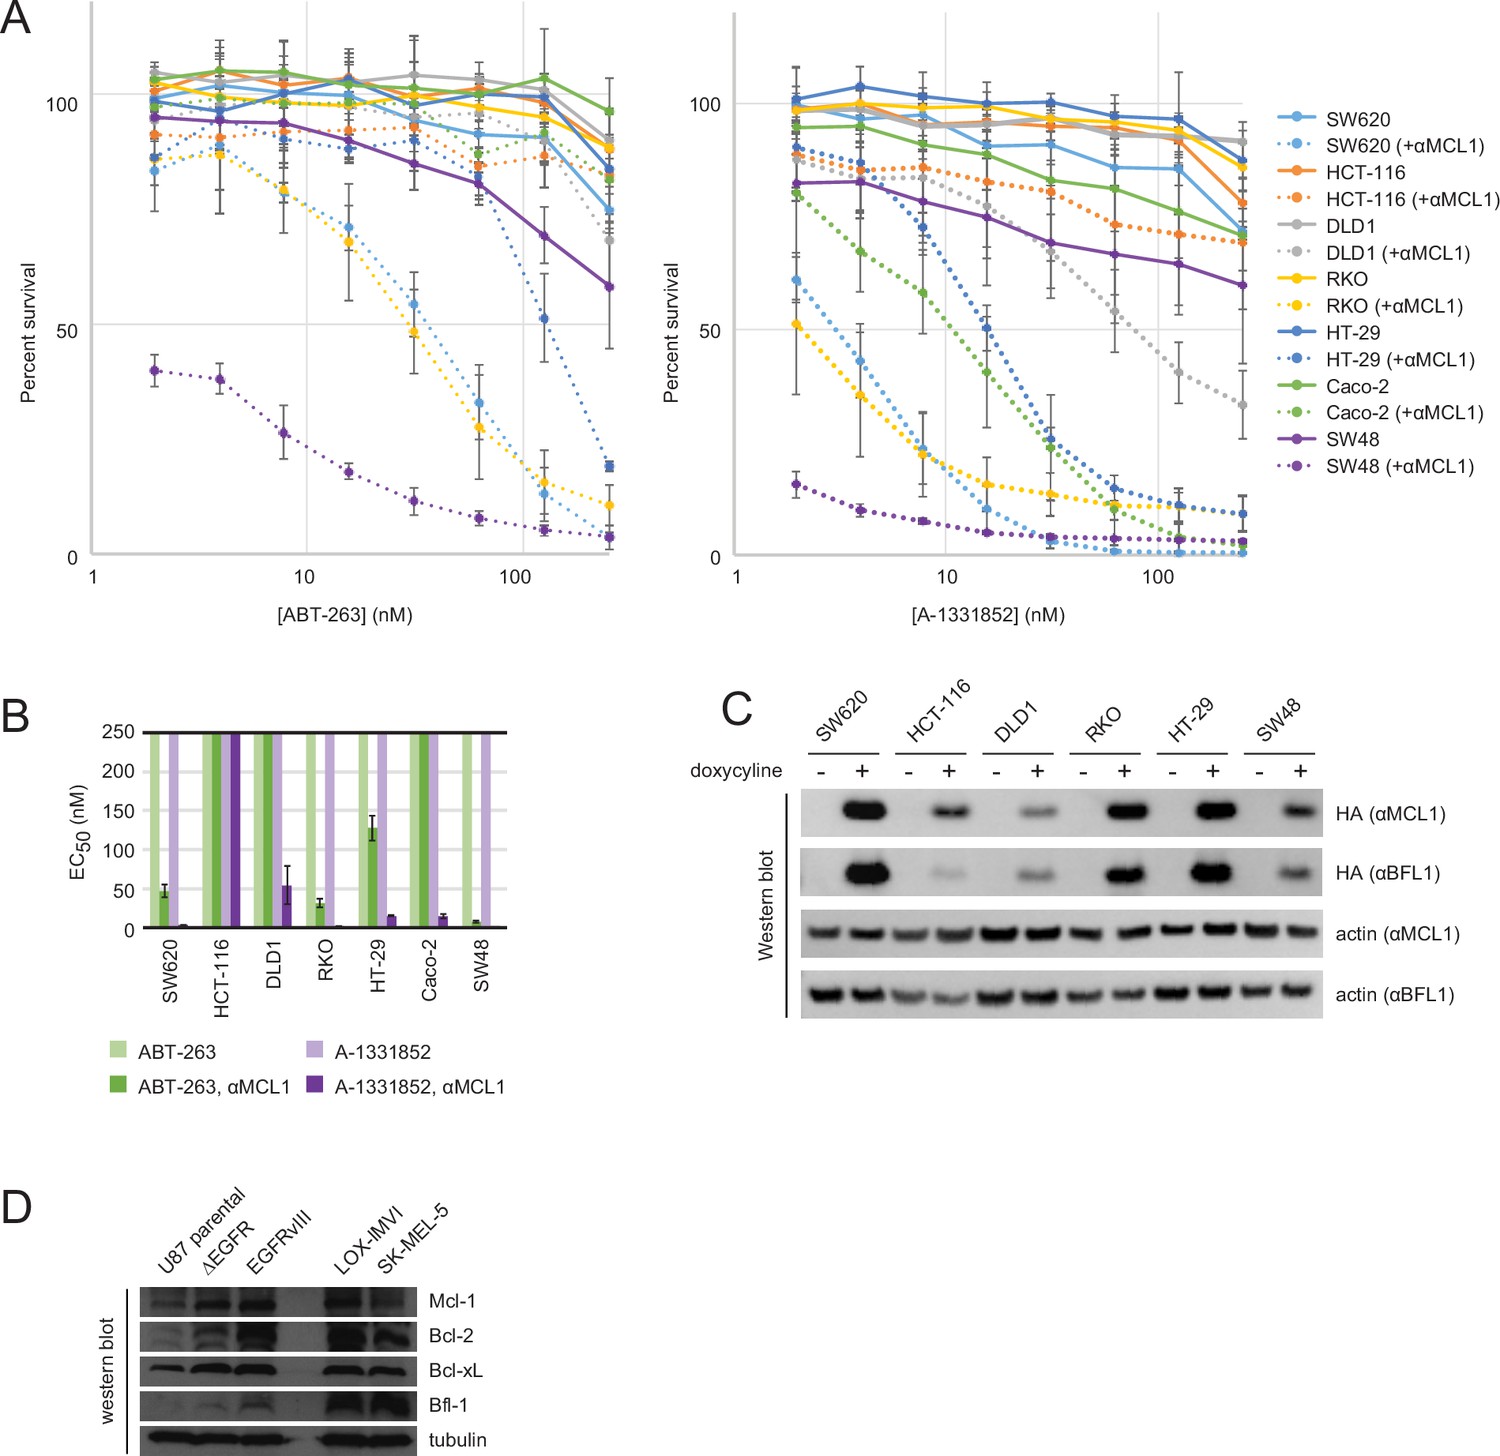
Drug titrations and long-term survival assays in colon cancers.
(A) Drug titrations for EC50 determination of ABT-263 and A-1331852 in colon cancer lines, with (dotted lines) and without (solid lines) expression of αMCL1 (mean ± SD, n = 3). (B) Long-term survival of colon cancers was assayed by counting colonies after seven to ten days of doxycycline-induced expression of αMCL1 or αBFL1 (mean ± SD, n = 3). (C) Western blotting confirms expression of HA-tagged αMCL1 and αBFL1 in transformed cell lines (actin loading control). (D) Western blotting assays expression of pro-survival proteins in glioblastoma and melanoma cell lines.
Additional files
-
Supplementary file 1
Data tables.
(A) Summary of computational designs selected for protein production and biochemical analysis. (B) Sequences of computational designs and optimized variants. (C) Crystallographic data collection and refinement statistics. (D) Protein cross-linking of the αMCL1-Mcl-1 complex. (E) Sort conditions for all in vitro evolution experiments. (F) Mutation summary for evolved variants.
- https://doi.org/10.7554/eLife.20352.026
-
Supplementary file 2
CDP design models.
PDB models of all computationally designed proteins (CDPs). Please see Supplementary file 1A for descriptions and computational statistics.
- https://doi.org/10.7554/eLife.20352.027
Download links
A two-part list of links to download the article, or parts of the article, in various formats.
Downloads (link to download the article as PDF)
Open citations (links to open the citations from this article in various online reference manager services)
Cite this article (links to download the citations from this article in formats compatible with various reference manager tools)
Computationally designed high specificity inhibitors delineate the roles of BCL2 family proteins in cancer
eLife 5:e20352.
https://doi.org/10.7554/eLife.20352


