Neurogliaform cortical interneurons derive from cells in the preoptic area
- University of Geneva, Switzerland
Figures
Figure 1
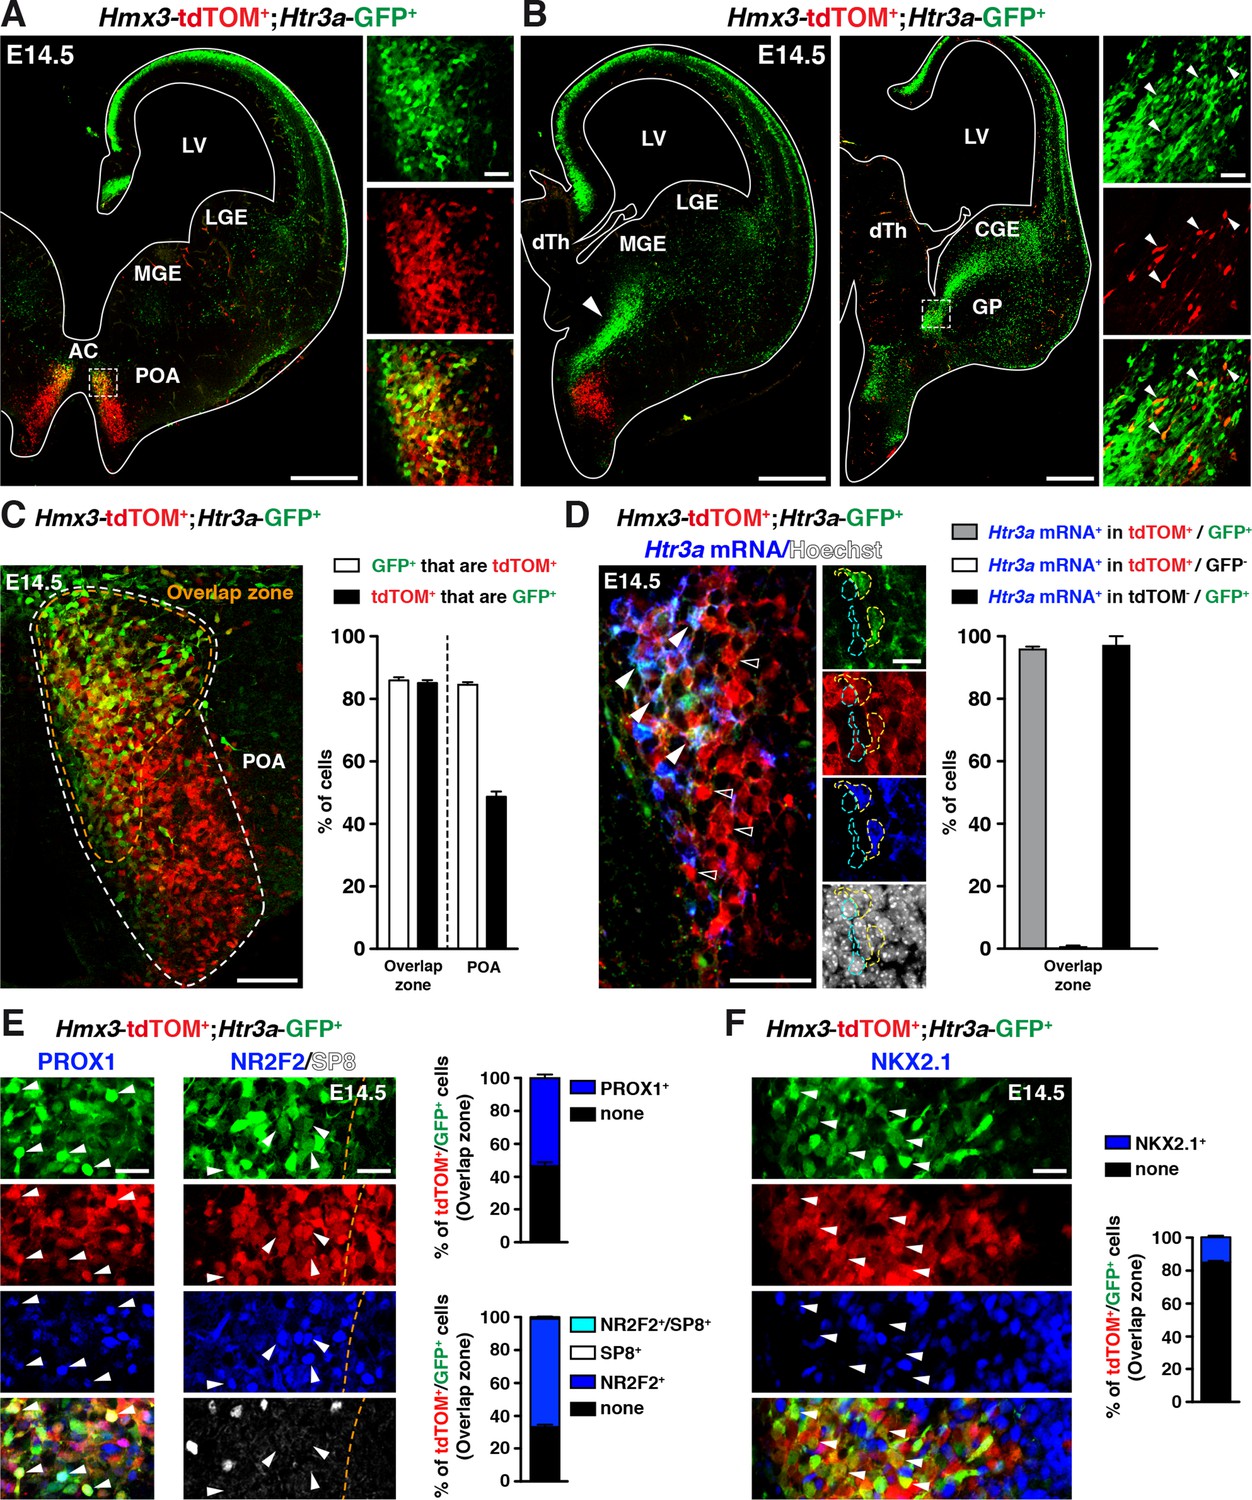
A fraction of 5-HT3AR-expressing interneurons (INs) originates from Hmx3-derived cells in the preoptic area (POA) and expresses transcription factors related to the caudal ganglionic eminence (CGE).
(A) At E14.5, tdTOM specifically labels cells expressing Hmx3 (Hmx3; tdTOM+). Htr3a-GFP+ INs co-label with tdTOM in a rostral region of the POA (dashed lines; high magnified images) located ventrally to the anterior commissure (AC). (B) At more caudal levels, Hmx3; tdTOM+/Htr3a-GFP+ embryonic cells appear to further migrate caudally (arrowhead) towards the CGE. High magnified images show Hmx3; tdTOM+/Htr3a-GFP+ cells entering the ventral CGE (dashed lines). (C) More than 80% of Hmx3; tdTOM+ cells co-label with Htr3a-GFP (and conversely) in the overlap zone (orange dashed line) of the POA domain defined by Hmx3; tdTOM recombination (white dashed line). (D) In situ hybridization showing that almost all Hmx3; tdTOM+/Htr3a-GFP+ INs in the POA express the Htr3a mRNA (arrowheads; yellow outline), whereas Hmx3; tdTOM+ cells do not (empty arrowheads; cyan outline). (E) In the overlap zone of the POA, IHC reveals that Hmx3; tdTOM+/Htr3a-GFP+ embryonic cells express (arrowheads) the CGE-enriched transcription factors PROX1 (left) and NR2F2 but not SP8 (right). (F) By contrast, the vast majority of Hmx3; tdTOM+/Htr3a-GFP+ INs do not express NKX2.1 (arrowheads). dTh: dorsal thalamus, GP: globus pallidus, LGE: lateral ganglionic eminence, LV: lateral ventricle, MGE: medial ganglionic eminence. Scale bars: 300 µm in A, B: low magnified images; 100 µm in C, D: low magnified images; 50 µm in A, B: high magnified images; 25 µm in E, F; 10 µm in D: high magnified images.
-
Figure 1—source data 1
Detailed counts of cells quantified in Figure 1 in the different experimental conditions.
- https://doi.org/10.7554/eLife.32017.004
Figure 2 with 3 supplements
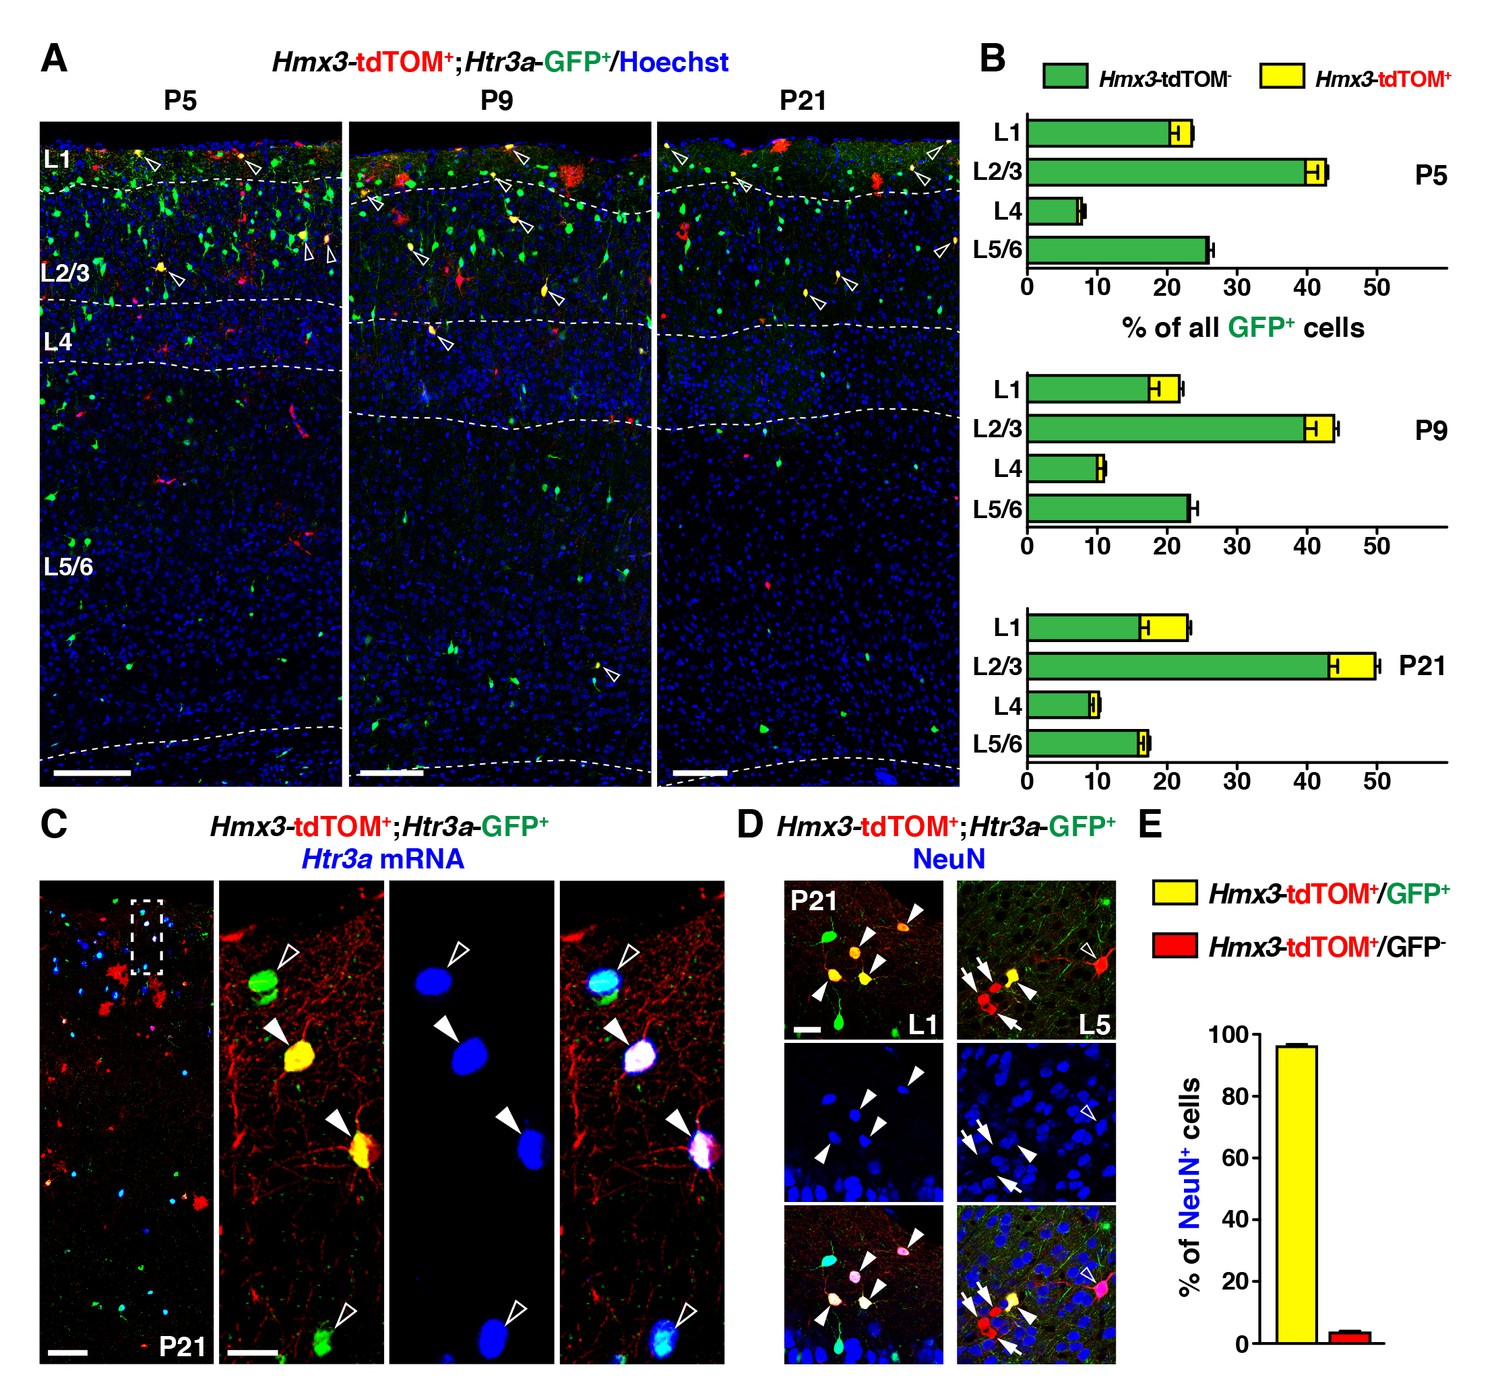
During the postnatal period, Hmx3-derived cells from the preoptic area (Gelman et al., 2009) constitute a small but persistent fraction of 5-HT3AR-expressing interneurons (INs) (Lee et al., 2010) in superficial cortical layers.
(A–B) Hmx3; tdTOM+/Htr3a-GFP+ cells represent a fraction of Htr3a-GFP+ INs that increases along postnatal ages P5 (left), P9 (middle) and P21 (right). Note that double-labeled cells (open arrowheads) are mainly located in superficial cortical layers. (C) In situ hybridization showing that, at P21, Htr3a mRNA is found in cortical Hmx3; tdTOM+/Htr3a-GFP+ INs (arrowheads) as in Htr3a-GFP+ INs (open arrowheads). (D–E) Hmx3; tdTOM+/Htr3a-GFP+ cells largely express the neuronal marker NeuN (arrowheads) whereas those negative for Htr3a-GFP only rarely do (arrows, open arrowhead). Scale bars: 100 µm in A, C: low magnified images; 25 µm in C: high magnified images, D.
-
Figure 2—source data 1
Detailed counts of cells quantified in Figure 2 in the different experimental conditions.
- https://doi.org/10.7554/eLife.32017.010
Figure 2—figure supplement 1
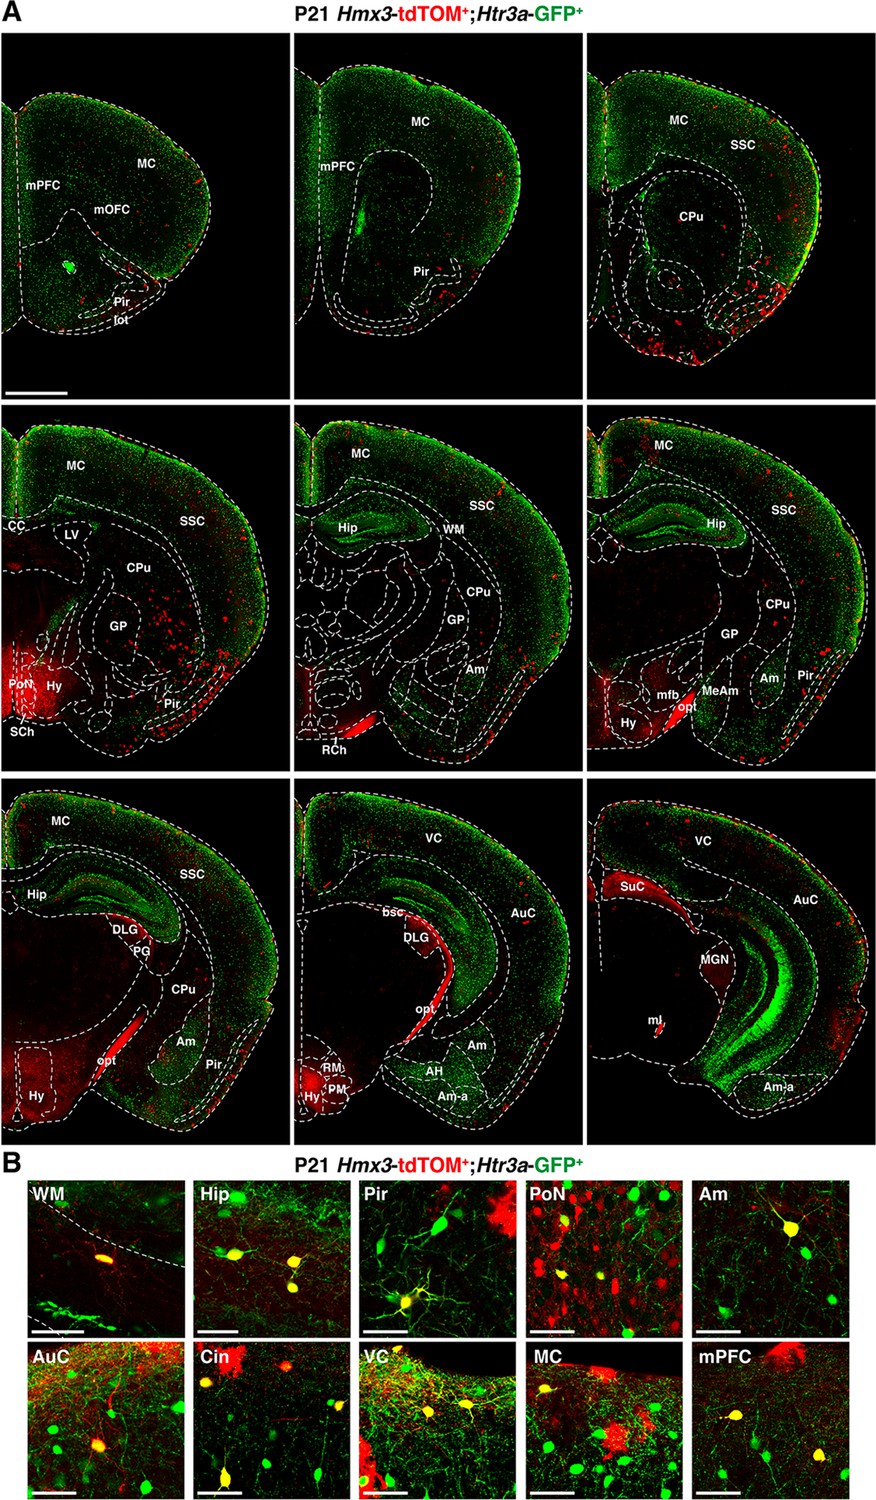
Rostro-caudal distribution of Hmx3; tdTOM+/Htr3a-GFP+ cells at P21.
(A) Hmx3; tdTOM+/Htr3a-GFP+ cells are observed in a variety of cortical areas as well as other brain regions including the hippocampus (Hip) and the amygdala (Am) (B) High magnified images showing Hmx3; tdTOM+/Htr3a-GFP+ cells in various brain regions. AH: amygdalo-hippocampal area, Am-a: amygdaloid areas, AuC: auditory cortex, bsc: brachius of the superior colliculus, CC: corpus callosum, CPu: caudate putamen (striatum), DLG: dorso-lateral geniculate nucleus, GP: globus pallidus, Hy: hypothalamus, lot: lateral olfactory tract, LV: lateral ventricle, MC: motor cortex, MeAm: medial amygdala, mfb: medial forebrain boundle, ml: medial lemniscus, MGN: medial geniculate nucleus, mOFC: medial orbitofrontal cortex, mPFC: medial prefrontal cortex, opt: optic tract, PG: progeniculate nucleus, Pir: piriform cortex, PM: pre-mamillary nuclei, PoN: preoptic nucleus, RCh: retrochiasmatic area, RM: retro-mamillary nuclei, SCh: suprachiasmatic nucleus, SSC: somatosensory cortex, SuC: superior colliculus (optic nerve layer and superficial grey layer), VC: visual cortex, WM: white matter. Scale bars: 5 mm in A; 50 µm in B.
Figure 2—figure supplement 2

At postnatal ages, Hmx3; tdTOM+/Htr3a-GFP+ cells are rarely observed in the preoptic nuclei (PoN), the subpallial brain region corresponding to the embryonic preoptic area.
(A–B) Hmx3; tdTOM+ cells negative for Htr3a-GFP are present in PoN at P5 (A), and P21 (B) where rare Hmx3; tdTOM+/Htr3a-GFP+ were found (high magnified images). AC: anterior commissure. Scale bars: 300 µm in A, B: low magnified images; 50 µm in A, B: high magnified images.
Figure 2—figure supplement 3
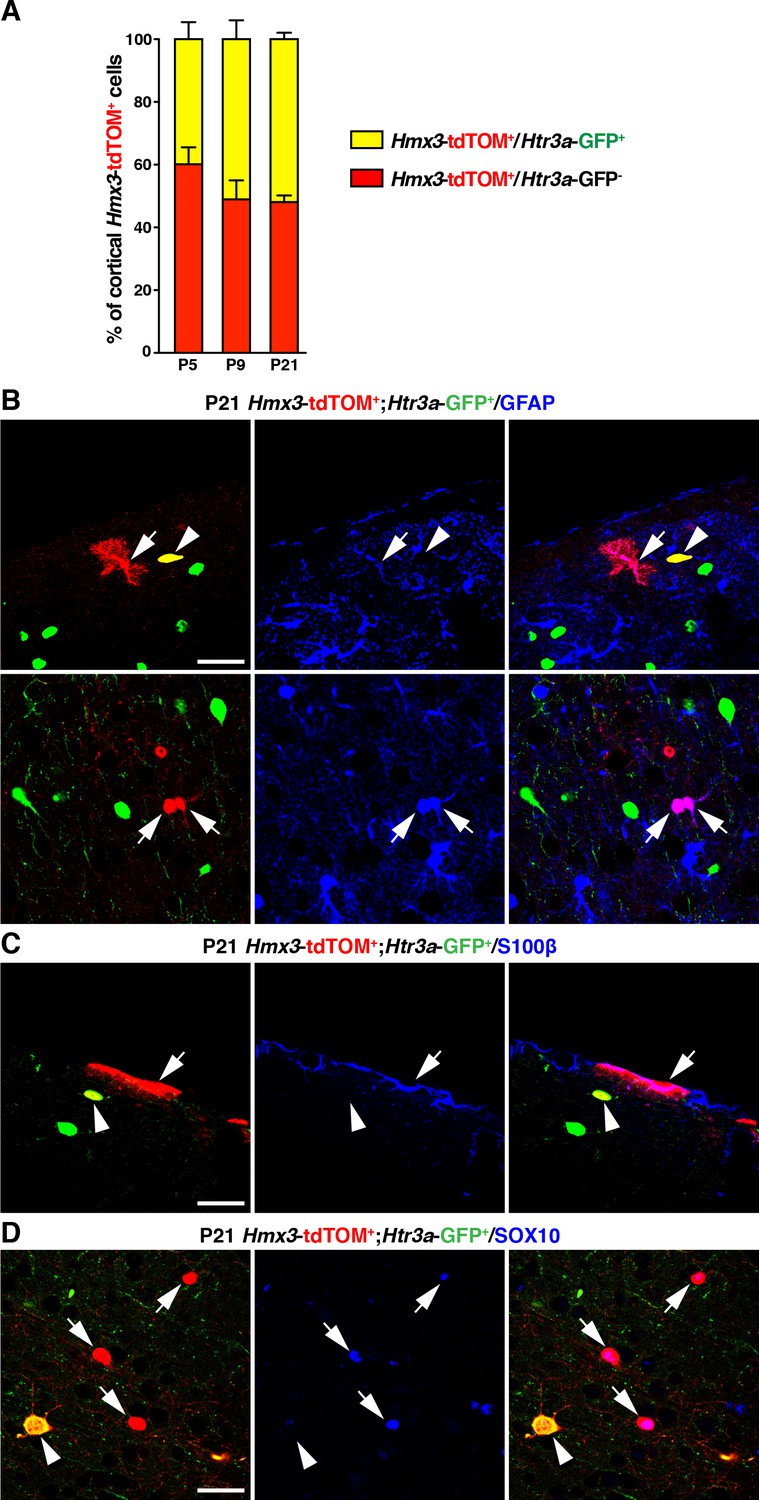
Hmx3; tdTOM+ cells negative for Htr3a-GFP often express glial markers.
(A) The fraction of Hmx3; tdTOM+ cells negative for Htr3a-GFP is relatively stable across postnatal ages. (B–D) Hmx3; tdTOM+ cells negative for Htr3a-GFP express the astrocytic markers GFAP (B; arrows), S100β (C; arrow) and the oligodendrocytic transcription factor SOX10 (D; arrows). In contrast, Hmx3; tdTOM+/Htr3a-GFP+ cells are negative for these markers (B-D; arrowheads). Scale bar: 50 µm in B, C, D.
-
Figure 2—figure supplement 3—source data 1
Detailed counts of cells quantified in Figure 2—figure supplement 3 in the different experimental conditions.
- https://doi.org/10.7554/eLife.32017.009
Figure 3 with 1 supplement
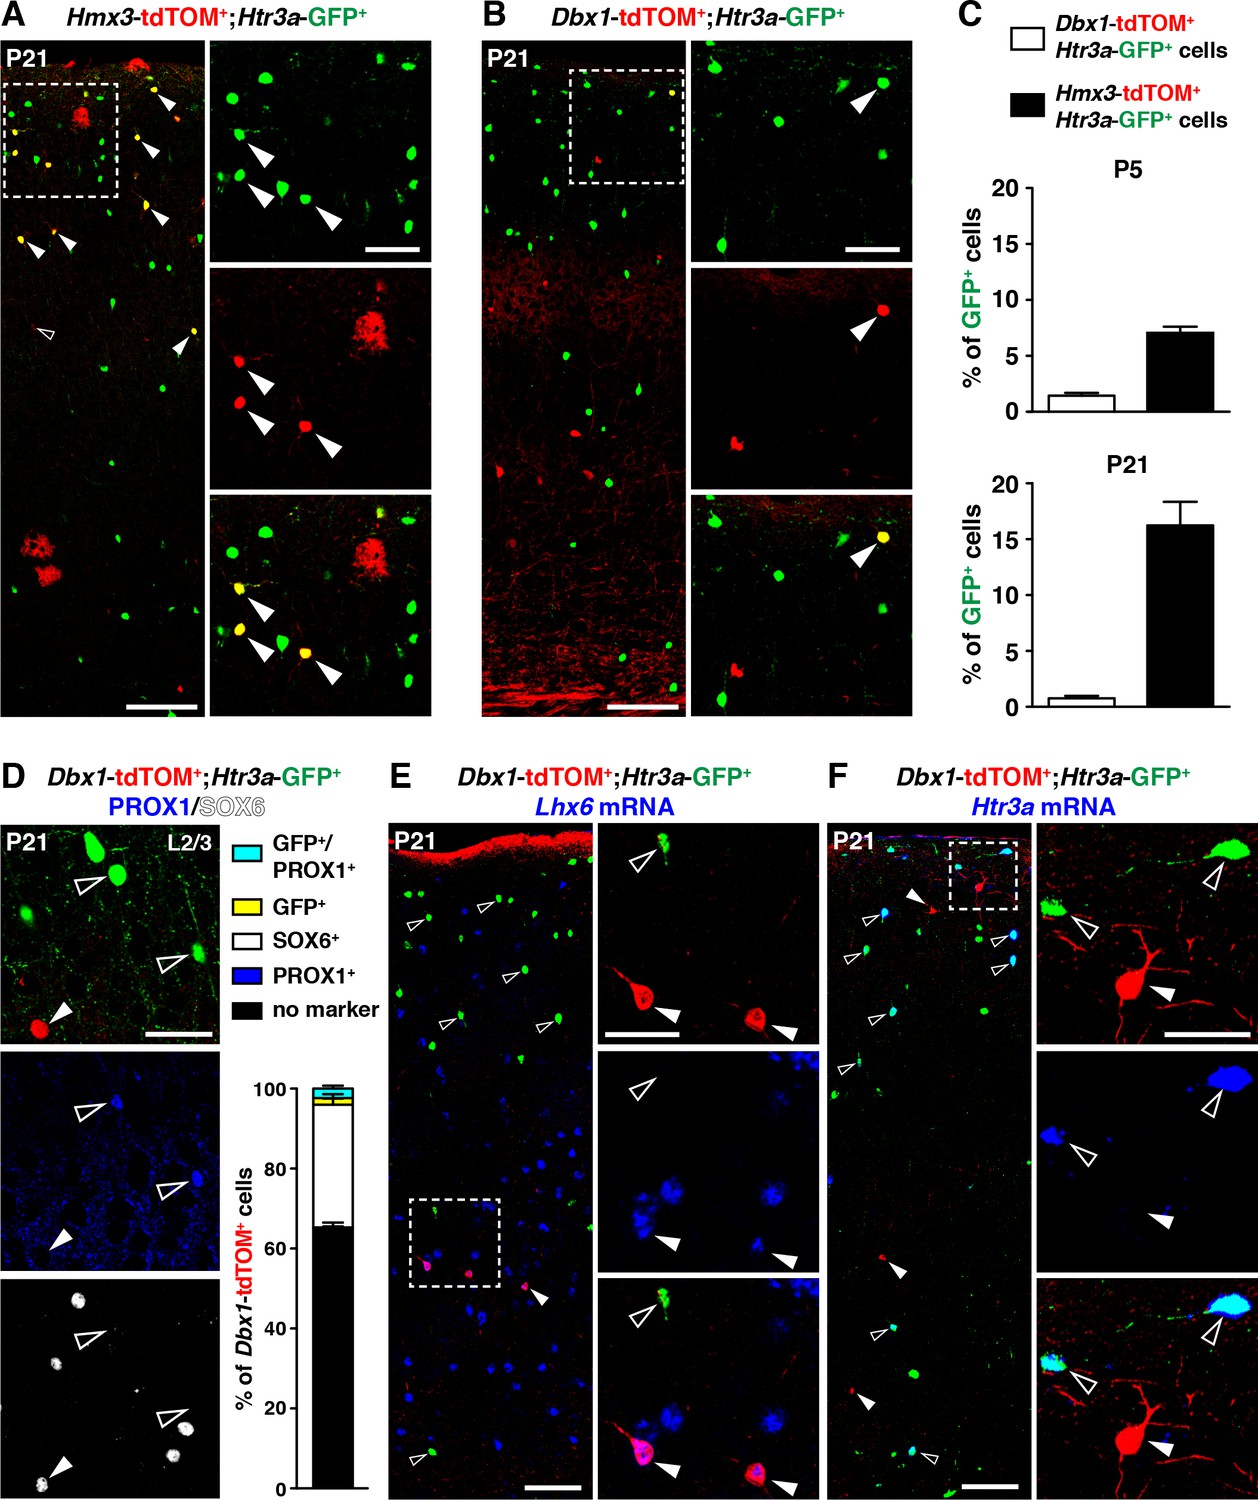
5-HT3AR-expressing interneurons (INs) largely originate from Hmx3+ but not Dbx1+ cells.
(A–C) A consistent fraction of cortical Htr3a-GFP+ INs co-labels with Hmx3; tdTOM (A, arrowheads) at P5 and P21, whereas only a minimal fraction does with Dbx1; tdTOM (B, arrowhead). (D) Dbx1; tdTOM+ INs express the MGE-enriched TF SOX6 (arrowhead) but not the CGE-enriched TF PROX1 (open arrowheads). Only a minimal fraction of Dbx1; tdTOM+ co-labelled for Htr3a-GFP, among which the majority were PROX1+. (E–F) In situ hybridization showing that Dbx1; tdTOM+ INs express the transcript for the MGE-enriched TF Lhx6 (E, arrowheads) whereas Htr3a-GFP+ INs do not (E, open arrowheads). In contrast, Dbx1; tdTOM+ INs do not express the Htr3a transcript (F, arrowheads) whereas Htr3a-GFP+ INs do (F, open arrowheads). Scale bars: 100 µm in A, B, E, F: low magnified images; 50 µm in A, B, D, E, F: high magnified images.
-
Figure 3—source data 1
Detailed counts of cells quantified in Figure 3 in the different experimental conditions.
- https://doi.org/10.7554/eLife.32017.013
Figure 3—figure supplement 1

Interneurons (INs) derived from Dbx.1+ cells express MGE-enriched markers.
(A–B) Dbx1; tdTOM+ cells negative for Htr3a-GFP express the neurochemical markers somatostatin (SST) (A, arrowheads) and parvalbumin (PV) (B, arrowheads). WM: white matter. Scale bars: 100 µm in A, B: low magnified images; 50 µm in A, B: high magnified images.
Figure 4 with 1 supplement
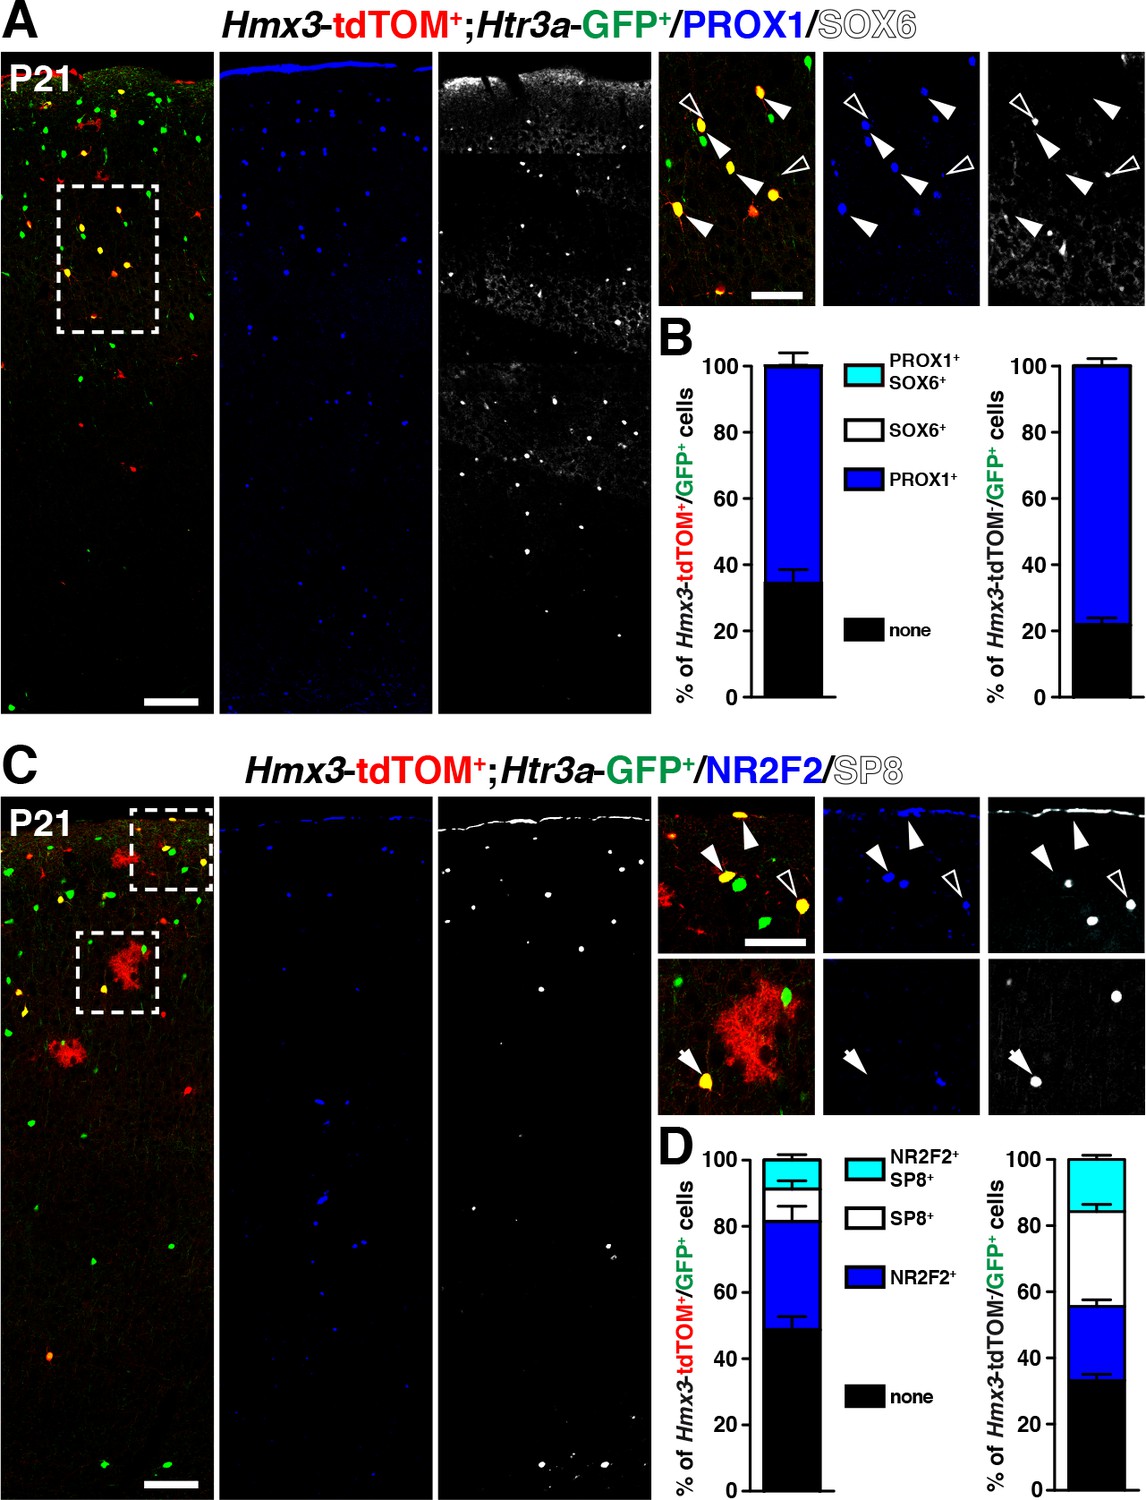
Hmx3; tdTOM+/Htr3a-GFP+ cortical interneurons (INs) express markers related to the CGE but not to the MGE.
(A–B) Hmx3; tdTOM+/Htr3a-GFP+ INs express the CGE-enriched TF PROX1 (A; arrowheads) but not the MGE-related TF SOX6 (A; open arrowheads) similarly to Htr3a-GFP+ INs that do not derive from Hmx3+ cells (B, right graph). (C–D) Hmx3; tdTOM+/Htr3a-GFP+ cells express the CGE-enriched TFs NR2F2 (arrowheads) and (open arrowheads)/or SP8 (arrow). Htr3a-GFP+ derived from Hmx3+ cells are biased towards NR2F2 expression, in comparison to Htr3a-GFP+ INs that do not co-label with Hmx3; tdTOM (D, blue bars). Scale bars: 100 µm in A, C: low magnified images; 50 µm in A, C: high magnified images.
-
Figure 4—source data 1
Detailed counts of cells quantified in Figure 4 in the different experimental conditions.
- https://doi.org/10.7554/eLife.32017.016
Figure 4—figure supplement 1
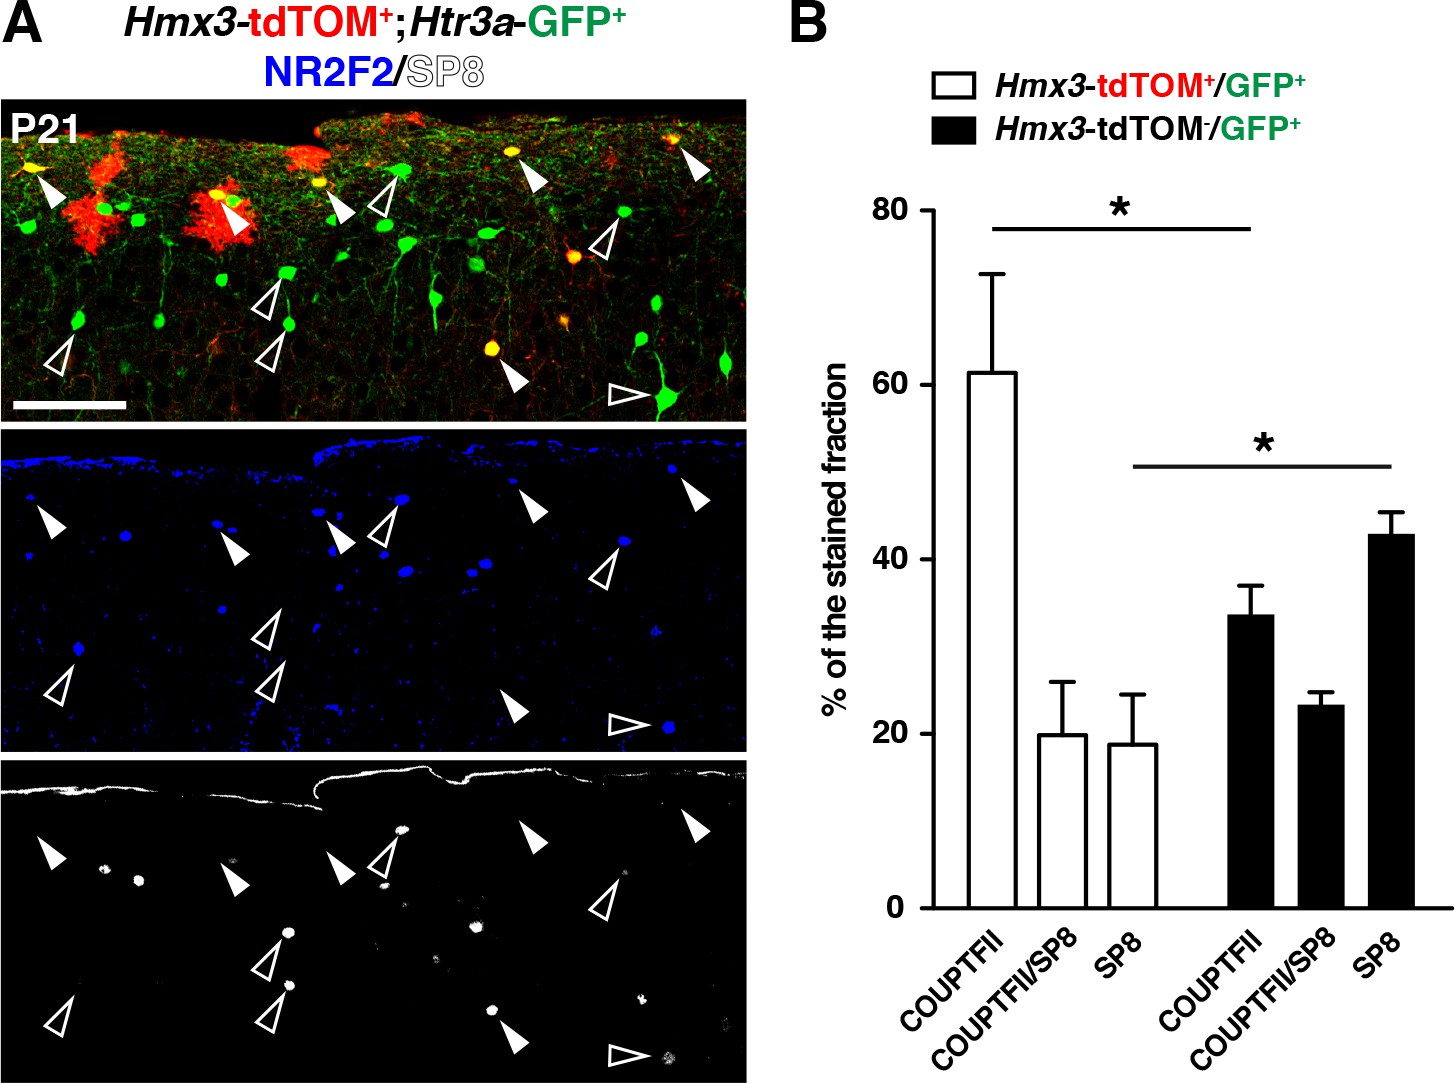
Hmx3; tdTOM+/Htr3a-GFP+ cortical interneurons (INs) display a combinatorial expression of NR2F2 and SP8 that is biased toward NR2F2.
(A) Hmx3; tdTOM+/Htr3a-GFP+ INs (A; arrowheads) express significantly (one-way ANOVA; *p<0.05) more NR2F2 alone and less SP8 alone as compared to Htr3a-GFP+ INs negative for Hmx3; tdTOM (A; open arrowheads). Scale bar: 100 µm in A.
Figure 5 with 1 supplement
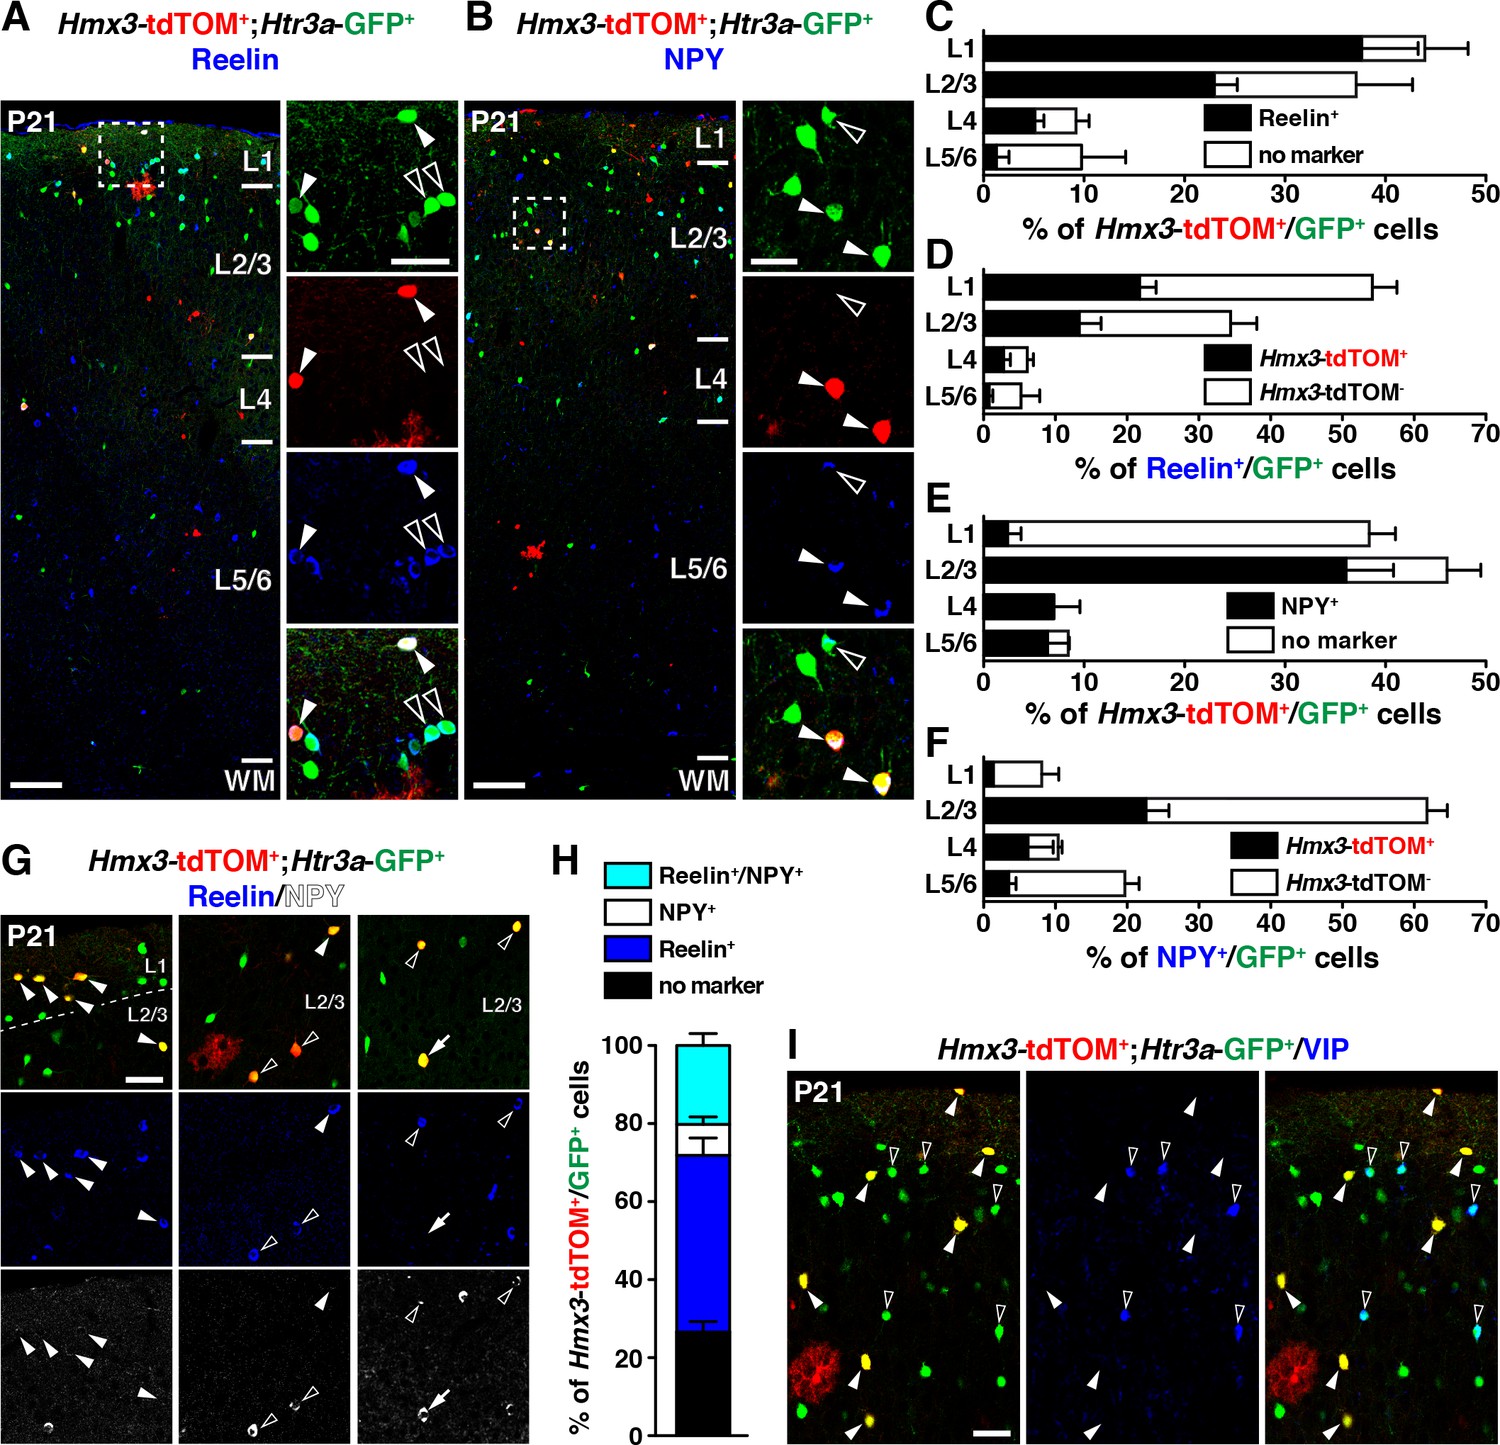
Hmx3; tdTOM+/Htr3a-GFP+ cortical interneurons (INs) express reelin and NPY but not VIP.
(A–F) Hmx3; tdTOM+/Htr3a-GFP+ INs are stained with the neurochemical markers reelin (A, arrowheads) and NPY (B, arrowheads) as well as Htr3a-GFP+ cells negative for Hmx3; tdTOM (open arrowheads). Note that reelin-positive Hmx3; tdTOM+/Htr3a-GFP+ INs are preferentially found in L1-3 (C) whereas NPY-expressing Hmx3; tdTOM+/Htr3a-GFP+ INs are mainly found in L2-6 (E). Hmx3; tdTOM+/Htr3a-GFP+ INs account for more than one third of all reelin-positive Htr3a-GFP+ (D) and of all NPY-positive Htr3a-GFP+ cells (F). (G–H) Hmx3; tdTOM+/Htr3a-GFP+ INs mainly express reelin (G, arrowheads) or reelin and NPY (G, open arrowheads) but to a smaller extend only NPY (G, arrow). (I) Hmx3; tdTOM+/Htr3a-GFP+ INs do not express VIP (arrowheads), whereas Htr3a-GFP+ INs negative for Hmx3; tdTOM do (open arrowheads). WM: white matter. Scale bars: 100 µm in A, B: low magnified images; 50 µm in A, B: high magnified images, G, I.
-
Figure 5—source data 1
Detailed counts of cells quantified in Figure 5 in the different experimental conditions.
- https://doi.org/10.7554/eLife.32017.019
Figure 5—figure supplement 1
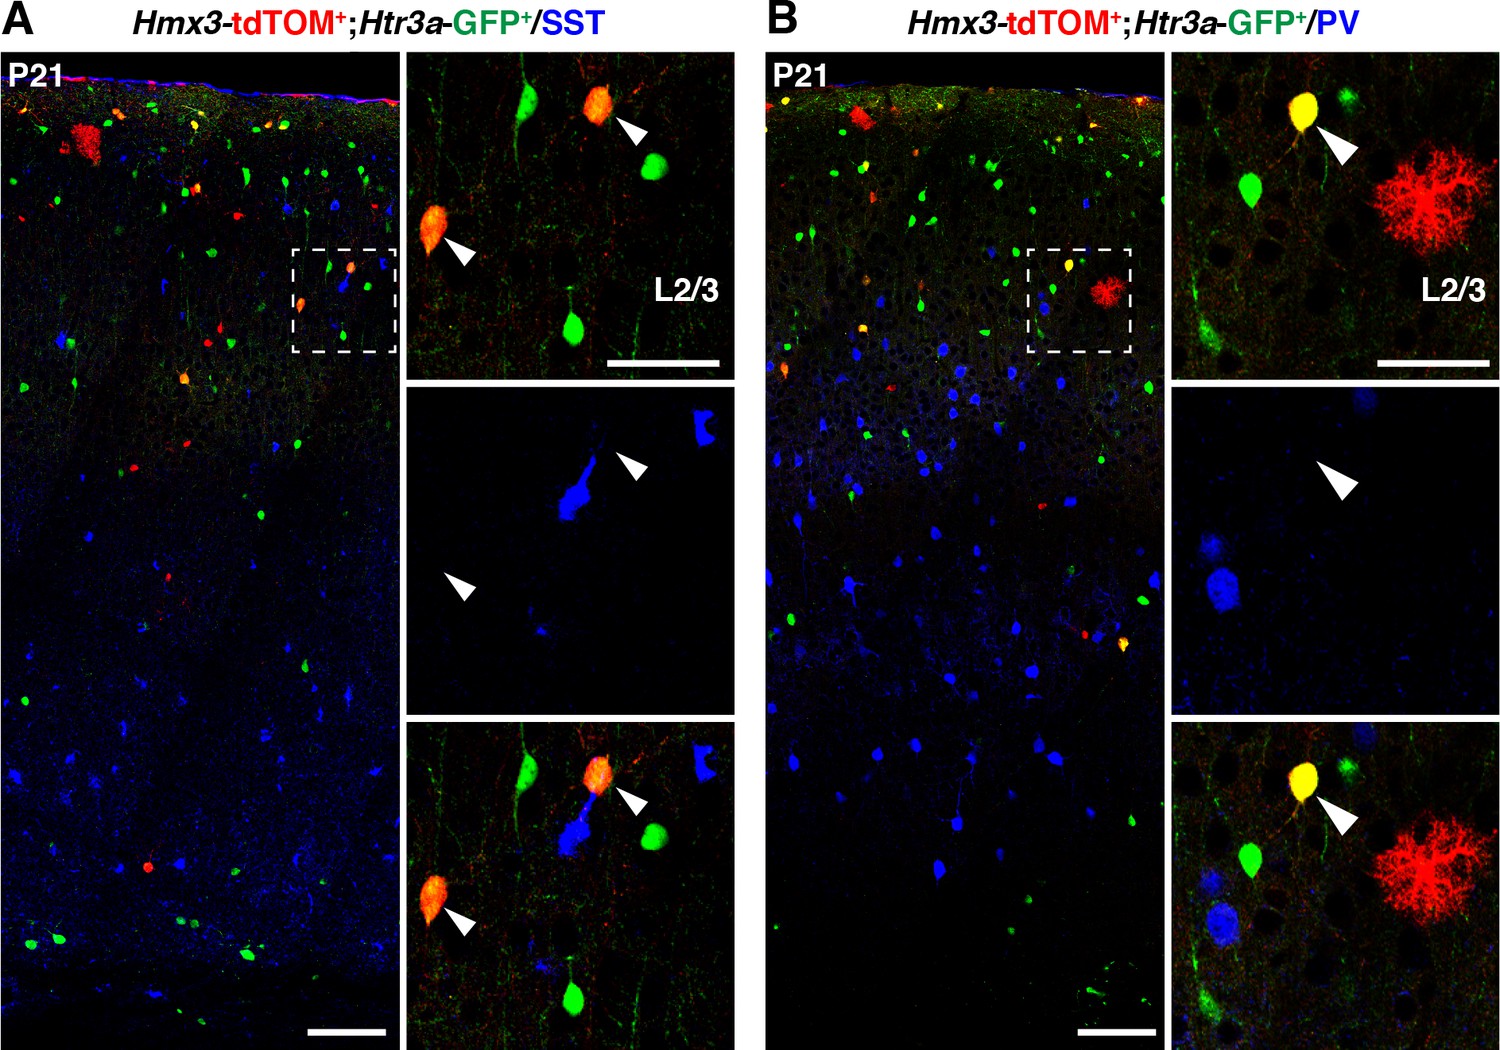
Hmx3; tdTOM+/Htr3a-GFP+ do not express MGE-enriched markers.
(A–B) Hmx3; tdTOM+/Htr3a-GFP+ cells do not express the neurochemical markers somatostatin (SST) (A, arrowheads) and parvalbumin (PV) (B, arrowheads). WM: white matter. Scale bars: 100 µm in A, B: low magnified images; 50 µm in A, B: high magnified images.
Figure 6 with 4 supplements
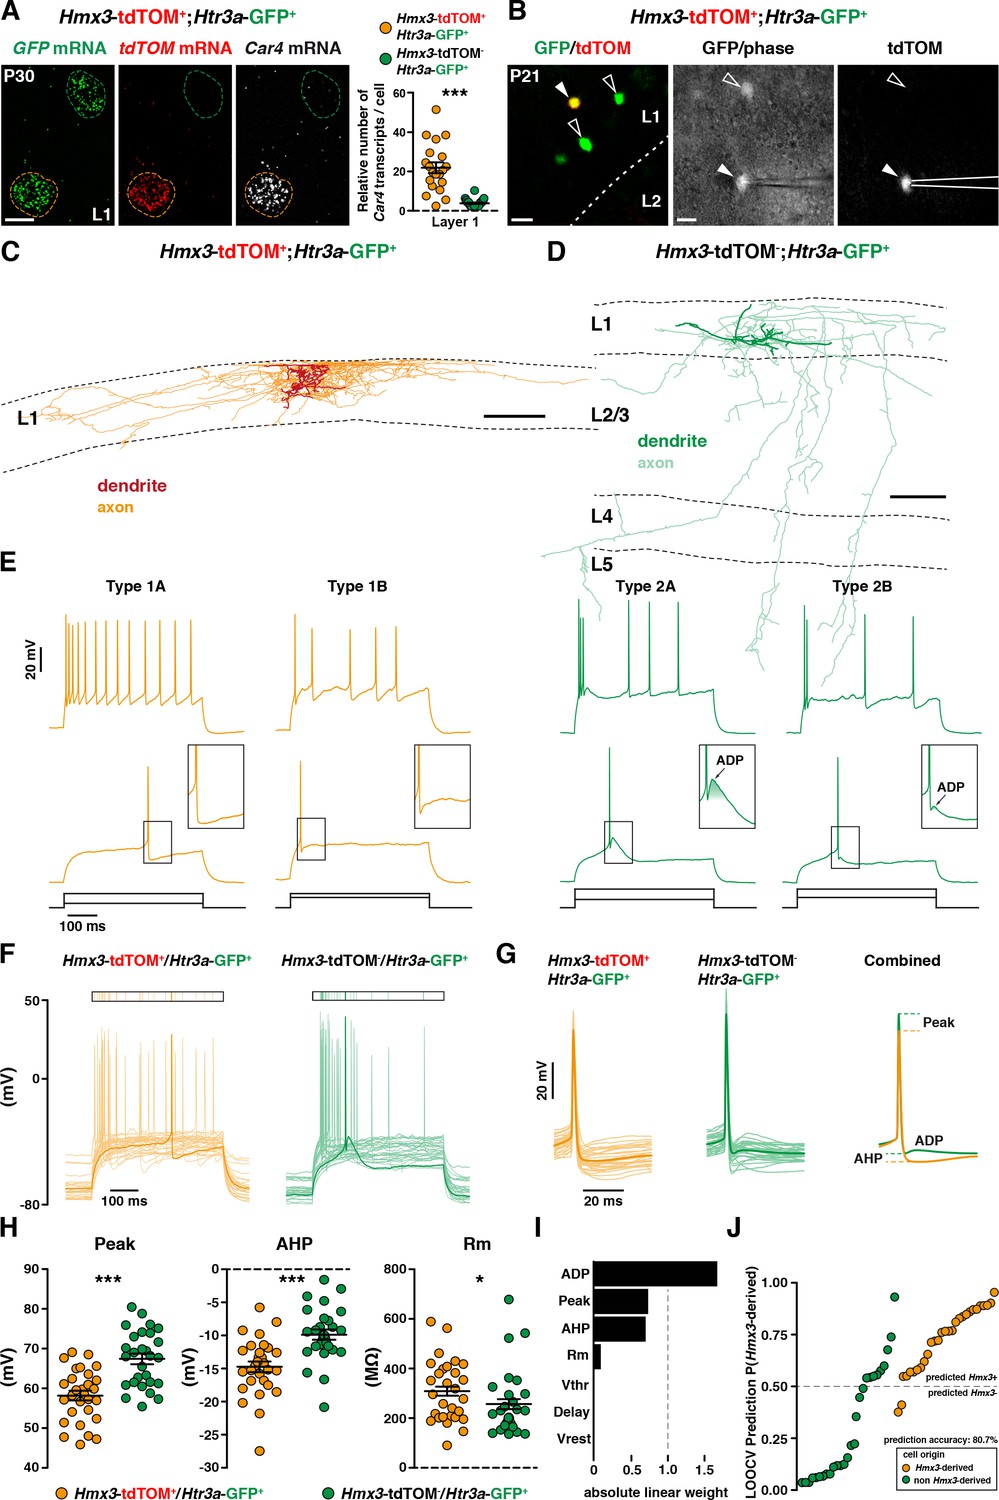
Hmx3; tdTOM+/Htr3a-GFP+ cortical interneurons (INs) in layer 1(L1) display the molecular, morphological and electrophysiological features of neurogliaform cells (NGCs).
(A) RNAscope multiplex fluorescent hybridization for tdTOM, GFP and Car4 transcripts on P30 brains showing that L1 Hmx3; tdTOM+/Htr3a-GFP+ INs express Car4 at significantly higher levels (orange outline) as compared to Htr3a-GFP+ INs negative for tdTOM (green outline) (***p<0.0001; Mann-Whitney test). (B) Example of a L1 Hmx3; tdTOM+/Htr3a-GFP+ cell (arrowhead) or Htr3a-GFP+ INs negative for tdTOM (open arrowheads) checked before patching (left image). Example of a patched Hmx3; tdTOM+/Htr3a-GFP+ IN (middle and right images, arrowhead). (C) Illustrative reconstruction of a Hmx3; tdTOM+/Htr3a-GFP+ IN in L1 displaying the characteristic morphology of an elongated NGC with dense axonal ramifications restricted to L1. (D) Illustrative reconstruction of a Htr3a-GFP+ IN negative for tdTOM in L1 displaying the characteristic morphology of single bouquet-like cell (SBC) with axonal ramifications extending deep into L5. (E) Illustrative traces from recorded Hmx3; tdTOM+/Htr3a-GFP+ INs (orange) and Htr3a-GFP+ INs negative for tdTOM (green), showing the first action potentials (APs) at rheobase and trains of APs at higher current injections. (F) Superimposed single AP traces at rheobase of all Hmx3; tdTOM+/Htr3a-GFP+ INs (orange) and Htr3a-GFP+ INs negative for tdTOM (green). Thick traces correspond to type 1A and type 2A examples in E. (G) Same traces as in (F), aligned to the AP, with a lower time scale. Thin lines are individual cell traces and thick lines are trace averages. The average traces on the right are aligned to the threshold potential (Vthr). (H) Plots of AP peak amplitude (Peak; ***p<0.0001; unpaired t-test), after hyperpolarization potential amplitude (AHP; ***p<0.0001; unpaired t-test) and membrane resistance (Rm; *p=0.0318; Mann-Whitney test) showing significant differences between the two cell types. (I) Absolute linear weights assigned by the classification model trained on all cells with standardized electrophysiological properties. (J) Prediction probabilities estimated by the classifier on the cell left out in the leave-one-out-cross-validation (LOOCV) loop. Cells are ordered on the x-axis by origin and prediction value, and the color code reflect their origin. Cells above the probability threshold 0.5 are more likely to be Hmx3-derived according to the model. Scale bars: 10 µm A; 20 µm in B; 100 µm C, D.
-
Figure 6—source data 1
Detailed counts of cells expressing Car4 quantified in Figure 6 in the different experimental conditions.
- https://doi.org/10.7554/eLife.32017.025
-
Figure 6—source data 2
Electrophysiological properties of cells quantified in Figure 6.
- https://doi.org/10.7554/eLife.32017.026
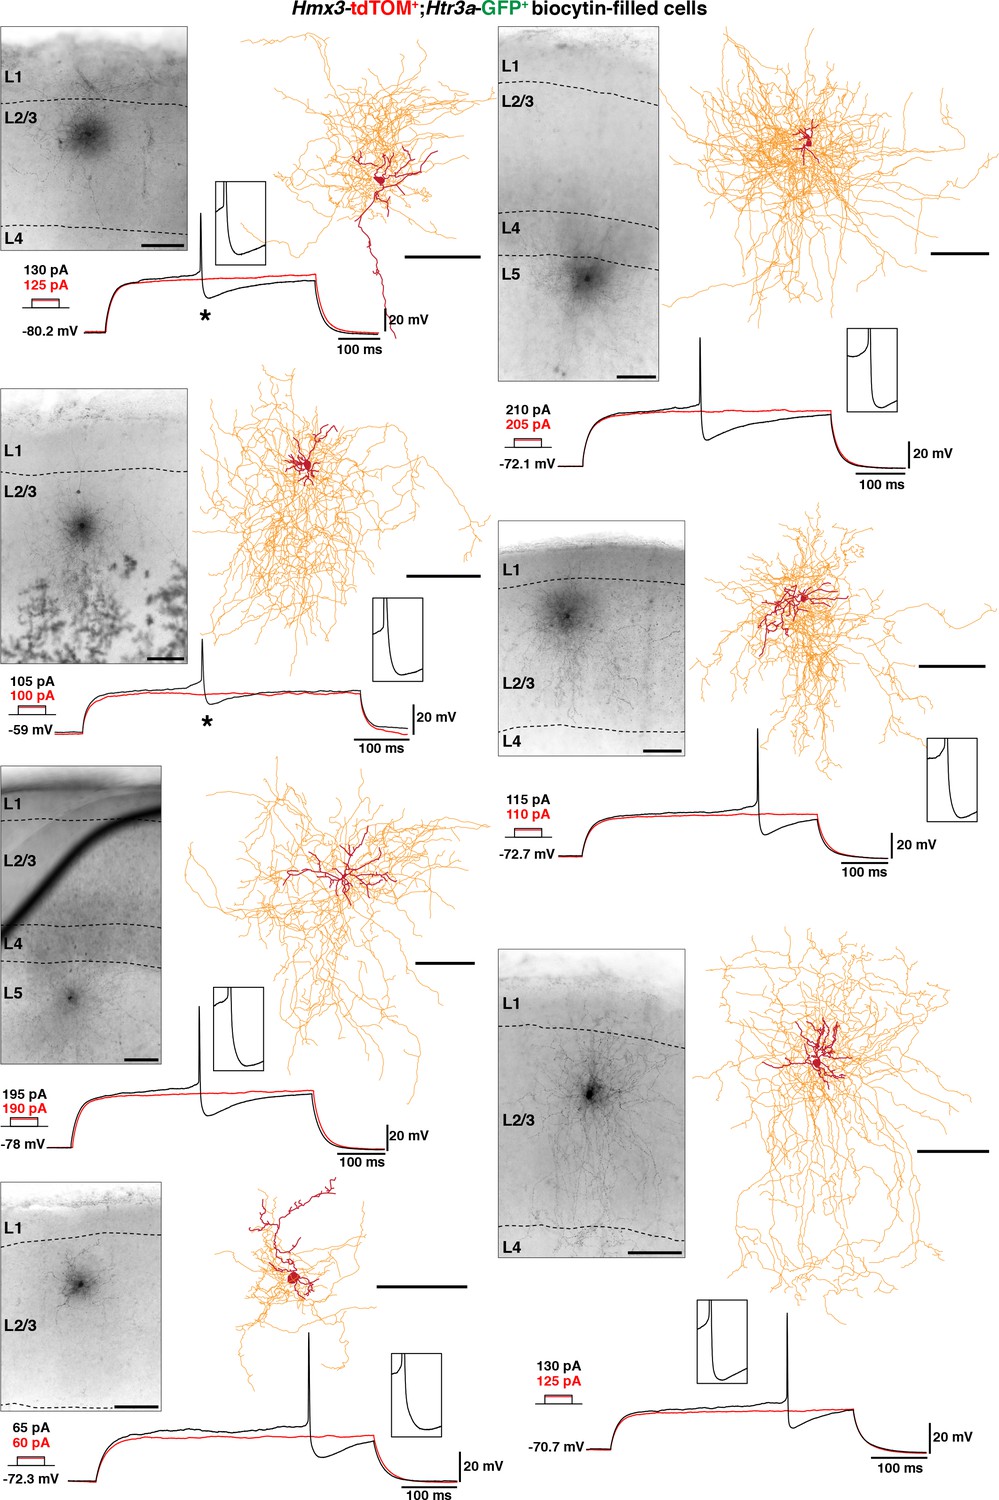
Figure 6—figure supplement 1
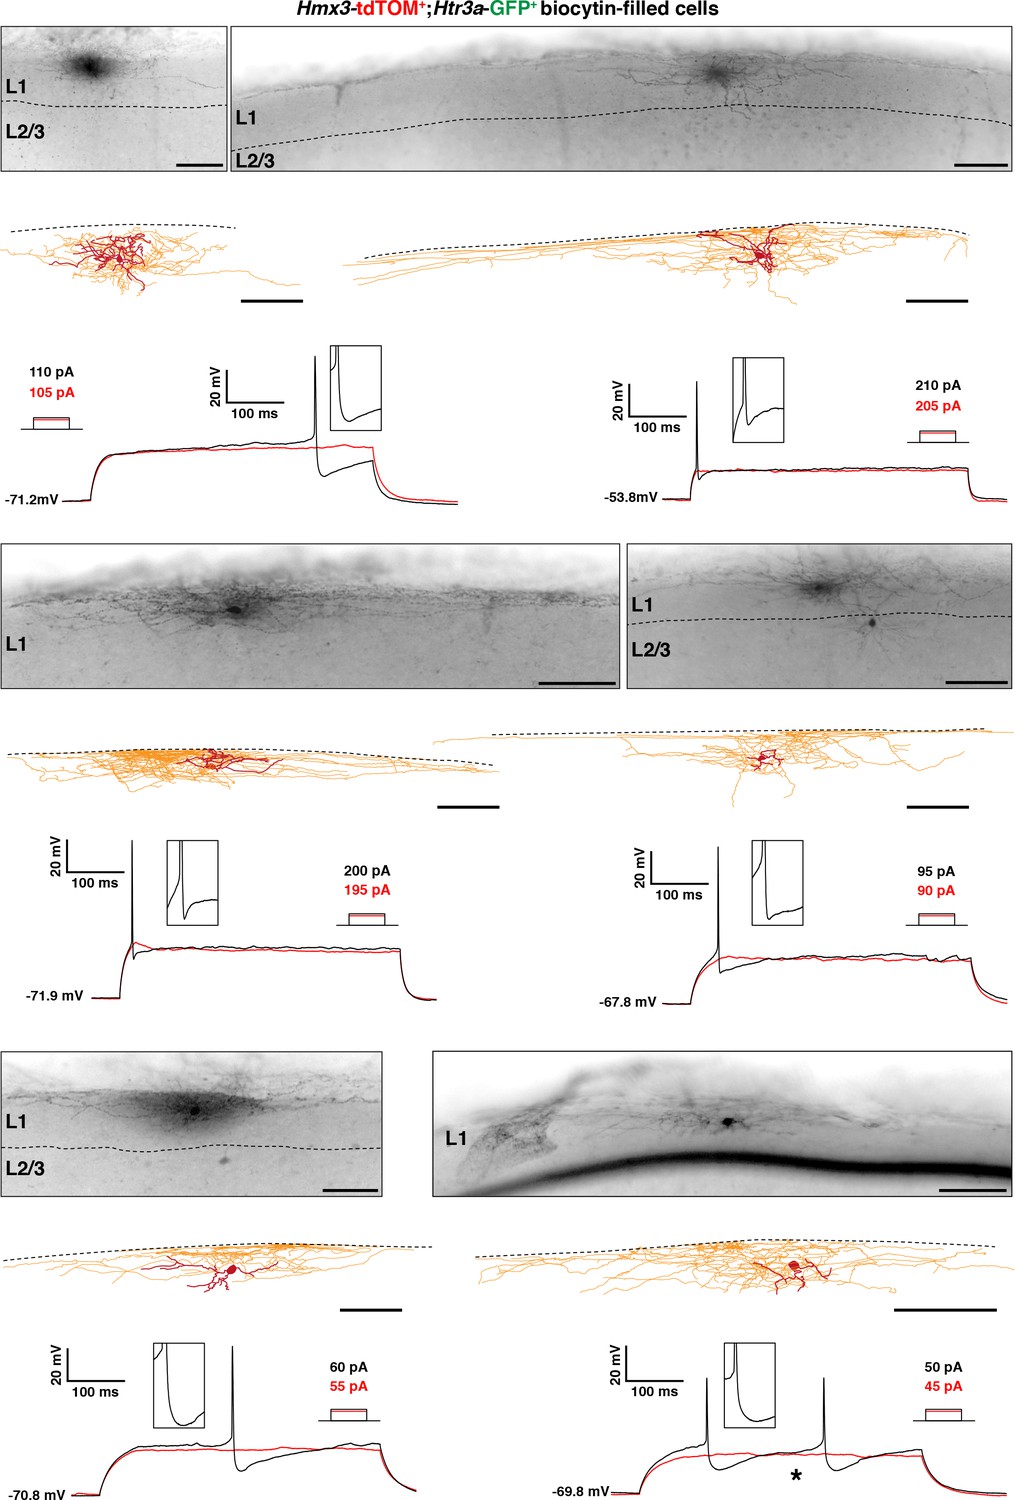
Hmx3; tdTOM+/Htr3a-GFP+ interneurons (INs) in layer 1 (L1) display the characteristic morphology of elongated neurogliaform cells (eNGCs).
Illustrative images confirming location of the cells, morphological reconstructions and electrophysiological traces of Hmx3; tdTOM+/Htr3a-GFP+ INs in L1. All cells have the morphology of eNGCs with dense axonal ramifications mostly restricted to layer 1. One cell (*) was excluded from the analysis of electrophysiological properties due to the presence of two peaks at the first 5 pA increment showing an action potential, but still its biocytin filling was good enough for morphological tracing (bottom right). Scale bars: 100 µm in all brightfield images and reconstructions.
Figure 6—figure supplement 2

Prediction model parameters and electrophysiological features of Hmx3; tdTOM+/Htr3a-GFP+ interneurons (INs) in layer 1.
(A) Density plots of the electrophysiological values as well as of the LOOCV prediction probabilities for Hmx3-derived cells and non Hmx3-derived cells. (B) Receiver operating characteristic (ROC) curve for each electrophysiological property and on prediction probabilities obtained by LOOCV. (C) Significant difference is found between Hmx3-derived cells and non Hmx3-derived cells for threshold potential (Vthr; **p=0.0097; unpaired t-test) but not for delay to the first action potential (Delay; p=0.55; Mann-Whitney test) and resting potential (Vrest; p=0.68; Mann-Whitney test). Afterdepolarization potential (ADP) is0 for all Hmx3-derived cells.
Figure 6—figure supplement 3
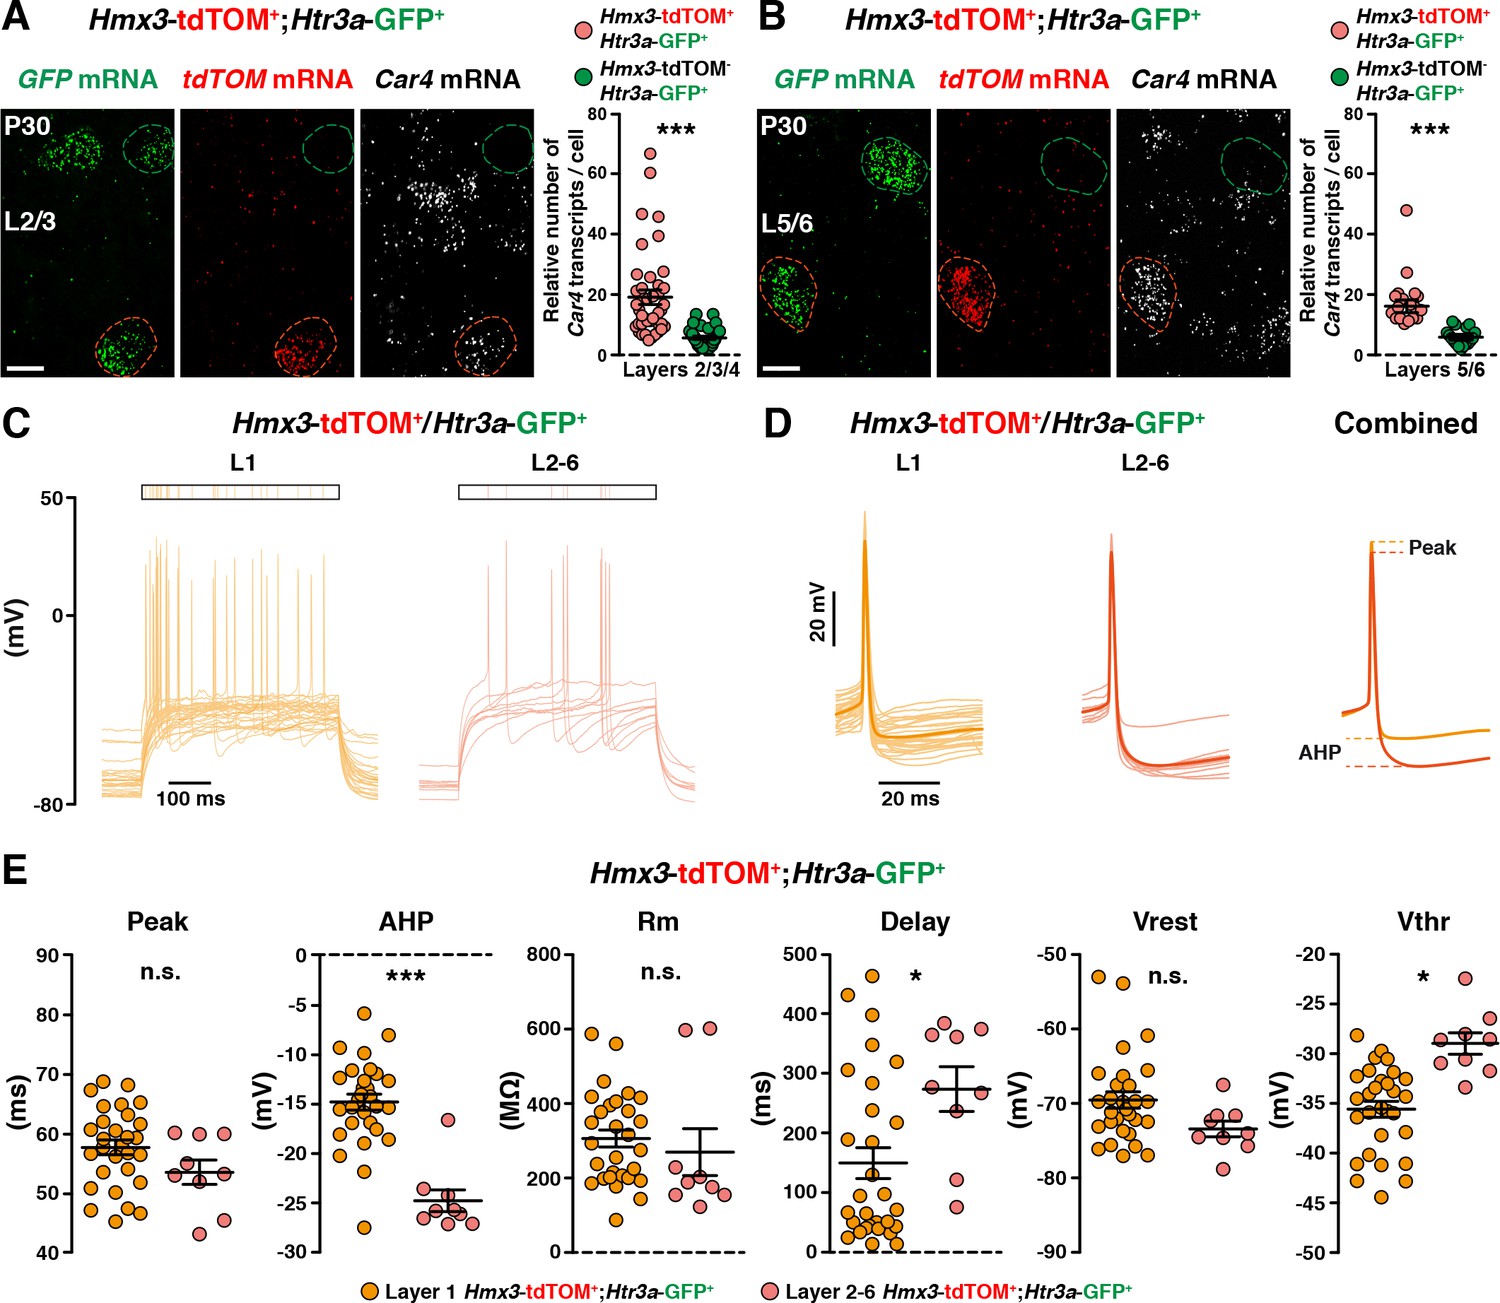
Hmx3; tdTOM+/Htr3a-GFP+ interneurons (INs) in cortical layers 2–6 (L2-6) display molecular and electrophysiological properties of NGCs.
(A, B) RNAscope multiplex fluorescent hybridization for tdTOM, GFP and Car4 transcripts on P30 brains showing that Hmx3; tdTOM+/Htr3a-GFP+ INs (red outline) express Car4 at significantly higher levels in L2–4 (A, ***p<0.0001; Mann-Whitney test) and L5/6 (B, ***p<0.0001; Mann-Whitney test) as compared to Htr3a-GFP+ INs negative for tdTOM (green outline). (C) Superimposed single AP traces at rheobase of Hmx3; tdTOM+/Htr3a-GFP+ INs recorded in L1 (orange) and in L2–6 (red). Hmx3; tdTOM+/Htr3a-GFP+ INs from L2–6 exhibit more late-spiking profile. (D) Same traces as in (C), aligned to the AP, in a lower time scale. Thin lines are individual cell traces and thick lines are trace averages. The average traces on the right are aligned to the threshold potential (Vthr). (E) As compared to L1 cells, Hmx3; tdTOM+/Htr3a-GFP+ INs in L2–6 display significant differences in afterhyperpolarization amplitude (AHP; ***p=0.0001; Mann-Whitney test), delay to the first action potential (Delay; *p=0.0202; unpaired t-test) and Vthr (*p=0.0002; unpaired t-test). No significant differences were found between Hmx3; tdTOM+/Htr3a-GFP+ INs in L2–6 and L1 for peak amplitude (Peak; p<0.1058; unpaired t-test), membrane resistance (Rm; p=0.5011; unpaired t-test) and resting potential (Vrest; p=0.7056; unpaired t-test), Scale bars: 10 µm in all.
-
Figure 6—figure Supplement 3—source data 1
Detailed counts of cells expressing Car4 quantified in Figure 6—figure supplement 3 in the different experimental conditions.
- https://doi.org/10.7554/eLife.32017.027
-
Figure 6—figure Supplement 3—source data 2
Electrophysiological properties of cells quantified in Figure 6—figure supplement 3.
- https://doi.org/10.7554/eLife.32017.028
Figure 6—figure supplement 4
Hmx3; tdTOM+/Htr3a-GFP+ interneurons (INs) in cortical layers 2–6 (L2-6) display the characteristic morphology of NGCs.
Illustrative images confirming location of the cells, morphological reconstructions and electrophysiological traces of Hmx3; tdTOM+/Htr3a-GFP+ INs in L2–6. All cells have the morphology of NGCs with dense axonal ramifications extending throughout layers. Two cells (*) were excluded from the analysis of electrophysiological properties due to high series resistance, but still their biocytin filling was good enough for morphological tracing (left, upper two panels). Scale bars: 100 µm in all.
Figure 7
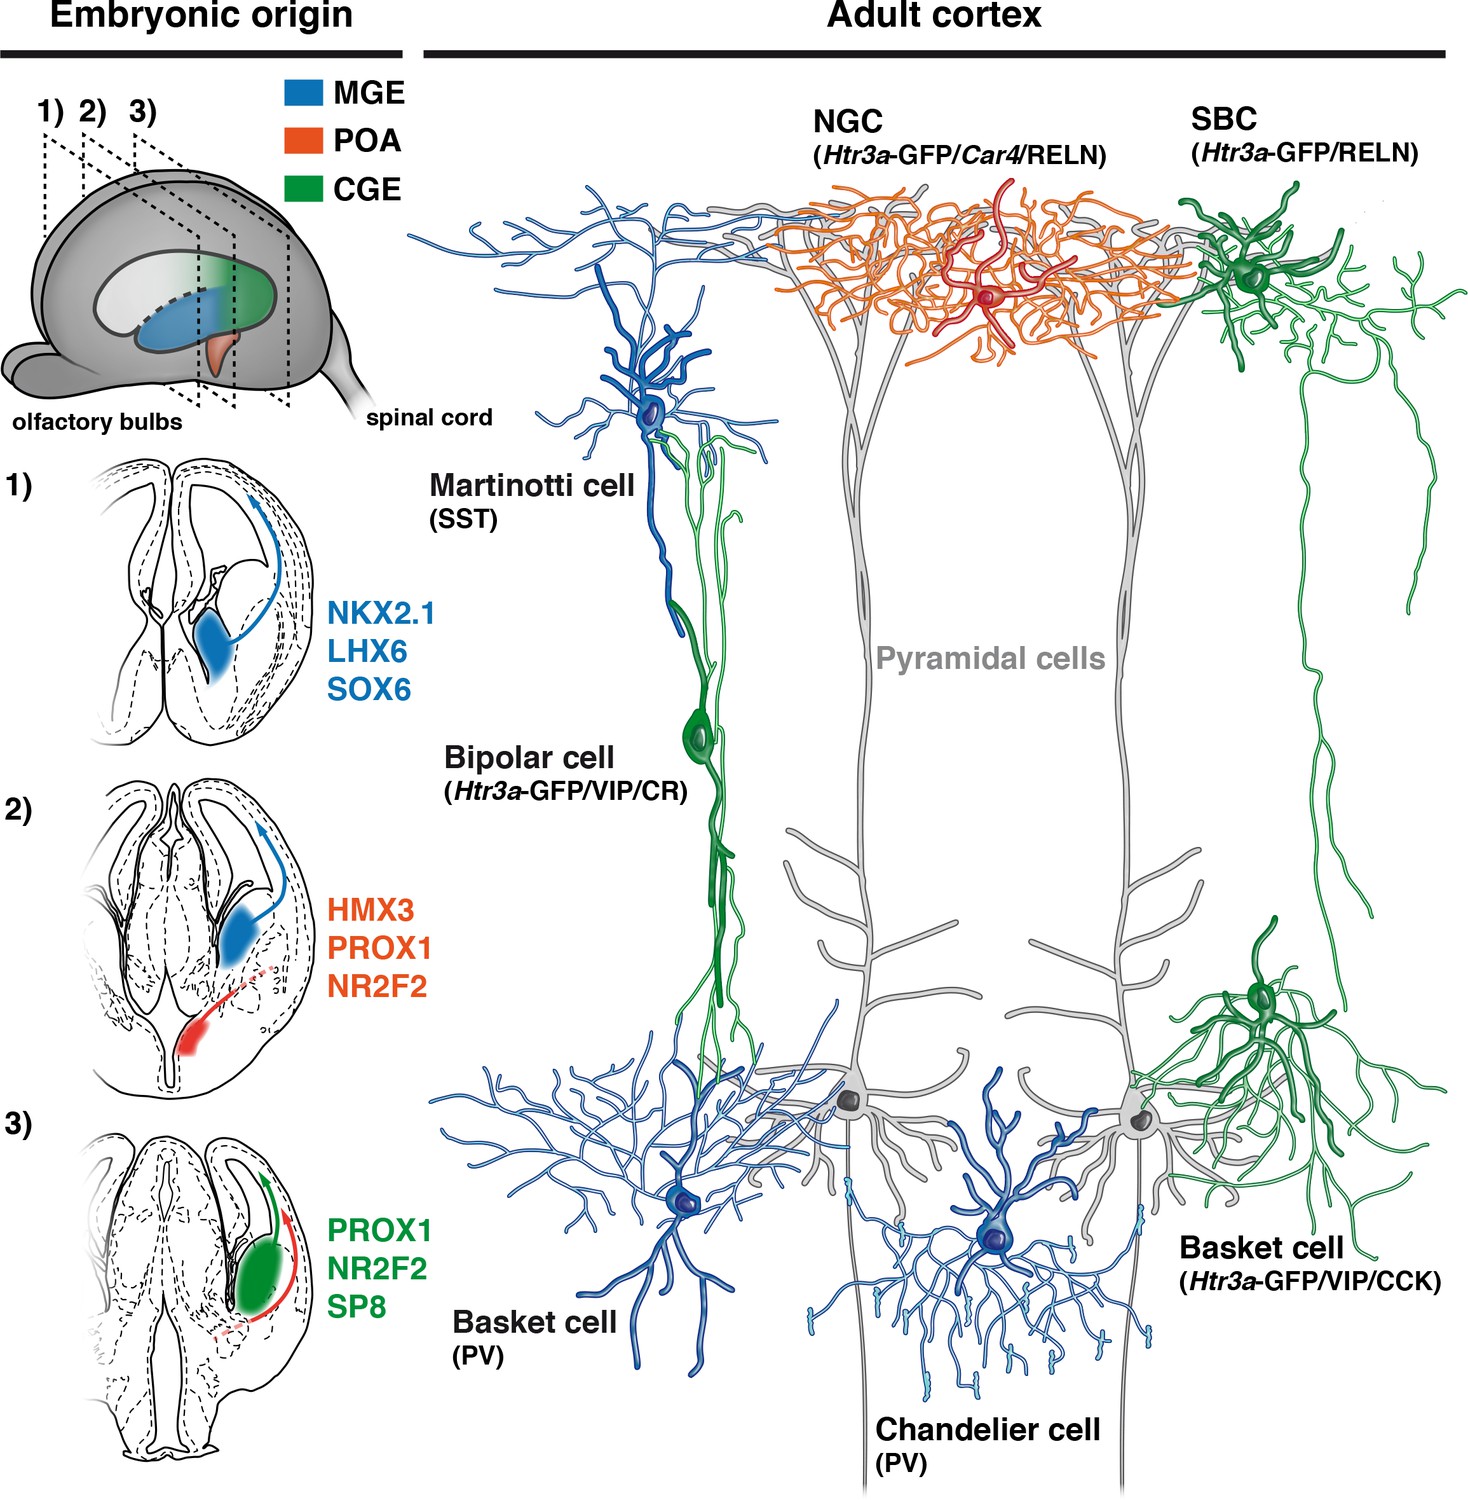
Developmental origin of cardinal classes of cortical interneurons.
The Martinotti somatostatin (SST) cell, the parvalbumin (PV) basket cell and the PV+ chandelier cell originate from NKX2.1+ progenitors of the medial ganglionic eminence (MGE, blue) and rely on the transcription factors (TFs) LHX6 and SOX6. The Htr3a-GFP/reelin (RELN) single-bouquet cell (SBC), the Htr3a-GFP/vasointestinal peptide (VIP)/cholecystokinin (CCK) basket cell and the Htr3a-GFP/VIP/calretinin (CR) bipolar cell are derived from cells located in the caudal ganglionic eminence (CGE, green) that express the TFs PROX1, NR2F2 and SP8. The RELN/Car4/Htr3a-GFP neurogliaform cell (NGC) is specifically derived from Hmx3+ cells located in the preoptic area (POA, orange) and express the TFs PROX1 and NR2F2.
Tables
Key resources table
| Reagent type (species) or resource | Designation | Source or reference | Identifiers | Additional information |
|---|---|---|---|---|
| Strain, strain background (Mus Musculus) | Tg(Htr3a-EGFP)DH30Gsat (referred as Htr3a-GFP) | GENSAT Consortium | MGI:3846657 | Maintained on a C57Bl/6 background |
| Strain, strain background (Mus Musculus) | B6.Cg-Gt(ROSA)26Sortm14(CAG-tdTomato)Hze/J (referred as R26R-tdTOMfl/fl) | The Jackson Laboratory | MGI:104735 | Maintained on a C57Bl/6 background |
| Strain, strain background (Mus Musculus) | Tg(Hmx3-icre)1Kess | provided by Oscar Marin | MGI:5566775 | Maintained on a C57Bl/6 background |
| Strain, strain background (Mus Musculus) | Dbx1tm2(cre)Apie (referred as Dbx1-Cre) | provided by Alessandra Pierani | MGI:3757955 | Maintained on a C57Bl/6 background |
| Antibody | Anti-GFAP, rabbit polyclonal | Abcam, United Kingdom | ab7260 | (1:2000) |
| Antibody | Anti-GFP, rabbit polyclonal | Millipore, Germany | AB3080 | (1:500) |
| Antibody | Anti-GFP, goat polyclonal | Abcam | ab5450 | (1:2000) |
| Antibody | Anti-NeuN (clone A60), mouse monoclonal | Millipore | MAB377 | (1:500) |
| Antibody | Anti-NKX2.1 (H-190), rabbit polyclonal | Santa Cruz Biotechnology, Dallas, TX | sc-13040 | (1:100) |
| Antibody | Anti-NPY, rabbit polyconal | Abcam | ab10980 | (1:500) |
| Antibody | Anti-NR2F2, rabbit polyclonal | Abcam | ab42672 | (1:500) antigen retrieval (Citrate buffer pH 6.0; 85°C; 20 min) |
| Antibody | Anti-PROX1, goat polyclonal | R&D System,Minneapolis, MN | AF2727 | (1:250) |
| Antibody | Anti-PV, mouse monoclonal | Swant, Switzerland | PV235 | (1:2000) |
| Antibody | Anti-Reelin, mouse monoclonal | Abcam | ab78540 | (1:500) |
| Antibody | Anti-S100β, rabbit polyclonal | Abcam | ab41548 | (1:2000) |
| Antibody | Anti-SST, rat monoclonal | Millipore | MAB354 | (1:500) |
| Antibody | Anti-SOX6, rabbit polyclonal | Abcam | ab30455 | (1:500) |
| Antibody | Anti-SOX10 (N-20), goat polyclonal | Santa Cruz Biotechnology | sc-17343 | (1:100) |
| Antibody | Anti-SP8 (C-18), goat polyclonal | Santa Cruz Biotechnology | sc-104661 | (1:50) antigen retrieval (Citrate buffer pH 6.0; 85°C; 20 min) |
| Antibody | Anti-tdTOM, goat polyclonal | Sicgen, Portugal | AB8181-200 | (1:500) |
| Antibody | Anti-VIP, rabbit polyclonal | Abcam | ab22736 | (1:500) ASCF perfusion; 2 hr PFA 4% postfixation |
| Antibody | Donkey anti-rabbit Alexa Fluor488 | Invitrogen, Carlsbad, CA | A21206 | (1:500) |
| Antibody | Donkey anti-goat Alexa Fluor488 | Invitrogen | A11055 | (1:500) |
| Antibody | Donkey anti-goat Alexa Fluor405 | Abcam | ab175664 | (1:500) |
| Antibody | Donkey anti-rabbit Alexa Fluor405 | Abcam | ab175651 | (1:500) |
| Antibody | Donkey anti-rabbit Alexa Fluor647 | Invitrogen | A31573 | (1:500) |
| Antibody | Donkey anti-rat Alexa Fluor647 | Invitrogen | A21247 | (1:500) |
| Antibody | Donkey anti-mouse Alexa Fluor647 | Invitrogen | A31571 | (1:500) |
| Antibody | Donkey anti-goat Alexa Fluor647 | Invitrogen | A21447 | (1:500) |
| Antibody | Streptavidin, Alexa Fluor647-conjugated | ThermoFisher/Invitrogen | S21374 | (1:500) |
| Antibody | Anti-Digoxigenin-AP, Fab fragment | Roche, Switzerland | 11082736103 | (1:2000) |
| Recombinant DNA reagent | Htr3a plasmid probe | Gift from Dr. B. Emerit | NA | Linearization: HindIII-HF; antisense synthesis: T7; concentration 1 µg |
| Recombinant DNA reagent | Lhx6 plasmid probe | Gift from Dr. M. Denaxa | NA | Linearization: Not1; antisense synthesis: T3; concentration 1 µg |
| Recombinant DNA reagent | RNAScope Probe-tdTomato-C2 | Affimetrix, Santa Clara, CA | 317041-C2 | |
| Recombinant DNA reagent | RNAScope Probe-EGFP | Affimetrix | 400281 | |
| Recombinant DNA reagent | RNAScope Probe-Car4-C3 | Affimetrix | 468421-C3 | |
| Sequence-based reagent | Genotyping PCR primer forB6.Cg-Gt(ROSA)26Sortm14(CAG-tdTomato)Hze/J | Microsynth, Switzerland (desalted;100 µM stock) | WT-F (oIMR9020): AAG GGA GCT GCA GTG GAG TA | https://www2.jax.org/protocolsdb/f?p=116:5:0::NO:5:P5_MASTER_PROTOCOL_ID,P5_JRS_CODE:29436,007909 |
| Sequence-based reagent | Genotyping PCR primer forB6.Cg-Gt(ROSA)26Sortm14(CAG-tdTomato)Hze/J | Microsynth (desalted;100 µM stock) | WT-R (oIMR9021): CCG AAA ATC TGT GGG AAG TC | |
| Sequence-based reagent | Genotyping PCR primer forB6.Cg-Gt(ROSA)26Sortm14(CAG-tdTomato)Hze/J | Microsynth (desalted;100 µM stock) | Mut-R (oIMR9103): GGC ATT AAA GCA GCG TAT CC | |
| Sequence-based reagent | Genotyping PCR primer forB6.Cg-Gt(ROSA)26Sortm14(CAG-tdTomato)Hze/J | Microsynth (desalted;100 µM stock) | Mut-F (oIMR9105): CTG TTC CTG TAC GGC ATG G | |
| Sequence-based reagent | Genotyping PCR primer for Tg(Htr3a-EGFP)DH30Gsat | Microsynth (desalted;100 µM stock) | Com-F (273): GCA AGA TGT GAC CAA GCC ACC TAT TT | http://www.med.unc.edu/mmrrc/resources/genotyping-protocols/mmrrc-273 |
| Sequence-based reagent | Genotyping PCR primer for Tg(Htr3a-EGFP)DH30Gsat | Microsynth (desalted; 100 µM stock) | WT-R: CAG CCC TCA GCC CTT TGA GAC TTA AG | |
| Sequence-based reagent | Genotyping PCR primer for Tg(Htr3a-EGFP)DH30Gsat | Microsynth (desalted; 100 µM stock) | Mut-R: TGA ACT TGT GGC CGT TTA CGT CG | |
| Sequence-based reagent | Genotyping PCR primer forTg(Hmx3-icre)1Kess | Microsynth (desalted;100 µM stock) | Mut-F: CTC TGA CAG ATG CCA GGA CA | |
| Sequence-based reagent | Genotyping PCR primer forTg(Hmx3-icre)1Kess | Microsynth (desalted;100 µM stock) | Mut-R: TCT CTG CCC AGA GTC ATC CT | |
| Sequence-based reagent | Genotyping PCR primer forDbx1tm2(cre)Apie | Microsynth (desalted;100 µM stock) | WT-F (1307): GCA AGG AAA TGT CTC TGG GAC | https://www.infrafrontier.eu/sites/infrafrontier.eu/files/upload/public/pdf/genotype_protocols/EM01924_geno.pdf |
| Sequence-based reagent | Genotyping PCR primer forDbx1tm2(cre)Apie | Microsynth (desalted;100 µM stock) | WT-R (1115): GAG GAT GAG GAA ATC ACG GTG | |
| Sequence-based reagent | Genotyping PCR primer forDbx1tm2(cre)Apie | Microsynth (desalted;100 µM stock) | Mut-F (cre83): GTC CAA TTT ACT GAC CGT ACA CC | |
| Sequence-based reagent | Genotyping PCR primer forDbx1tm2(cre)Apie | Microsynth (desalted;100 µM stock) | Mut-R (cre85): GTT ATT CGG ATC ATC AGC TAC ACC | |
| Commercial assay or kit | VECTASTAIN Elite ABC-HRP Kit | VectorLab, Burlingame, CA | PK-6100 | Manufacturer's protocol |
| Commercial assay or kit | DAB Peroxidase (HRP) Substrate Kit (with Nickel), 3,3’-diaminobenzidine | VectorLab | SK-4100 | Manufacturer's protocol |
| Commercial assay or kit | RNAscope Fluorescence Multiplex Reagent Kit | Advanced Cell Diagnostics, Newark, CA | 320850 | Manufacturer's protocol (fresh frozen tissue) |
| Chemical compound, drug | Nε-(+)-Biotinyl-L-lysine (biocytin) | Sigma Aldrich, Germany | B4261 | Used at 8.1 mM |
| Chemical compound, drug | Fast Red tablets | Kem-En-Tech, Denmark | 4210 | Manufacturer's protocol |
| Chemical compound, drug | Hoechst 33258 | Sigma Aldrich | 23491-45-4 | (1:10000) |
| Chemical compound, drug | Thiopental Inresa 0.5 g | Inresa Arzneimittel GmbH, Germany | Used at 50 mg/kg | |
| Software, algorithm | Microsoft Office 2017 (Excel, Word) | © 2017 Microsoft, Redmond, WA | v.16.9.1 | Manuscript editing |
| Software, algorithm | Adobe Suit CC (Photoshop, Illustrator, Acrobat) | Adobe Systems, San José, CA | v.22.0.1 | Image treatment, figure editing |
| Software, algorithm | GraphPad Prism | GraphPad software, Inc., La Jolla, CA | v.7.0 | Statistics, graph editing |
| Software, algorithm | Fiji | doi:10.1038/nmeth.2019 | v.2.0.0 | Image editing, manual counting |
| Software, algorithm | EndNote X | Thomson Reuters, Canada | v.7.7.1 | Reference editing, bibliography |
| Software, algorithm | Neurolucida v.11.02.1 | Microbrightfield, MBF Bioscience, Williston, VT | v.11.02.1 | Neuron reconstruction |
| Software, algorithm | Neurolucida Explorer | Microbrightfield, MBF Bioscience | v.11.02.1 | Morphological reconstruction editing |
| Software, algorithm | MatLab | MathWorks, Natick, MA | Electrophysiological recordings measurment/editing | |
| Software, algorithm | Ephus (MATLAB-based) | doi: 10.3389/fncir.2010.00100 | v. 2.1.0 | Electrophysiological recordings data aquisition |
| Software, algorithm | Clampfit | Molecular Devices, San José, CA | v. 10.1.0.10 | Electrophysiological recordings offline analysis |
| Software, algorithm | R programming language | www.R-project.org | v. 3.4.0 | Statistics |
| Software, algorithm | R package bmrm | doi:10.1038/ncomms14219 | v. 3.5 | Prediction model |
| Software, algorithm | NLMorpholoyConverter | http://neuronland.org/NLMorphologyConverter/NLMorphologyConverter.html | v. 0.8.1 | Morphological reconstruction editing |
| Software, algorithm | R package NeuroAnatomy Toolbox | doi: 10.1016/j.neuron.2016.06.012 | v. 1.8.12.9000 | Morphological reconstruction editing |
Additional files
-
Supplementary file 1
Detailed description of the technical (brains) and biological (cells) replicates used in the different experiments.
- https://doi.org/10.7554/eLife.32017.030
-
Transparent reporting form
- https://doi.org/10.7554/eLife.32017.031
Download links
A two-part list of links to download the article, or parts of the article, in various formats.
Downloads (link to download the article as PDF)
Open citations (links to open the citations from this article in various online reference manager services)
Cite this article (links to download the citations from this article in formats compatible with various reference manager tools)
Neurogliaform cortical interneurons derive from cells in the preoptic area
eLife 7:e32017.
https://doi.org/10.7554/eLife.32017


