Fragile X mental retardation protein is a Zika virus restriction factor that is antagonized by subgenomic flaviviral RNA
- University of Texas Medical Branch, United States
- Duke-NUS Medical School, Singapore
Figures
Figure 1
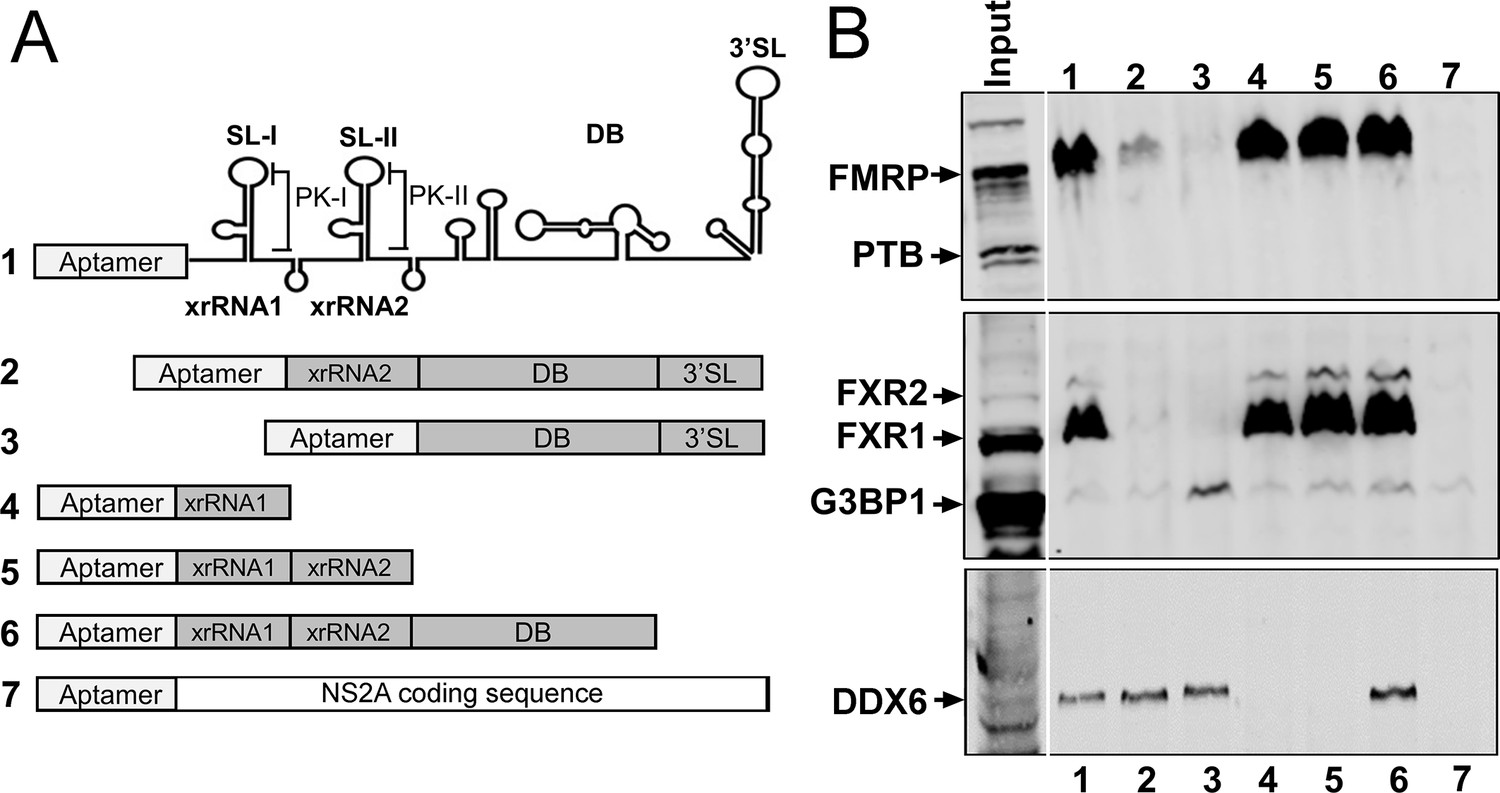
xrRNA1 is required and sufficient for FMRP binding to the ZIKV 3′ UTR.
(A) Schematic illustrating the secondary structures present in the ZIKV 3′ UTR and RNAs used for affinity chromatography. Deletion mutant RNA constructs fused to a tobramycin aptamer at the 5′ end are shown. DENV NS2A coding sequence was used as a negative control RNA. (B) Purified RNAs bound to tobramycin-sepharose beads were incubated with HeLa cell lysate and unbound proteins were washed away prior to elution for western blotting for DDX6, FMRP, FXR1, FXR2, G3BP1 and PTB.
Figure 2
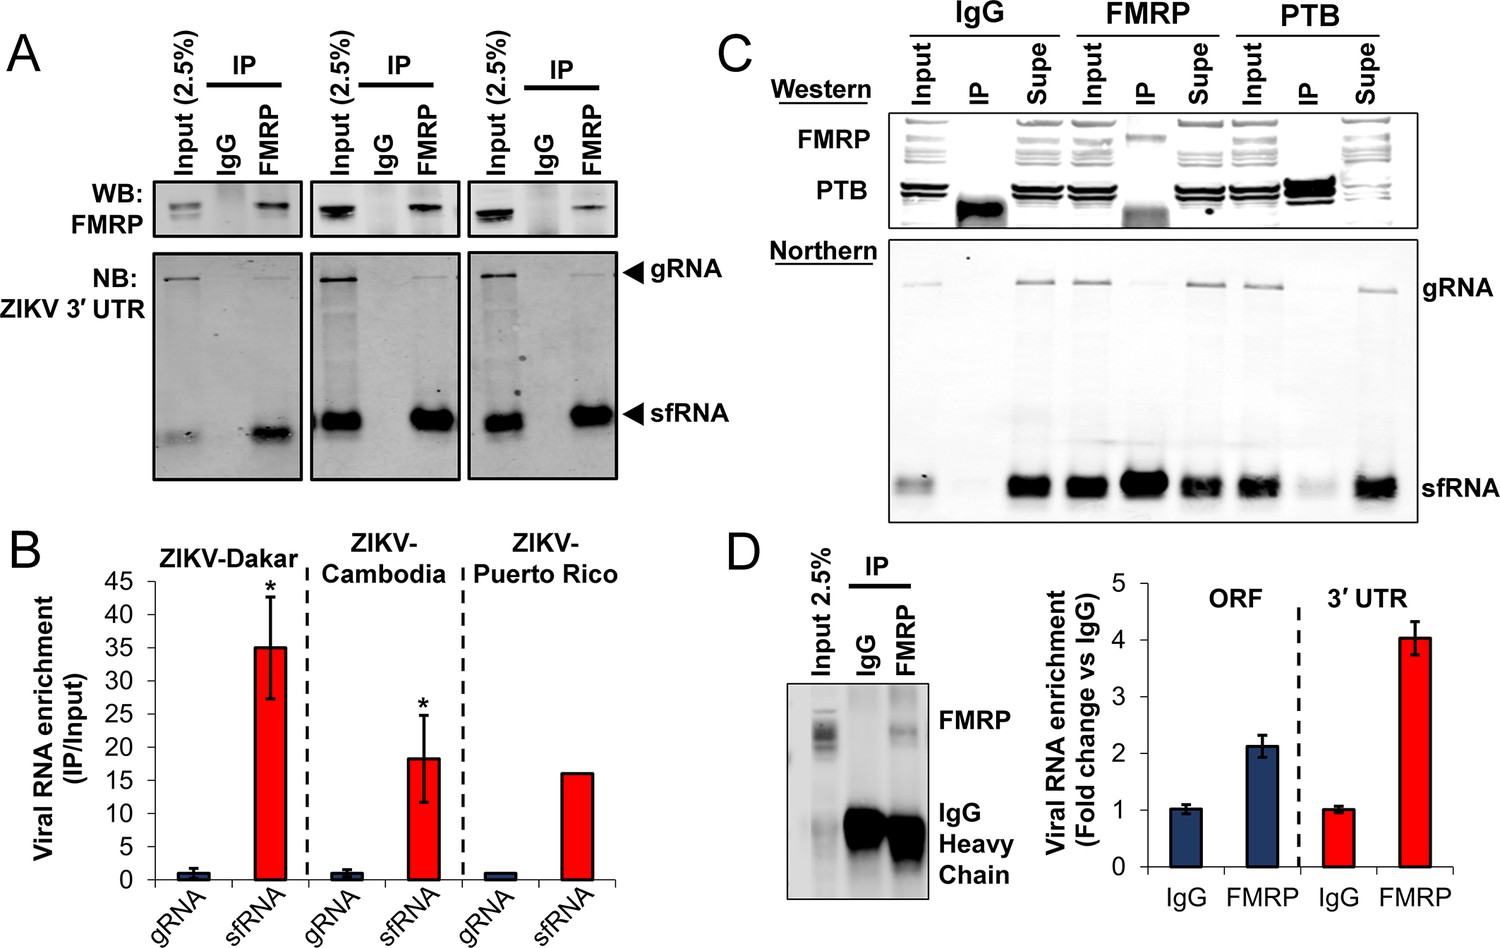
FMRP interacts with ZIKV RNA in infected cells.
(A) RNA immunoprecipitation (RIP) was performed using either control IgG or anti-FMRP antibodies. HeLa cells were infected with the indicated virus at MOI of 3 and harvested 48 hr post-infection. Viral genome (gRNA) and the subgenomic flaviviral RNA (sfRNA) were detected by Northern blot (NB) using a DNA probe that hybridizes to the ZIKV 3′ UTR. Western blotting (WB) shows the specificity of FMRP IP. (B) Bar graph showing the preferential binding of FMRP to ZIKV sfRNA. Densitometry analysis of NB assays was performed to determine relative levels of co-precipitating gRNA and sfRNA compared to input signals. Enrichment of sfRNA was normalized to the gRNA enrichment. Data represents the mean ± SEM of three independent experiments for ZIKV-Dakar and ZIKV-Cambodia (*p<0.05). One experiment was performed for ZIKV-Puerto Rico. (C) RNA IP from HeLa cells infected with ZIKV-Dakar using anti-PTB, anti-FMRP and isotype control antibodies. (D) FMRP interacts with ZIKV RNA in infected mouse testes. Testes from ZIKV-infected mice were lysed and used for FMRP-RIP. RT-qPCR assays were used targeting the ZIKV ORF, to measure viral genomes exclusively, and the 3′ UTR, to measure both genomes and sfRNA. Bar graph represents the enrichment of viral RNAs in FMRP-pulldown normalized to the control IgG. Data indicates the mean ± range of two biological replicates. The WB shows IP of FMRP.
-
Figure 2—source data 1
- https://doi.org/10.7554/eLife.39023.007
Figure 3 with 3 supplements
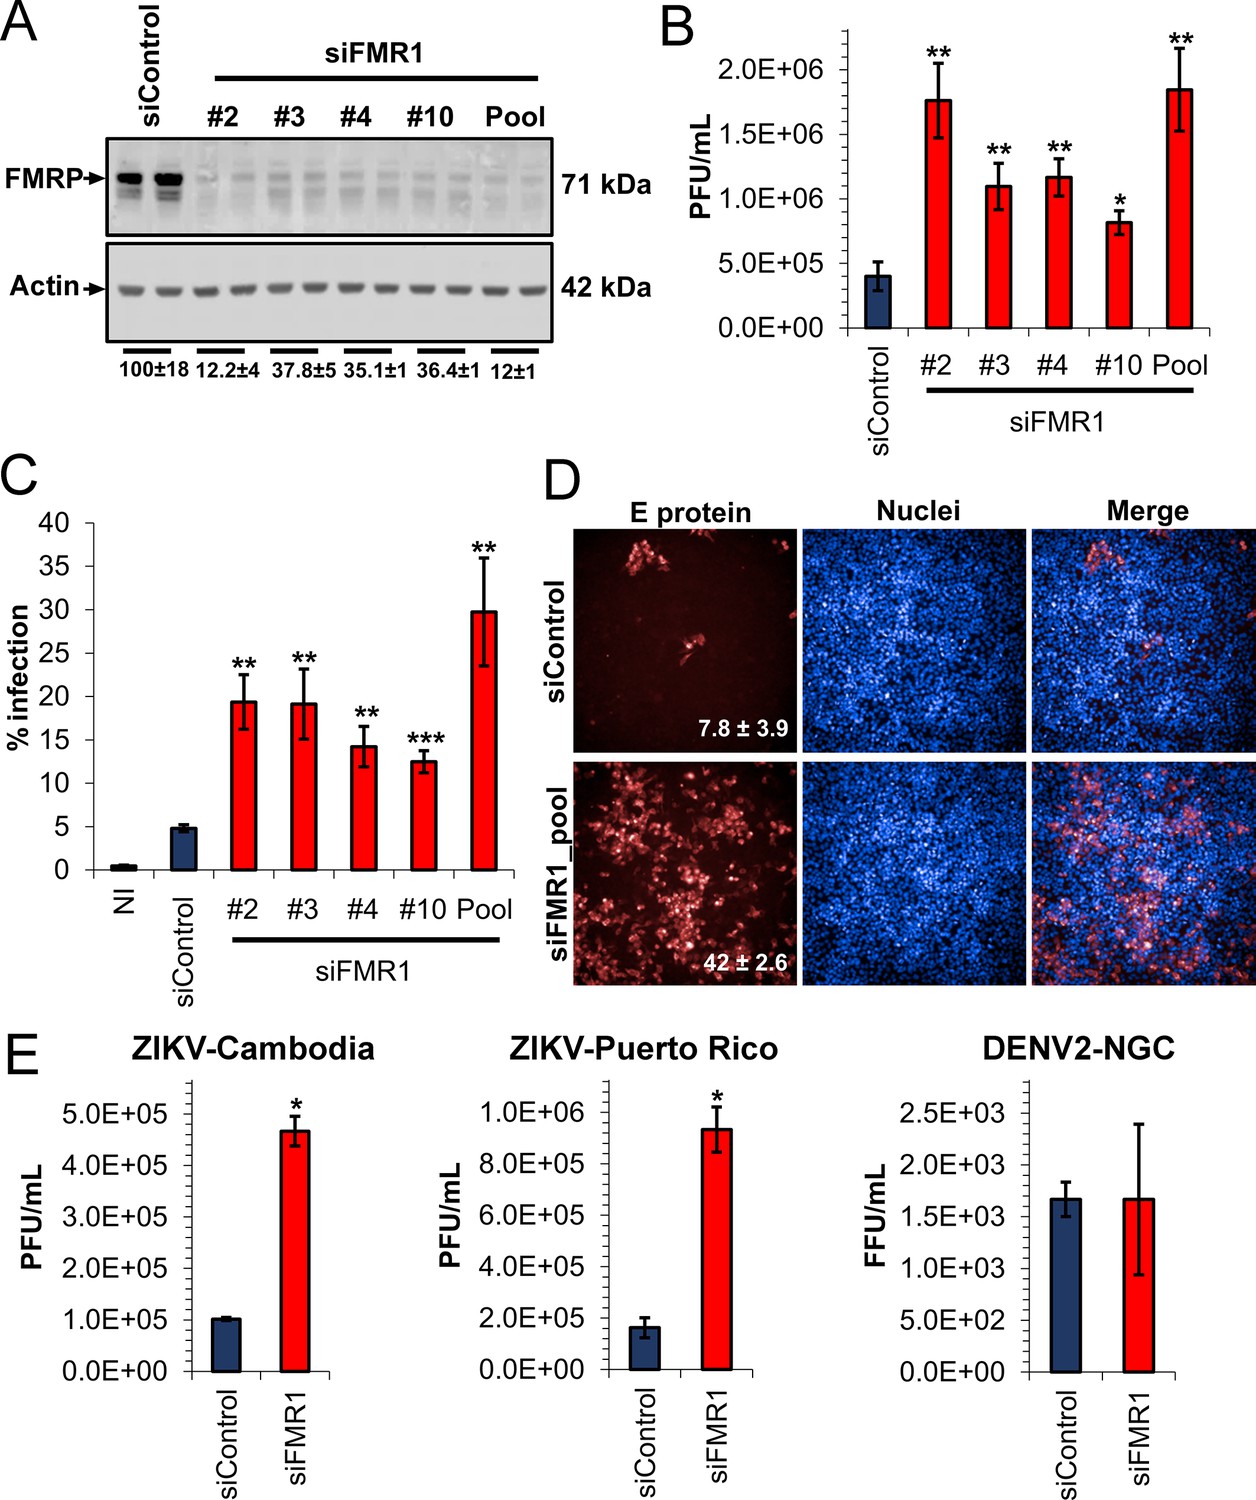
Depletion of FMRP increases ZIKV infection.
HeLa cells were transfected with control siRNA (siControl) and individual or a pool of four different siRNAs targeting FMR1 (siFMR1). Cells were infected with ZIKV-Dakar at MOI 0.01 for 48 hr. (A) Representative WB of FMRP knockdown efficiency. Relative FMRP expression is indicated below. (B) Viral titers in supernatants were measured by plaque assay and are plotted as PFU/ml. (C) Infection rates were measured by immunofluorescence against viral envelope (E) protein using flow cytometry (representative scatter plots are shown in Figure 3—figure supplement 1A) or (D) high-content imaging. Data represent the mean ±SEM of two independent experiments. (E) HeLa cells were transfected with siControl or siFMR1 (pool) and infected with ZIKV-Cambodia (MOI 0.01), ZIKV-Puerto Rico (MOI 0.01) or DENV-2-NGC (MOI 0.03) 48 hr later. At 48 hr post-infection, supernatants were collected and analyzed for viral titers. Graphs represent the mean ±SD of PFU/mL of one of three independent experiments for ZIKV-Cambodia and ZIKV-Puerto Rico. For DENV-NGC, three biological replicates are plotted (*p<0.05, **p<0.005, ***p<0.001). NI, non-infected cells.
-
Figure 3—source data 1
- https://doi.org/10.7554/eLife.39023.012
Figure 3—figure supplement 1
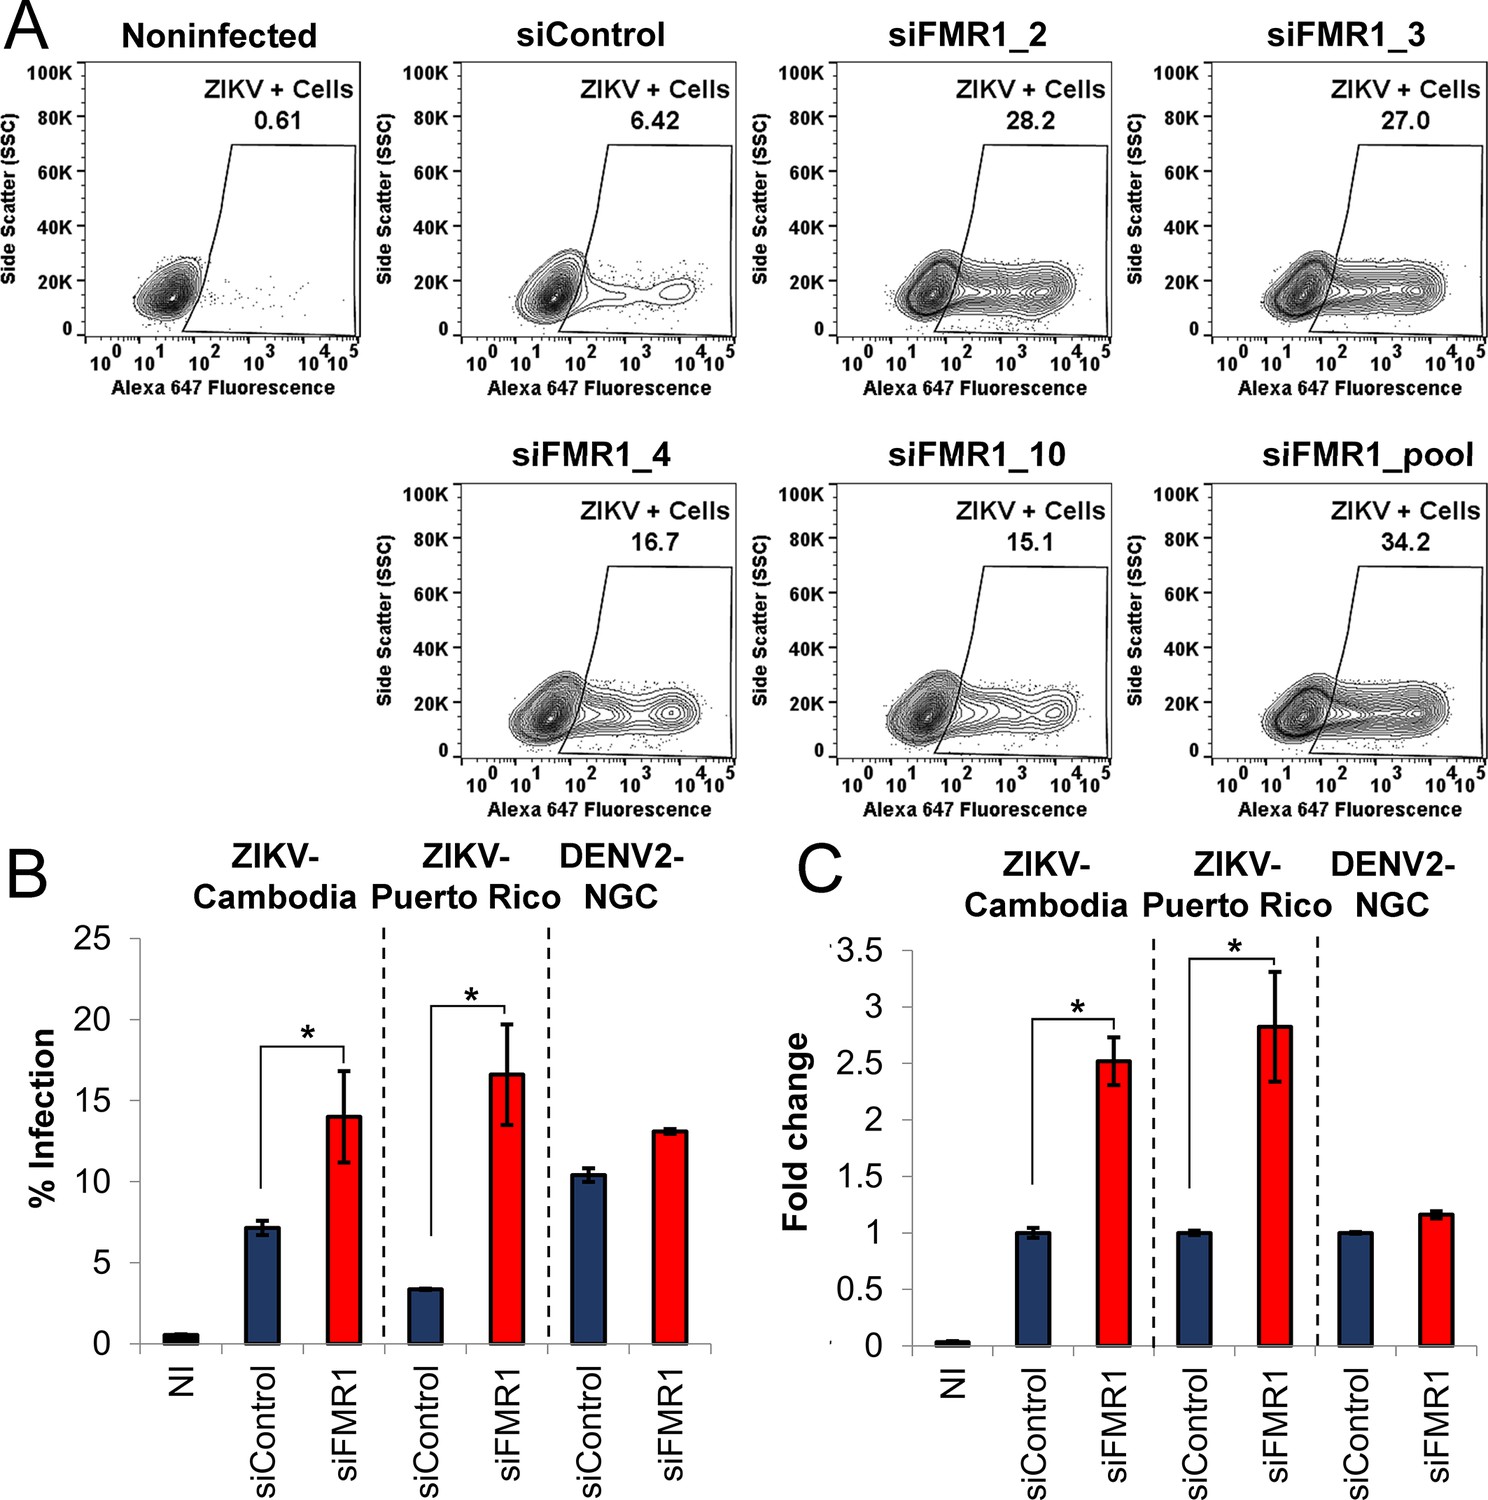
ZIKV Infection rates measured by flow cytometry.
(A) Representative scatters plots indicate the population of cells positive for ZIKV E protein (Alexa 647 fluorescence) in cells transfected with siControl and individual or a pool of four different siRNAs targeting the FMR1 gene infected cells. (B and C) HeLa cells were transfected for 48 hr with siControl or siFMR1 (pool) and infected with ZIKV-Cambodia Cambodia (MOI 0.01), ZIKV-Puerto Rico (MOI 0.01) and DENV-2-NGC (MOI 0.03). After 48 hr post-infection, cells were harvested, fixed, stained for E protein and analyzed for infection rate by flow cytometry. Graphs represent the mean ±SEM (B) or normalized mean ±SEM (C) of three independent experiments (*p<0.05). NI, non-infected cells.
Figure 3—figure supplement 2
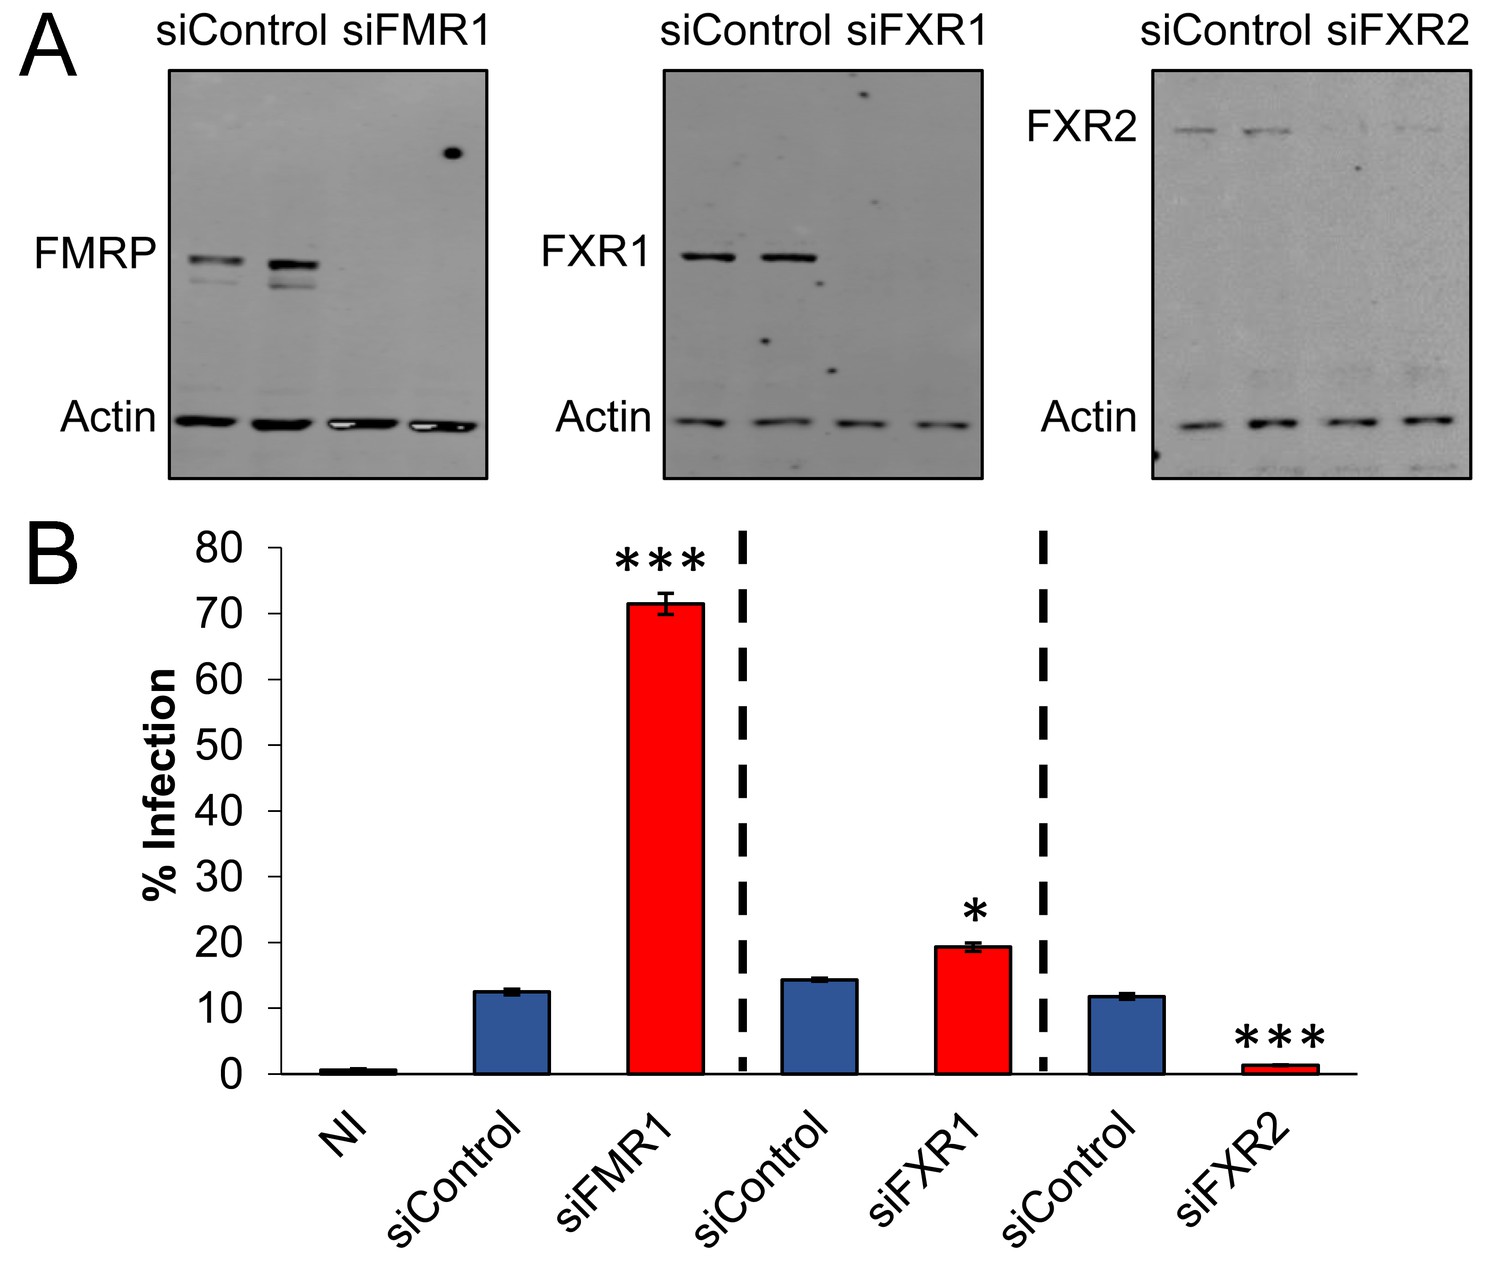
Silencing of fragile X related proteins FXR1 and FXR2 has differential effect on ZIKV infection.
(A) HeLa cells were transfected with a pool of four individual siRNAs targeting either FMR1, FXR1 or FXR2. Two days post-transfection, the cells were infected with ZIKV-Dakar at MOI of 0.01 for 48 hr. KD efficiency was analyzed by WB (A) and viral infection was measured by flow cytometry (B). The bar graph shows means of infection rates ± SD of three biological replicates.
Figure 3—figure supplement 3
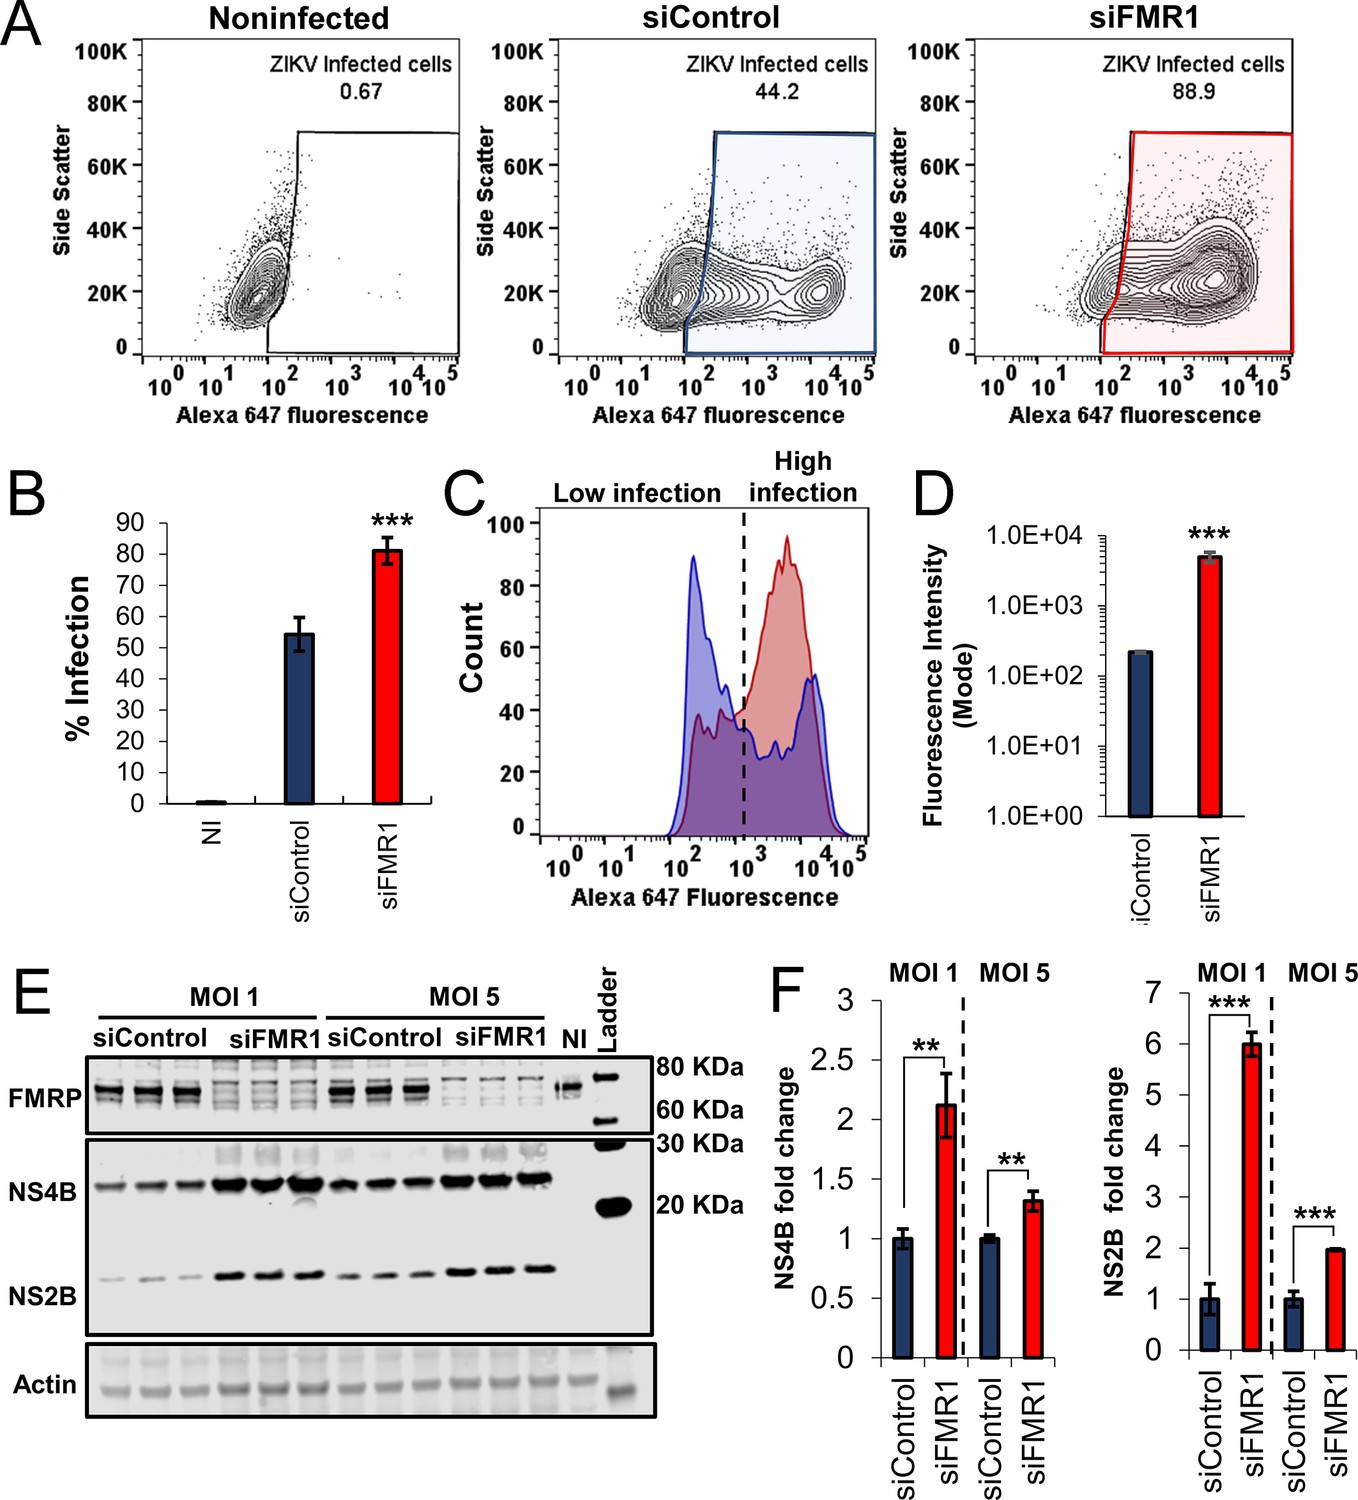
Depletion of FMRP increases ZIKV infection..
HeLa cells were transfected for 48 hr with control siRNA (siControl) and siFMR1 (pool). Cells were then infected with ZIKV-Dakar at MOI one and collected at 20 hr post-infection. Infection rate was measured by flow cytometry. (A) Representative scatter plots indicate the distribution of infected cells (Alexa Fluor 647 positive cells) in siControl (blue area) and siFMR1 (red area) transfected cells. (B) Graph represents the mean ±SEM of infection rate of two independent experiments. (C) Fluorescence Intensity (FI) histograms of infected cells indicate the presence of low-infected and high-infected populations in cells transfected with siControl (blue histogram) and siFMR1 (red histogram). (D) The bar graph indicates the FI mode values (maximum FI peak) for siControl and siFMR1 cells. (E) NS2B and NS4B viral proteins analyzed by WB in cells transfected with siControl and siFMR1 and infected for 20 hr with ZIKV-Dakar at MOIs of 1 and 5. (F) Graphs show densitometry analyses of viral proteins. NS4B and NS2B relative expression was normalized to the loading control and expressed as fold change compared to siControl. Data represents the mean ±SD of two independent experiments (**p<0.005, ***p<0.001).
Figure 4
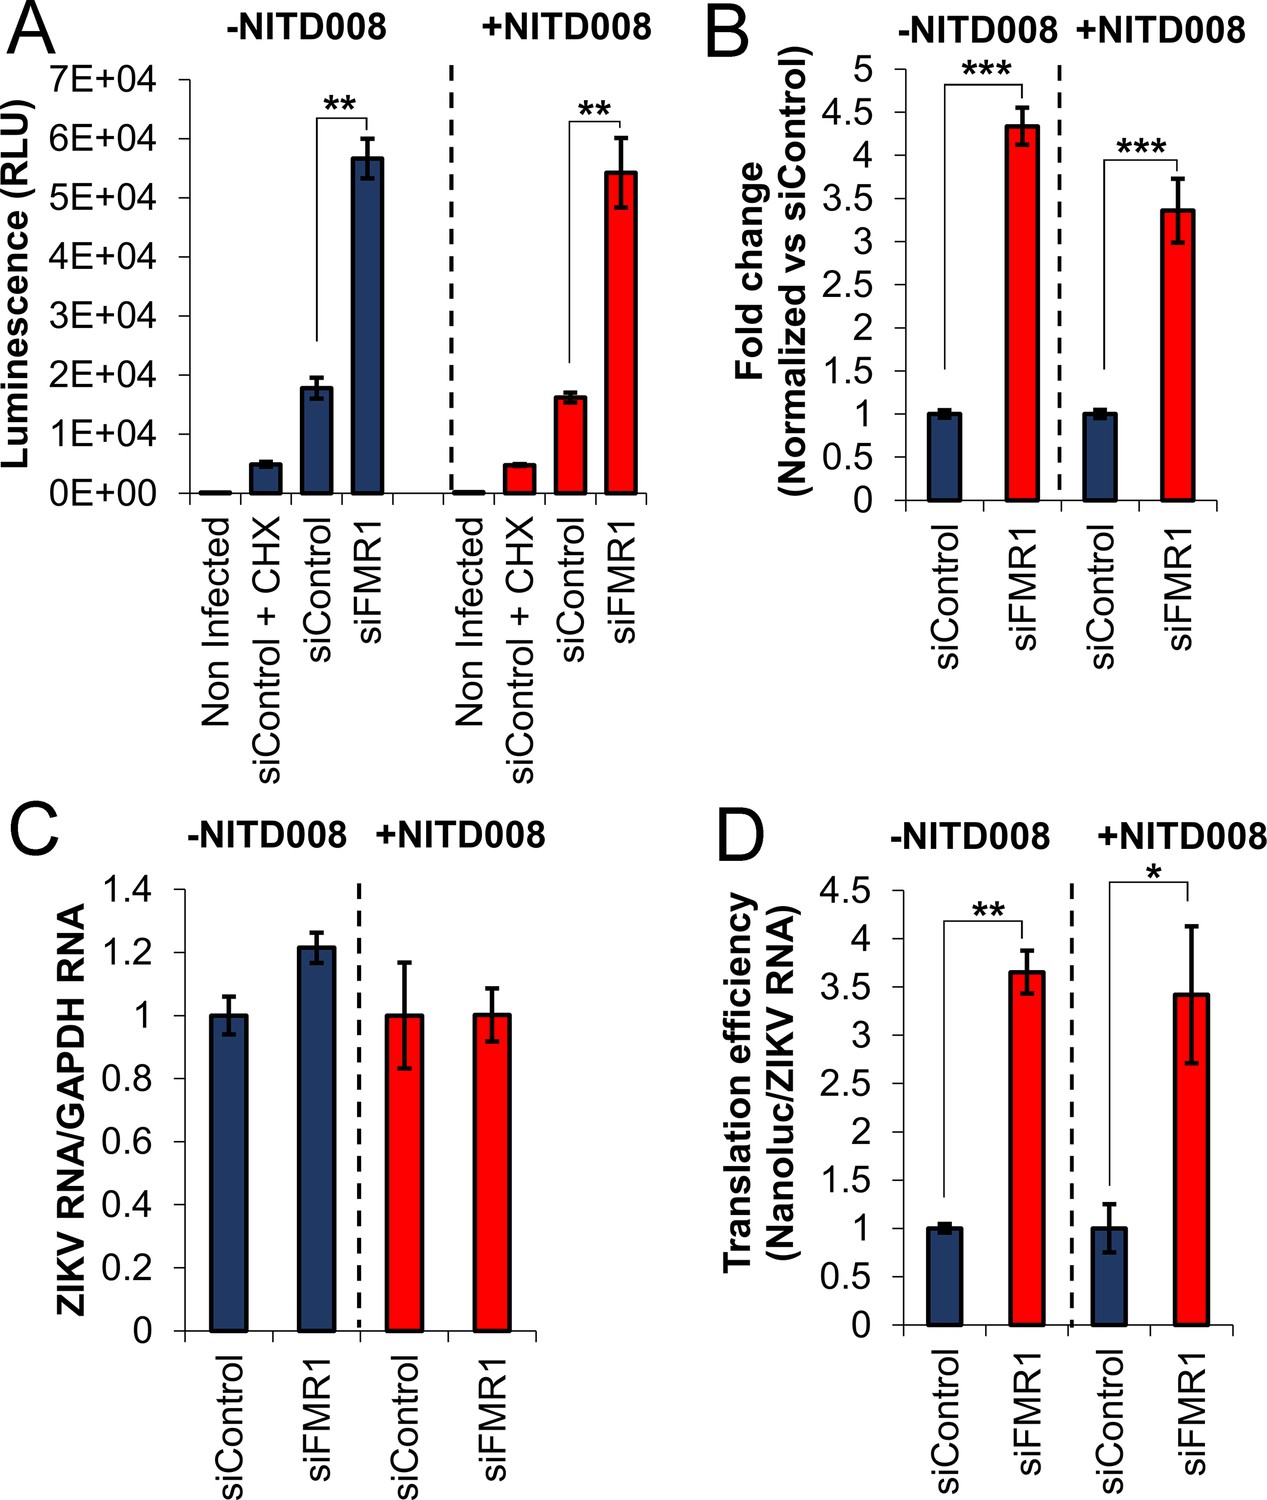
FMRP inhibits ZIKV translation early after infection.
(A) An infectious ZIKV reporter virus expressing NanoLuc luciferase was used to evaluate ZIKV translation. HeLa cells were transfected with control siRNA (siControl) or the siRNA pool targeting the FMR1 gene (siFMR1). Two hours before infection, cells were pretreated with DMSO (-NITD008) or NITD008 at 20 μM. Accumulation of Nanoluc was evaluated at 3.5 hr post-infection. Cycloheximide (CHX) treatment was used to control for background signal present in the virus stock. (B) The graph shows luminescence signals with background (CHX control) subtracted and normalized to the siControl condition. (C) In parallel, viral RNA was measured by RT-qPCR, calibrated with GADPH mRNA expression and normalized to siControl. (D) Translation efficiency was calculated by normalizing the luminescence signals to ZIKV RNA levels. Data represent mean ±SEM of one representative experiment for A, three independent experiments for B and two independent experiments for C and D. (*p<0.05, **p<0.005, ***p<0.001). .
-
Figure 4—source data 1
- https://doi.org/10.7554/eLife.39023.014
Figure 5 with 1 supplement
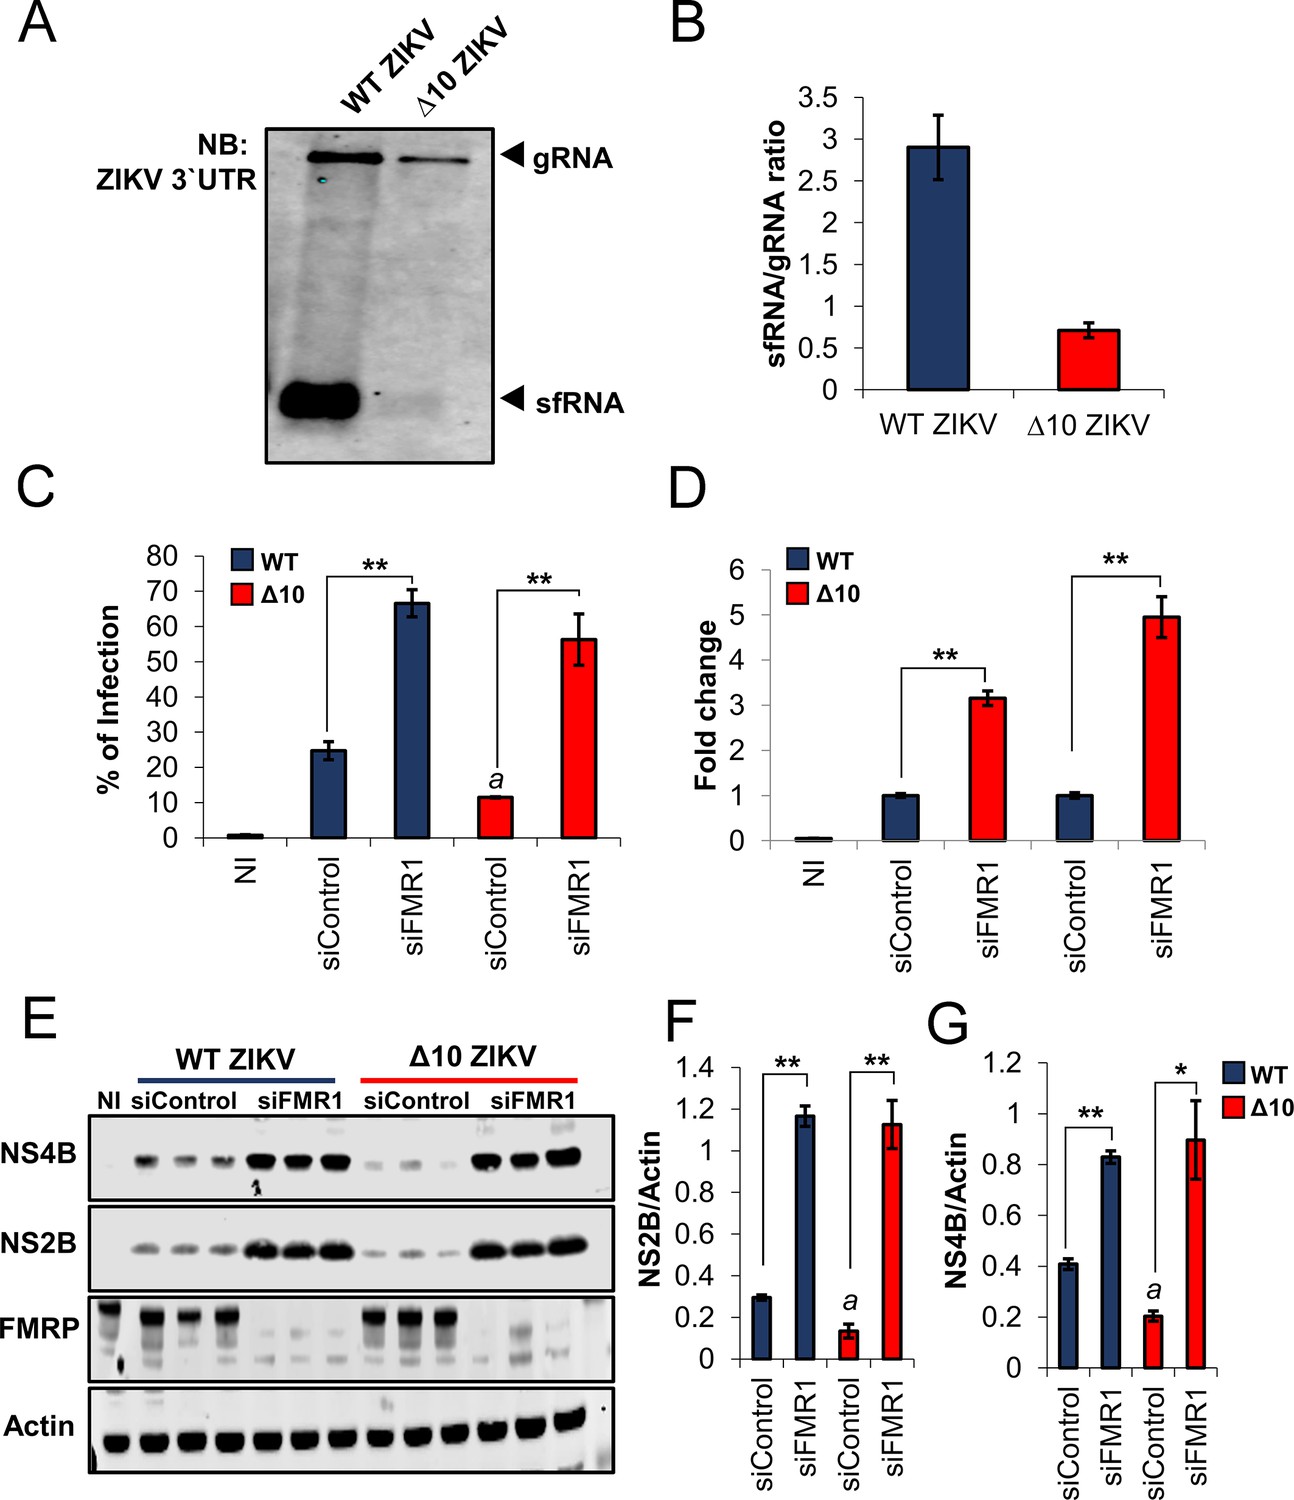
ZIKV sfRNA antagonizes FMRP’s antiviral function.
(A) HeLa cells were infected at MOI of 3 with WT ZIKV or ∆10 ZIKV. 24 hr post-infection, cell-associated RNA was harvested and levels of gRNA and sfRNA were analyzed by NB. (B) sfRNA/gRNA ratios for WT and ∆10 ZIKV were calculated by densitometry analysis of two independent experiments. (C–G) HeLa cells were transfected with control siRNA (siControl) and pooled FMR1 siRNAs for 48 hr. Cells were then infected with WT and ∆10 ZIKV at MOI of 0.2 and 24 hr later collected and analyzed for infection rate by flow cytometry (C and D). Representative scatter plots are shown in Figure 5—figure supplement 1. In parallel, viral NS4B and NS2B proteins were analyzed by WB along with FMRP and Actin loading control (E). The quantitative expression levels of NS2B (F) and NS4B (G) are shown. Data represents the mean ±SEM of one representative experiment for C, four independent experiments for D and two independent experiments for F and G. (*p<0.05, **p<0.005, ***p<0.001. a = p < 0.01 compared to siControl cells infected with WT ZIKV). .
-
Figure 5—source data 1
- https://doi.org/10.7554/eLife.39023.017
Figure 5—figure supplement 1
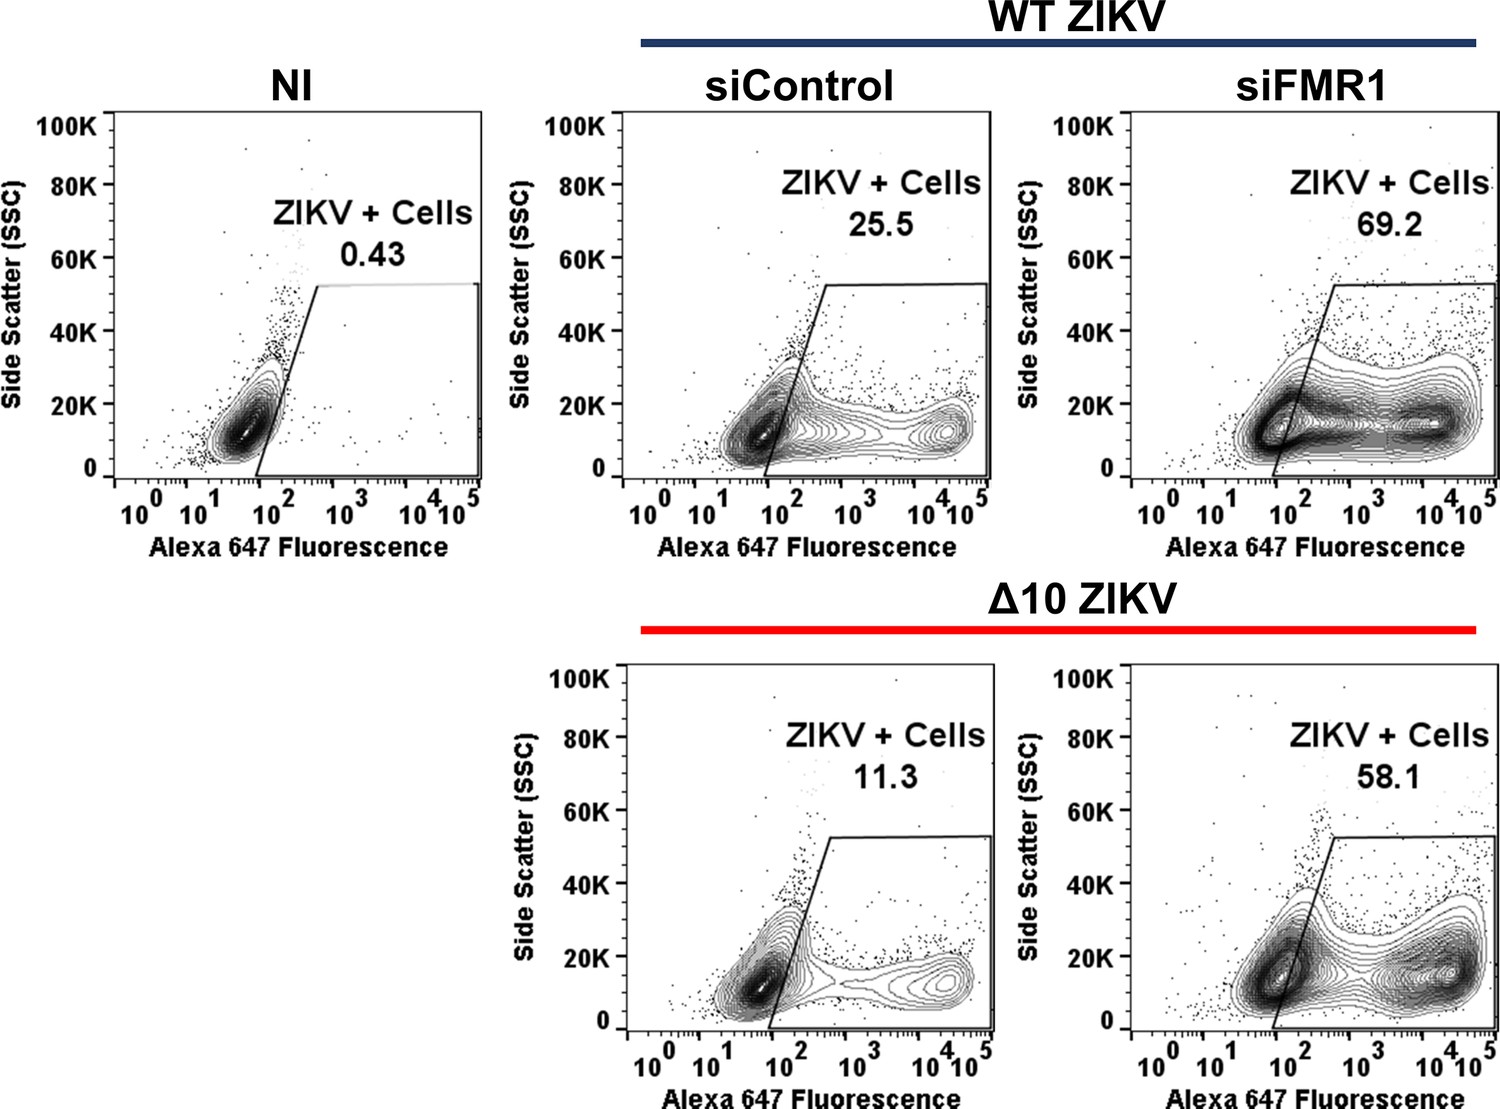
Scatter plots of WT and ∆10 ZIKV infected cells.
Representative scatter plots obtained by flow cytometry and used to construct Figure 5C, indicate the infection rate in cells transfected with control siRNA (siControl) or FMR1 siRNA (siFMR1) and infected with WT and ∆10 ZIKV. ZIKV +cells are identified by positive staining for ZIKV E protein (Alexa fluor 647 fluorescence). NI, non-infected cells.
Figure 6 with 2 supplements
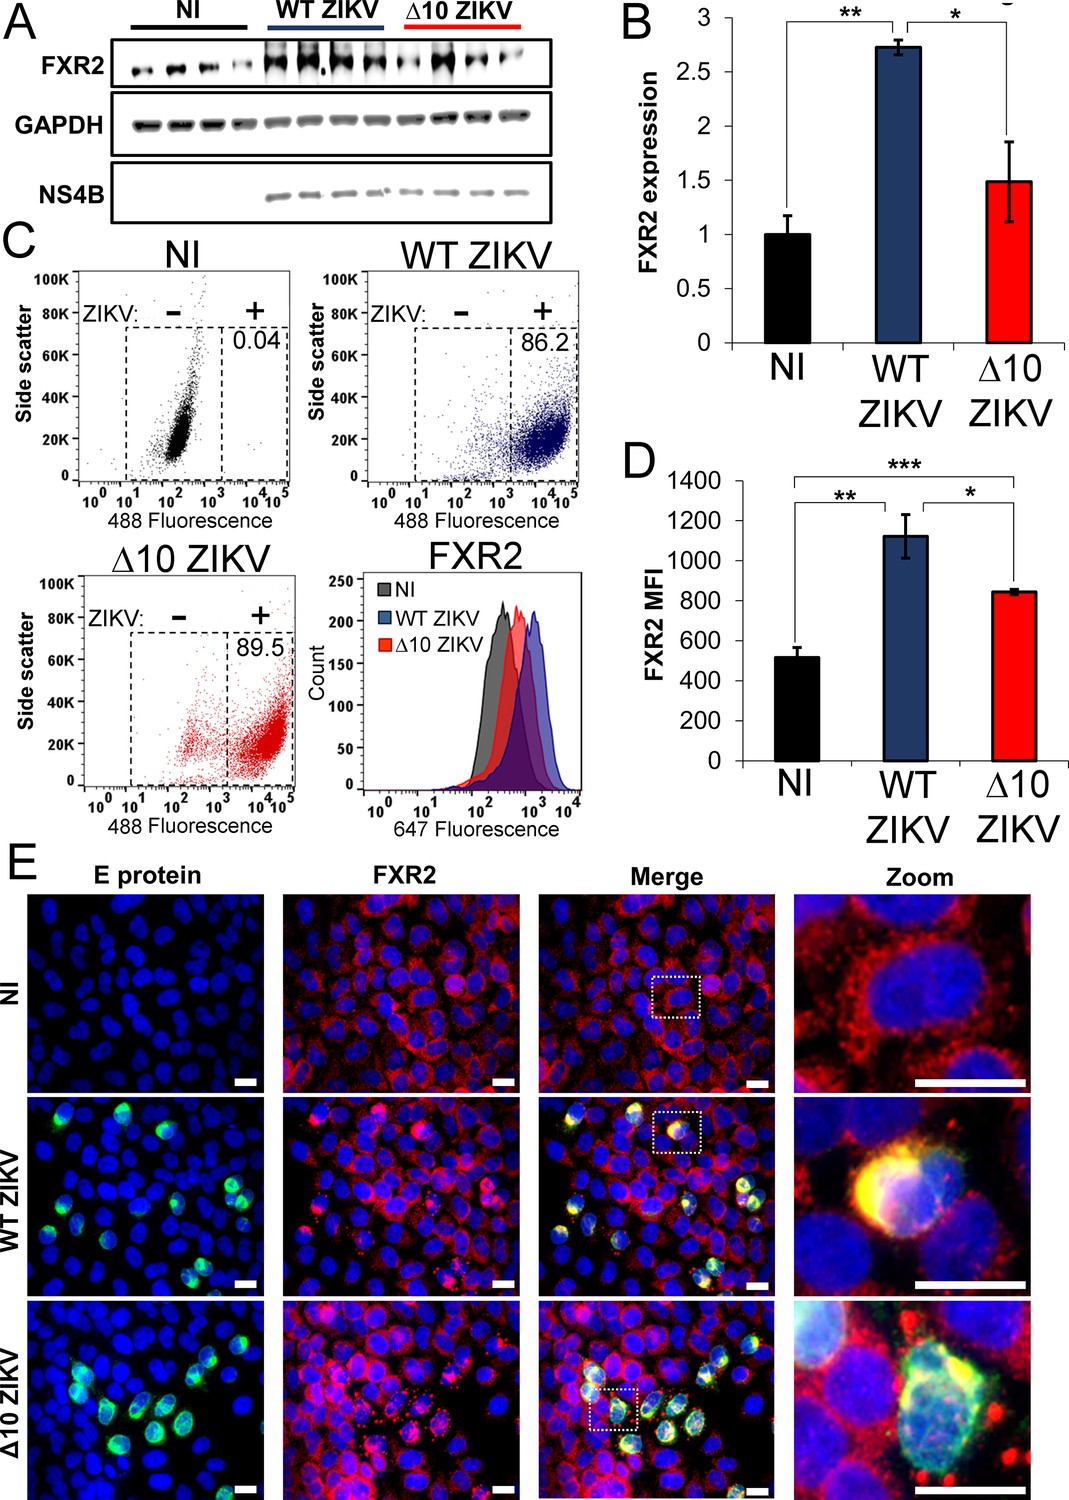
ZIKV infection increases expression of FXR2.
HeLa cells were infected with WT (MOI of 3) or ∆10 ZIKV (MOI of 4.5) or left non-infected (NI). At 24 hr post-infection, cells were harvested and analyzed for FXR2 expression. (A) WB showing expression of FXR2, GAPDH and ZIKV NS4B. (B) Normalized expression levels of FXR2 from panel A are shown. (C) Flow cytometry for FXR2 and ZIKV E protein. E protein was stained using the 4G2 antibody and Alexa fluor 488-labeled secondary antibody. FXR2 protein was stained with anti-FXR2 and Alexa fluor 647-labeled secondary antibody. Scatter plots indicate the distribution of ZIKV positive cells in the NI cells (black, top left panel), WT ZIKV (blue, top right panel) and ∆10 ZIKV (red, bottom left panel) infected cells. Histograms (bottom right panel) indicate FXR2 expression as Alexa fluor 647 mean fluorescence intensity (MFI). (D) Graph shows the FXR2 MFI. Data is presented as the mean ±SEM of one of three independent experiments (*p<0.05, **p<0.005, ***p<0.001). (E) Representative immunofluorescence images from two independent experiments indicate the accumulation of FXR2 (red) in cells infected with WT and ∆10 ZIKV (green). Nuclei were counterstained with Hoechst 33342. White scale bar = 20 µm.
-
Figure 6—source data 1
- https://doi.org/10.7554/eLife.39023.021
Figure 6—figure supplement 1
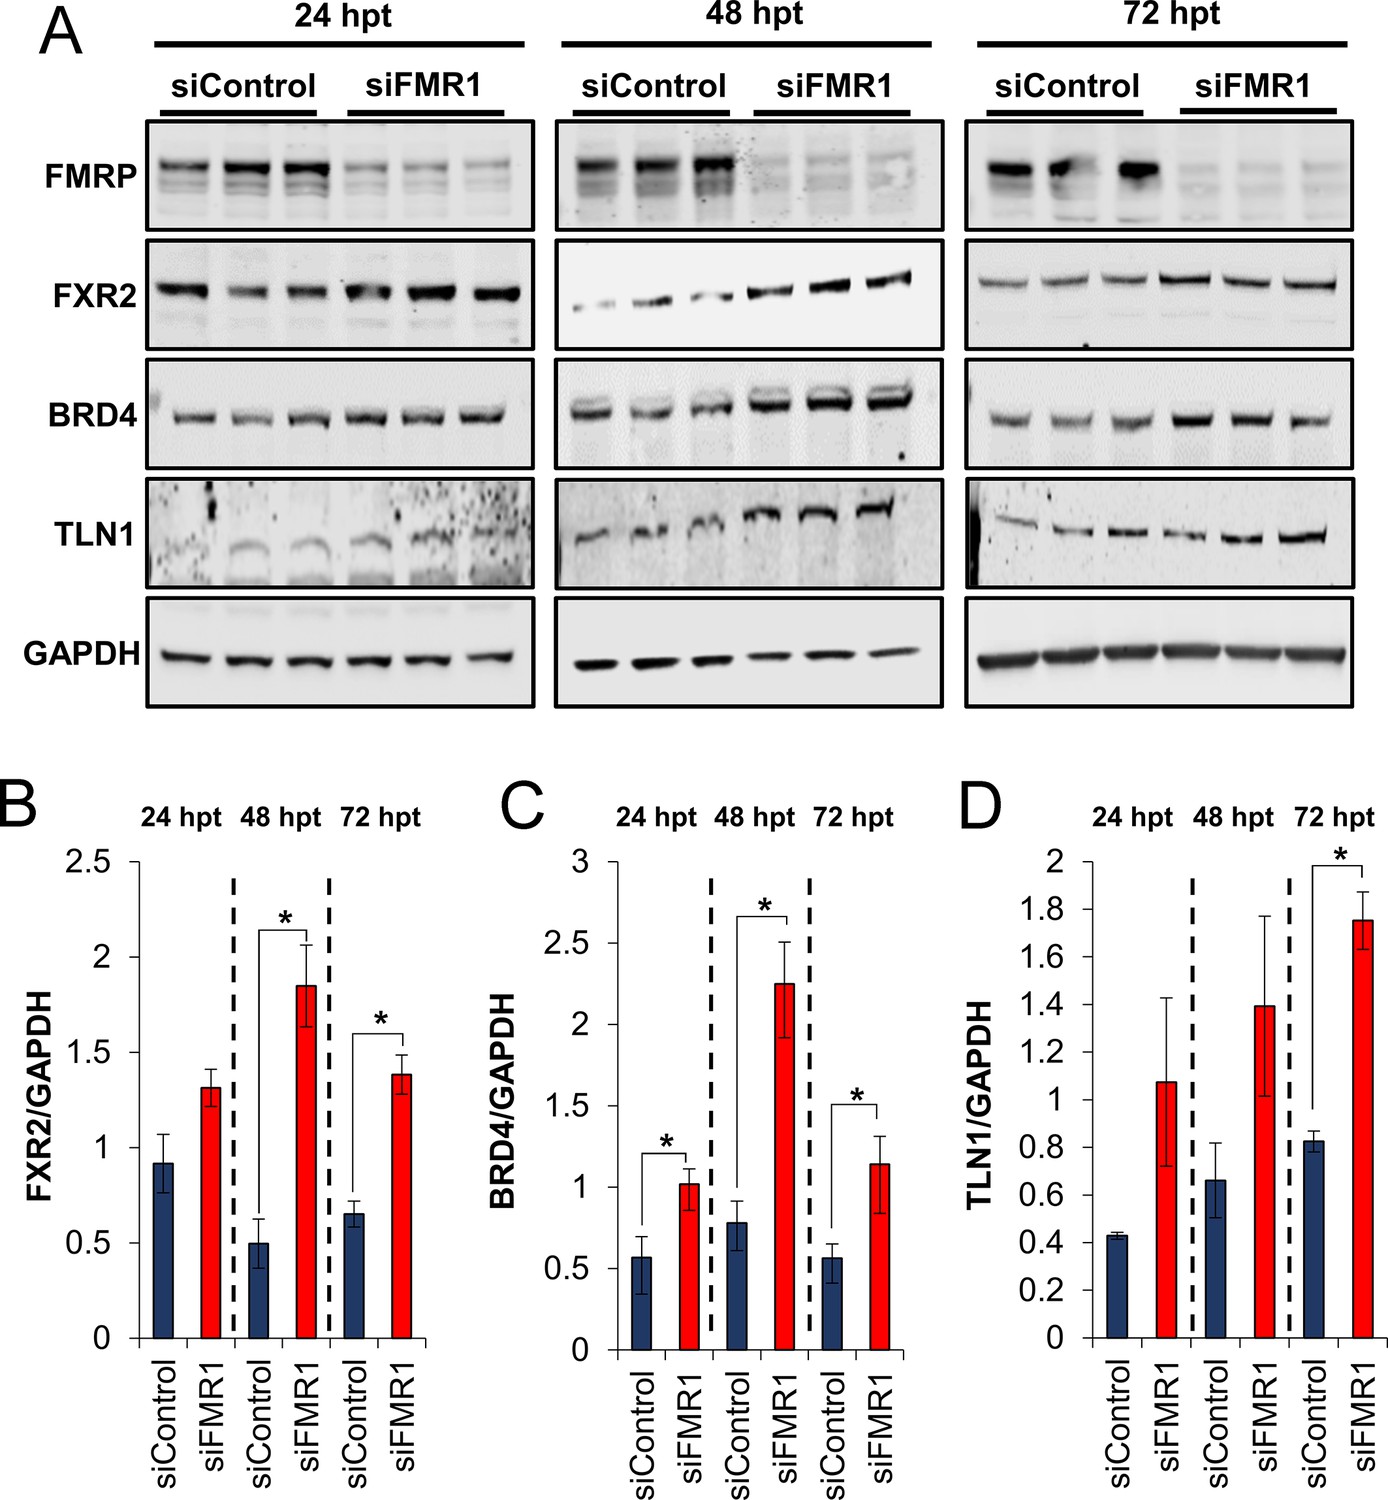
FMRP knockdown increases protein levels of known FMRP targets.
HeLa cells were transfected with control siRNA (siControl) and FMR1 siRNA (siFMR1 pool) and relative protein expression of FXR2, BRD4 and TLN1 was evaluated by WB assays (A) and densitometry analysis (normalized to GAPDH expression as loading control) after 24 (B), 48 (C) and 72 (D) hours post-transfection (hpt). Data represents the mean ±SEM of three biological replicates (*p<0.05).
Figure 6—figure supplement 2
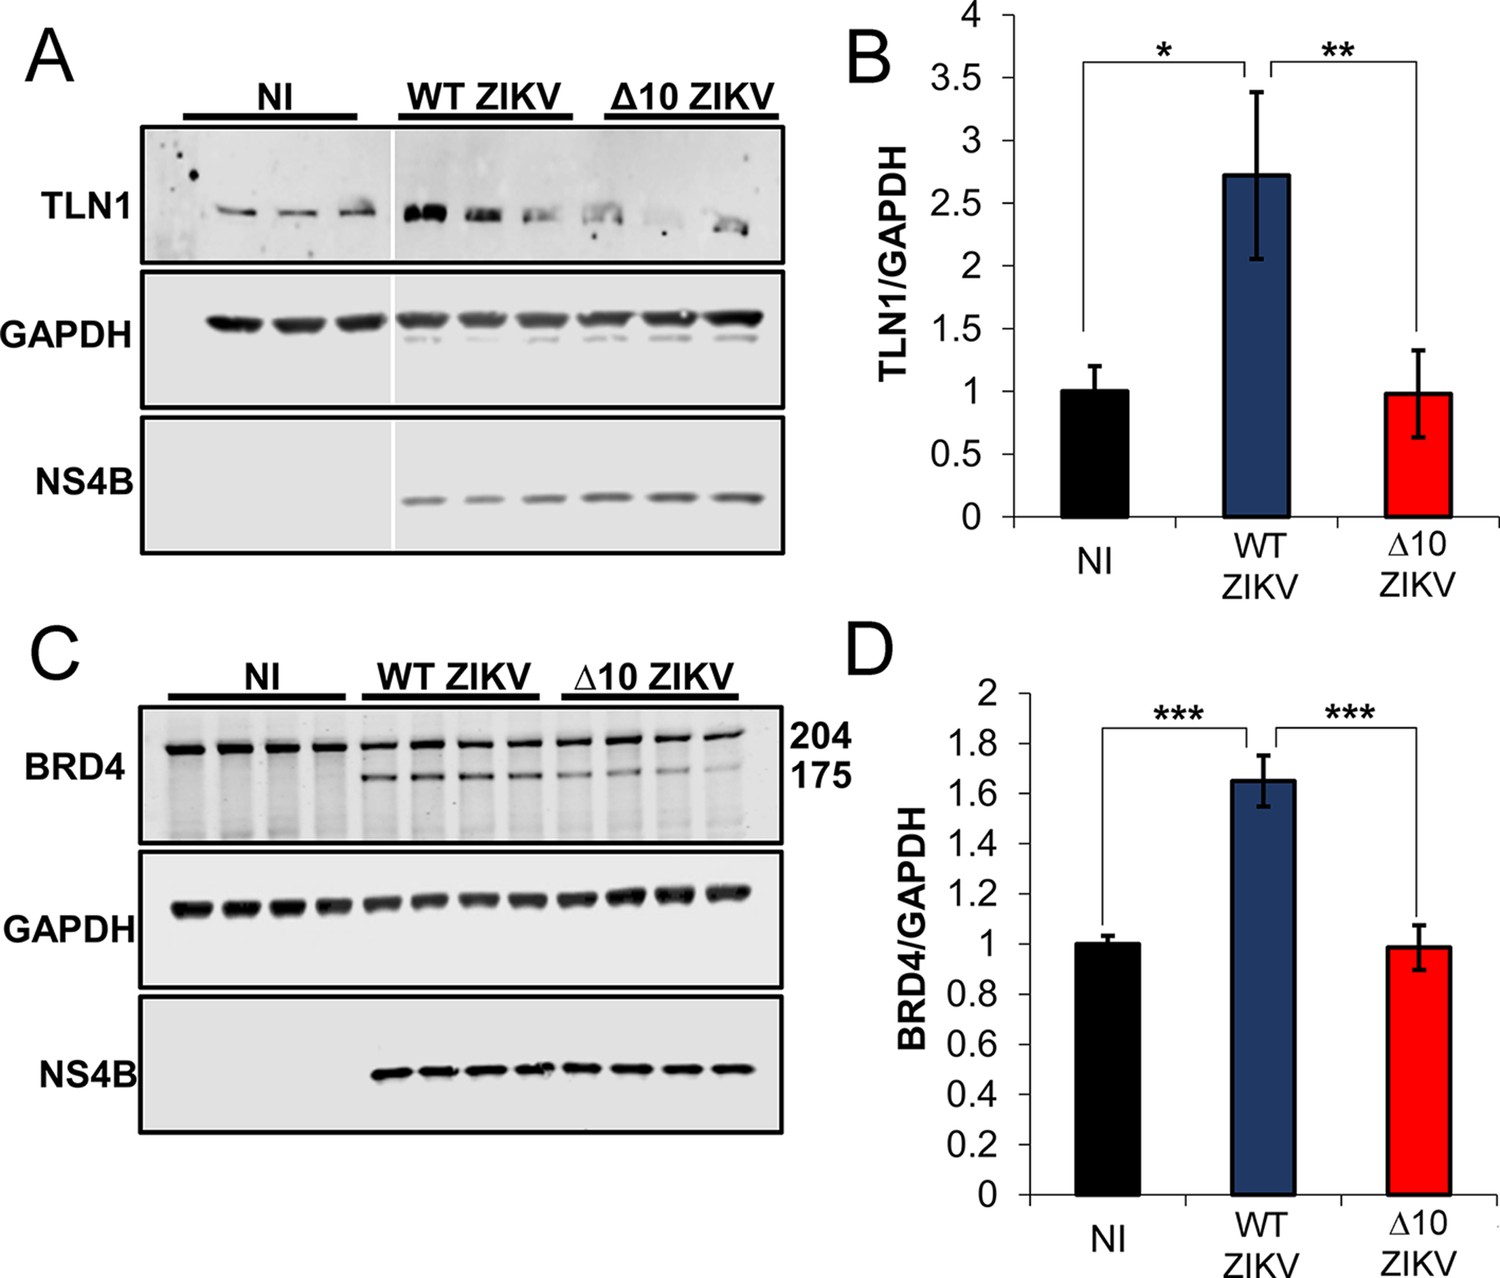
Differential expression of TLN1 and BRD4 during infection with WT ZIKV and ∆10 ZIKV.
HeLa cells were infected with WT (MOI of 3) and ∆10 ZIKV (MOI of 4.5) or left non-infected (NI) as control. After 24 hr post-infection cells were harvested and analyzed for expression of validated FMRP targets TLN1 and BRD4. WB assays indicate the expression of TLN1 (A) and BRD4 (C), GAPDH (loading control) and viral protein NS4B. (B) Relative expression of TLN1 in WT and ∆10 ZIKV infected cells was analyzed by densitometry, adjusted to loading control and normalized to non-infected cells (NI). An additional 175 kDa band reactive to the anti-BRD4 shows up only in ZIKV infected cells. (D) Densitometry values corresponding to both immunoreactive bands, 204 and 175 kDa, were summed, adjusted to GAPDH and normalized to non-infected cells (NI). Data indicates the mean ±SEM of two independent experiments (*p<0.05, **p<0.005, ***p<0.001).
Figure 7
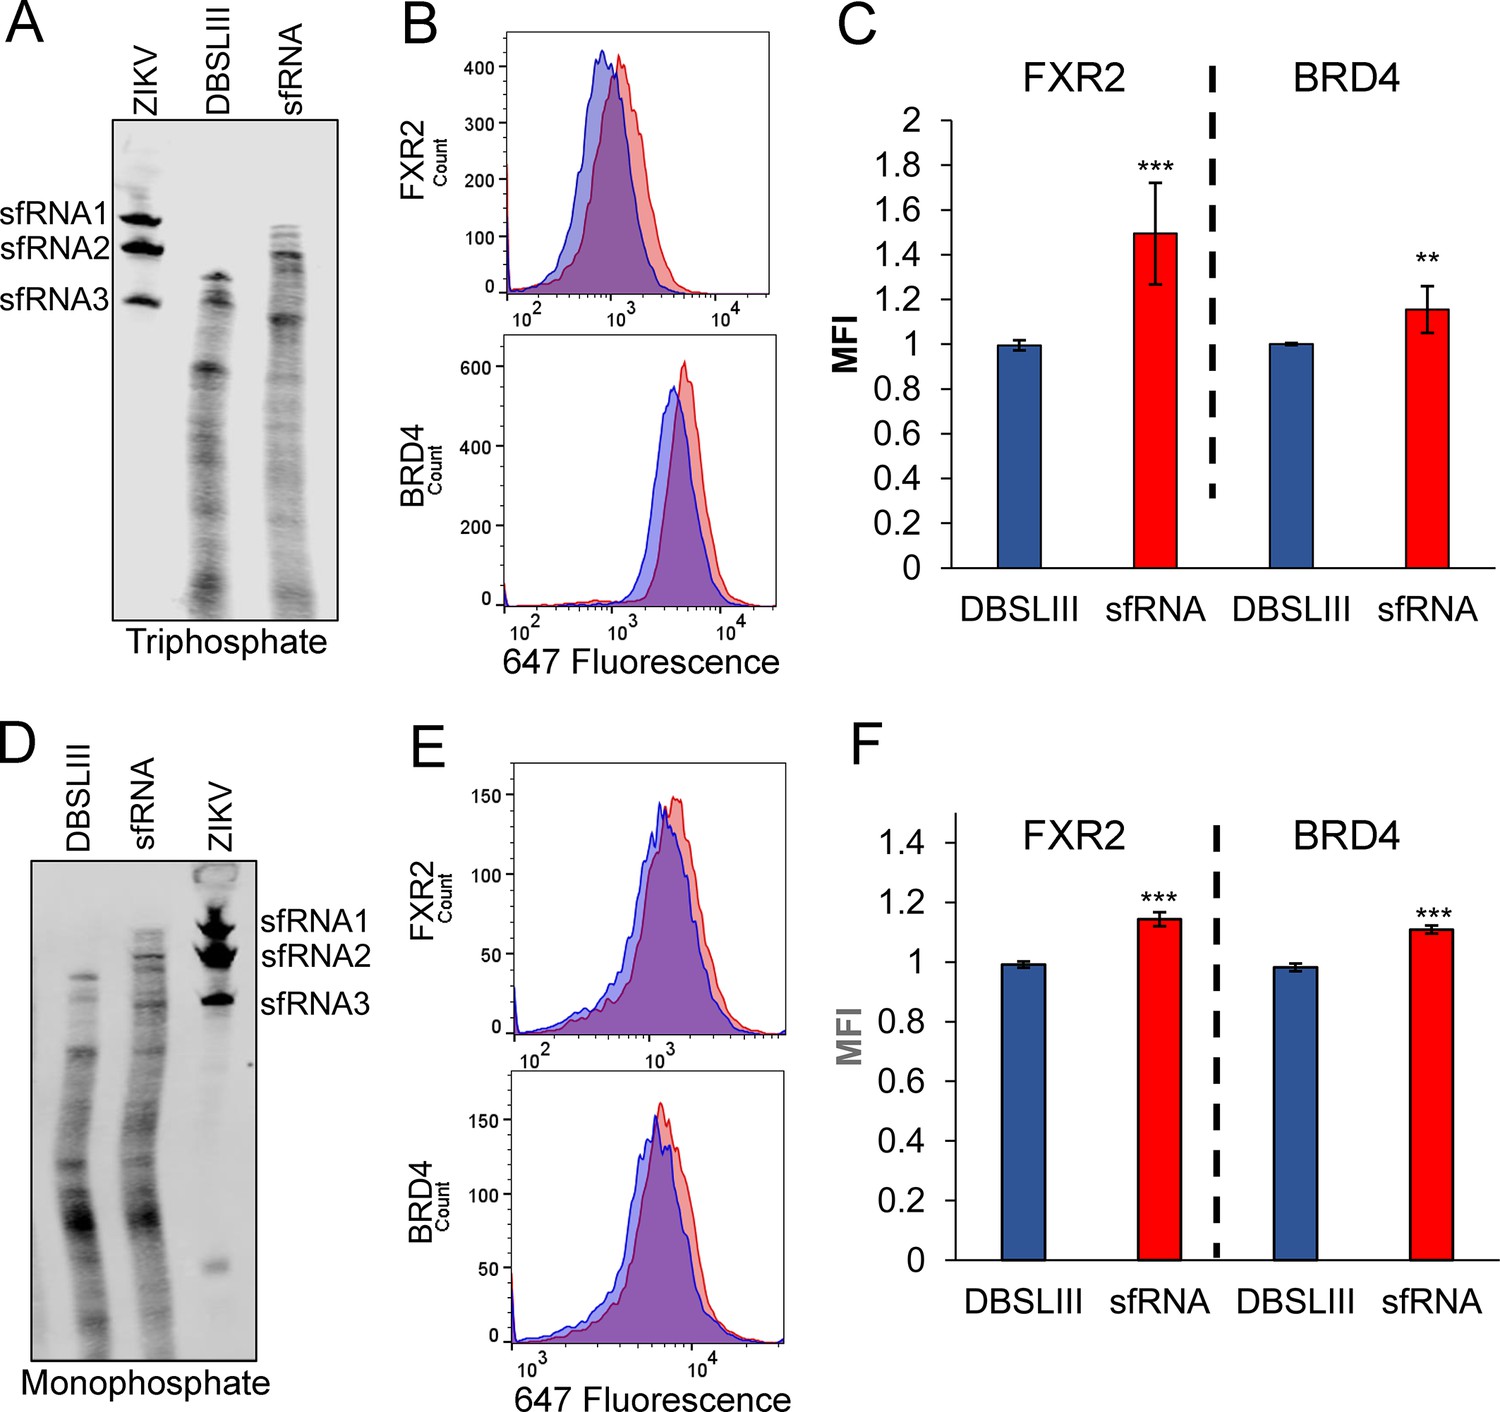
ZIKV sfRNA increases expression of FXR2 and BRD4 in the absence of infection.
Electroporated 5′ triphosphate (A) or monophosphate (D) RNAs were analyzed by northern blot, 48 hr after electroporation. Total RNA from cells infected with ZIKV-Puerto Rico was analyzed to visualize the presence of sfRNA1, sfRNA2 and sfRNA3. The expression levels of FXR2 and BRD4 were evaluated by flow cytometry in cells electroporated with 5′ triphosphate (B,C) or monophosphate (E,F) RNAs. Mean fluorescence intensities (MFI) in presence of the mutant control DBSLIII (blue) and sfRNA (red) are shown. Plots in C and F represent the mean ±SD of four and two independent experiments, respectively. (*p<0.05, **p<0.005, ***p<0.001). MFI intensities were normalized to the mutant control. .
-
Figure 7—source data 1
- https://doi.org/10.7554/eLife.39023.023
Figure 8

ZIKV infection increases the expression of FMRP targets in infected mouse testes.
A129 mice were non-infected (NI; N = 3) or infected with WT (N = 4) or ∆10 ZIKV (N = 4) with 1 × 10⁵ FFU. At 6 days post-infection, mice were euthanized, and testes were removed for lysis. (A) Protein expression levels of FXR2 and PNPLA6 were analyzed by WB. No FXR2 was detected in mouse #2 infected with ∆10 ZIKV and we therefore eliminated this sample from the analysis. (B) A fraction of testes lysates was processed for RNA isolation and levels of viral genomes were measured by RT-qPCR using a pair of primers that amplify a region of the ZIKV ORF. GAPDH was used as loading control for WB assays and calibrator gene for RT-qPCR. Relative protein expression levels of FXR2 (C) and PNPLA6 (D) were measured by densitometry analysis, adjusted to loading control and normalized to non-infected mouse (NI). Error bars represent the mean ±SEM of three mice for non-infected condition (NI), four mice for WT ZIKV and three mice for ∆10 ZIKV. *p<0.05. N.D, non-detected. .
-
Figure 8—source data 1
- https://doi.org/10.7554/eLife.39023.025
Tables
Table 1
List of ZIKV 3′ UTR binding proteins identified by label-free mass spectrometry.
https://doi.org/10.7554/eLife.39023.003| Normalized abundance§ | Ratio vs NS2A# | ||||||
|---|---|---|---|---|---|---|---|
| Accession* | Unique peptides† | Confidence score‡ | NS2A | PRVABC59 3′ UTR | MR766 3′ UTR | PRVABC59 3′ UTR | MR766 3′ UTR |
| sp|P51116|FXR2_HUMAN | 2 | 129.6 | 1.8E + 04 | 6.1E + 05 | 8.2E + 05 | 34.3 | 46 |
| sp|P51114|FXR1_HUMAN | 12 | 897.8 | 6.2E + 05 | 8.2E + 06 | 9.9E + 06 | 13.4 | 16 |
| sp|Q06787|FMR1_HUMAN | 6 | 361.7 | 1.1E + 05 | 1.4E + 06 | 1.7E + 06 | 12.3 | 15 |
| sp|P26196|DDX6_HUMAN | 9 | 723.9 | 4.7E + 05 | 2.0E + 06 | 3.9E + 06 | 4.2 | 8 |
| sp|Q9Y520|PRC2C_HUMAN | 4 | 218.0 | 3.8E + 04 | 1.3E + 05 | 1.8E + 05 | 3.3 | 5 |
| sp|P15927|RFA2_HUMAN | 2 | 165.8 | 3.5E + 04 | 1.6E + 05 | 1.3E + 05 | 4.7 | 4 |
| sp|Q8N0V3|RBFA_HUMAN | 2 | 136.3 | 7.3E + 04 | 1.6E + 05 | 2.2E + 05 | 2.2 | 3 |
| sp|P06748|NPM_HUMAN | 5 | 623.9 | 5.5E + 06 | 1.1E + 07 | 1.6E + 07 | 2.0 | 3 |
-
*Unique identifier number of the protein.
†Number of peptide sequences uniquely identified for each protein.
-
‡Confidence score (−10logP) reflects how well the MS/MS spectrum matches the peptides for all observed mass spectra that correspond to sequences within the protein. A higher score indicates a more confident match.
§Protein abundances were calculated by measuring the area under the curve of the corresponding peaks in the ion chromatogram.
-
#Protein abundances of RBPs interacting with PRVABC59 and MR766 ZIKV 3′ UTRs were compared with NS2A control RNA to calculate ratio of enrichment (PRVABC59 3′ UTR/NS2A and MR766 3′ UTR/NS2A). Proteins enriched >2 fold and with unique peptides ≥ 2 were considered to be high-confidence ZIKV 3′ UTR interacting proteins.
-
Table 1—source data 1
- https://doi.org/10.7554/eLife.39023.004
Key resources table
| Reagent type (species) or resource | Designation | Source or reference | Identifiers | Additional information |
|---|---|---|---|---|
| Genetic reagent (Mus musculus) | A129 IFNAR Knock out mouse | UTMB, Galveston, TX | MGI:5652612 | Rossi et al. (2016) PMID 27022155 |
| Antibody | 4G2 antibody; anti-Flavivirus envelope (Mouse monoclonal) | D1-4G2-4-15 Hybridome cell line | RRID for Hybridome cell line: CVCL_J890 | Henchal et al. (1982) PMID 6285749 |
| Antibody | Anti-FMRP (Rabbit polyclonal) | Abcam | Abcam Cat# ab17722, RRID:AB_2278530 | (1:1000) |
| Antibody | Anti-FXR1 (Rabbit monoclonal) | Cell Signaling Technology | Cat#12295S | (1:1000) |
| Antibody | Anti-FXR2 (Rabbit monoclonal) | Cell Signaling Technology | Cell Signaling Technology Cat# 7098S, RRID:AB_10891808 | (1:1000) |
| Antibody | Anti-G3BP1 (Rabbit polyclonal) | Bethyl | Bethyl Cat# A302-033A, RRID:AB_1576539 | (1:1000) |
| Antibody | Rabbit anti-PTB (Rabbit polyclonal) | Homemade | Wagner and Garcia-Blanco, 2002. PMID 12419237 | (1:4000) |
| Antibody | Anti-ZIKV NS4B (Rabbit polyclonal) | Genetex | GTX133321 | (1:1000) |
| Antibody | Anti-ZIKV NS2B (polyclonal) | Genetex | GeneTex Cat# GTX133308, RRID:AB_2715494 | (1:1000) |
| Antibody | Anti-BRD4 (Rabbit monoclonal) | Cell Signaling Technology | Cell Signaling Technology Cat# 13440, RRID:AB_2687578 | (1:1000) |
| Antibody | Anti-GAPDH (Rabbit polyclonal) | Abcam | Abcam Cat# ab9485, RRID:AB_307275 | (1:4000) |
| Antibody | Anti-TLN1 (Mouse monoclonal) | Santa Cruz Biotechnology | Santa Cruz Biotechnology Cat# sc-365875, RRID:AB_10842054 | (1:300) |
| Antibody | Anti-PNPLA6 (Mouse monoclonal) | Santa Cruz Biotechnology | Santa Cruz Biotechnology Cat# sc-271049, RRID:AB_10610321 | (1:1000) |
| Antibody | Anti-DDX6 (Rabbit polyclonal) | Cell Signaling Technology | Cell Signaling Technology Cat# 9407S, RRID:AB_10556959 | (1:1000) |
| Sequence-based reagent | siFMR1_10 | Qiagen | SI04916436 | TCCAAGGAACTTAGTAGGCAA |
| Sequence-based reagent | siFMR1_4 | Qiagen | SI00031626 | TCCGTAATTCTTATTCCATAT |
| Sequence-based reagent | siFMR1_3 | Qiagen | SI00031619 | CTCGTGAATGGAGTACCCTAA |
| Sequence-based reagent | siFMR1_2 | Qiagen | SI00031612 | CTGTCAAACATTAGTACTTTA |
| Sequence-based reagent | siFXR1_5 | Qiagen | SI03040429 | ACCGTCGTAGGCGGTCTCGTA |
| Sequence-based reagent | siFXR1_3 | Qiagen | SI00072247 | GTGGTTCGAGTGAGAATTGAA |
| Sequence-based reagent | siFXR1_2 | Qiagen | SI00072240 | CAGCTAAGAATGGAACGCCTA |
| Sequence-based reagent | siFXR1_1 | Qiagen | SI00072233 | ATGGAATGACTGAATCTGATA |
| Sequence-based reagent | siFXR2_8 | Qiagen | SI04347833 | TGGGTGATATGCATTTCCGAA |
| Sequence-based reagent | siFXR2_7 | Qiagen | SI04332454 | CTGGAACGCACTAAACCCTCA |
| Sequence-based reagent | siFXR2_6 | Qiagen | SI04316445 | AAACGTCCATAAAGAGTTCAA |
| Sequence-based reagent | siFXR2_5 | Qiagen | SI04284763 | TGGAGCGACTTCGGCCAGTTA |
| Commercial assay or kit | Northern Max kit | Thermo Fisher Scientific | Cat#:AM1940 | |
| Commercial assay or kit | HiScribe T7 High Yield RNA Synthesis Kit | New England Biolabs | Cat#: E2040S | |
| Chemical compound, drug | NITD008 | Other | CAS number: 1044589-82-3; Pubchem ID: 44633776 | Yin et al. (2009) PMID 19918064 |
Additional files
-
Transparent reporting form
- https://doi.org/10.7554/eLife.39023.026
Download links
A two-part list of links to download the article, or parts of the article, in various formats.
Downloads (link to download the article as PDF)
Open citations (links to open the citations from this article in various online reference manager services)
Cite this article (links to download the citations from this article in formats compatible with various reference manager tools)
Fragile X mental retardation protein is a Zika virus restriction factor that is antagonized by subgenomic flaviviral RNA
eLife 7:e39023.
https://doi.org/10.7554/eLife.39023


