Molecular basis of wax-based color change and UV reflection in dragonflies
- Ryo Futahashi

- Yumi Yamahama
- Migaku Kawaguchi
- Naoki Mori
- Yuji Hirai
- Ryouka Kawahara-Miki
- Kazutoshi Yoshitake
- Shunsuke Yajima
- Takahiko Hariyama
- Takema Fukatsu
- National Institute of Advanced Industrial Science and Technology (AIST), Japan
- Hamamatsu University School of Medicine, Japan
- Graduate School of Agriculture, Kyoto University, Japan
- Graduate School of Engineering, Nagoya Institute of Technology, Japan
- Graduate School of Science, The University of Tokyo, Japan
- Chitose Institute of Science and Technology, Japan
- Tokyo University of Agriculture, Japan
- University of Tokyo, Japan
- University of Tsukuba, Japan
Figures
Figure 1
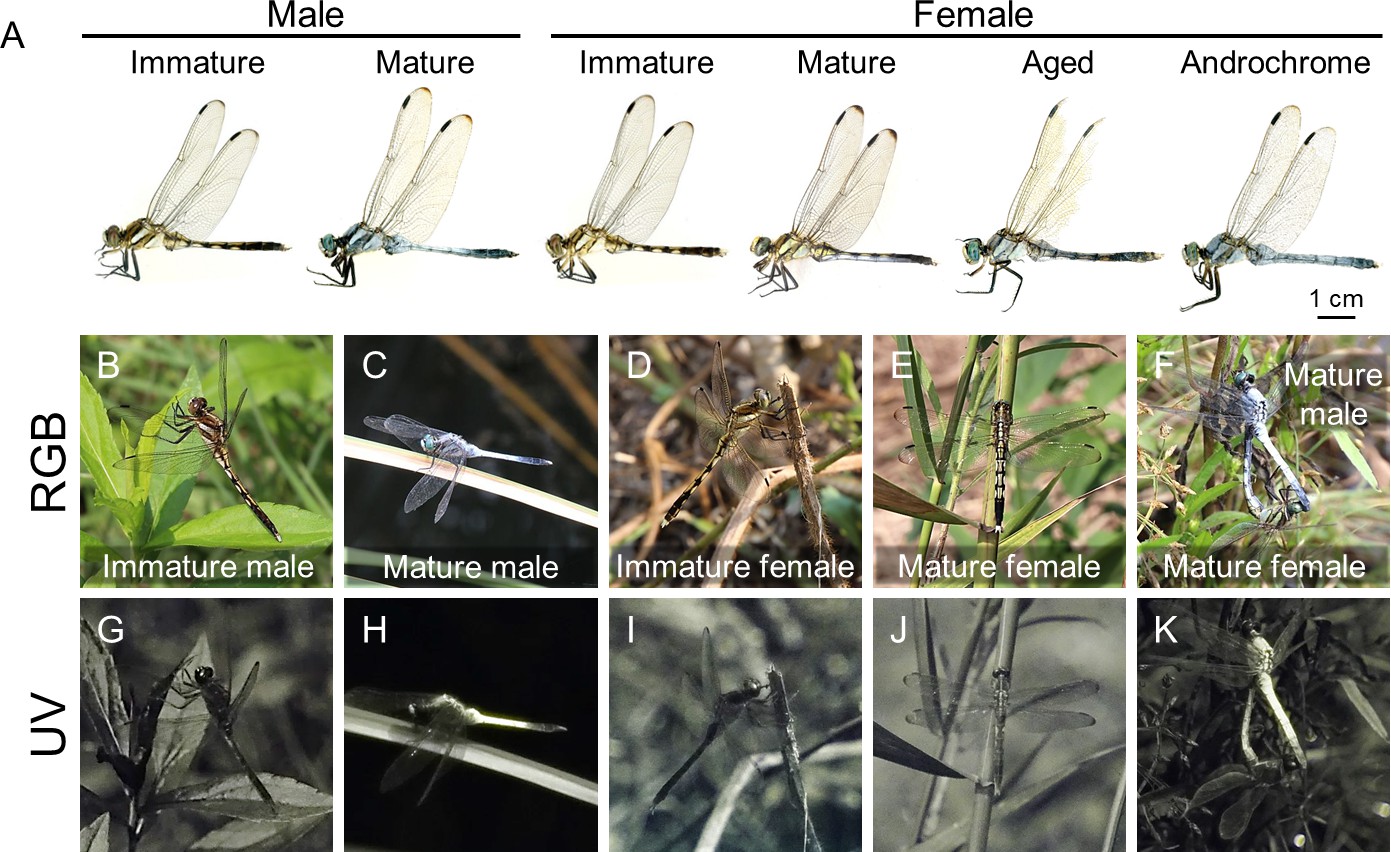
Stage- and sex-dependent adult color change in O. albistylum as visualized in red, green, blue (RGB) and ultraviolet (UV) light.
(A) Adult males and females of O. albistylum. (B, G) Immature male. (C, H) Mature male. (D, I) Immature female. (E, J) Mature female. (F, K) Mating pair. Images photographed normally (B–F) or through a UV filter (G–K) in the field.
Figure 2 with 1 supplement
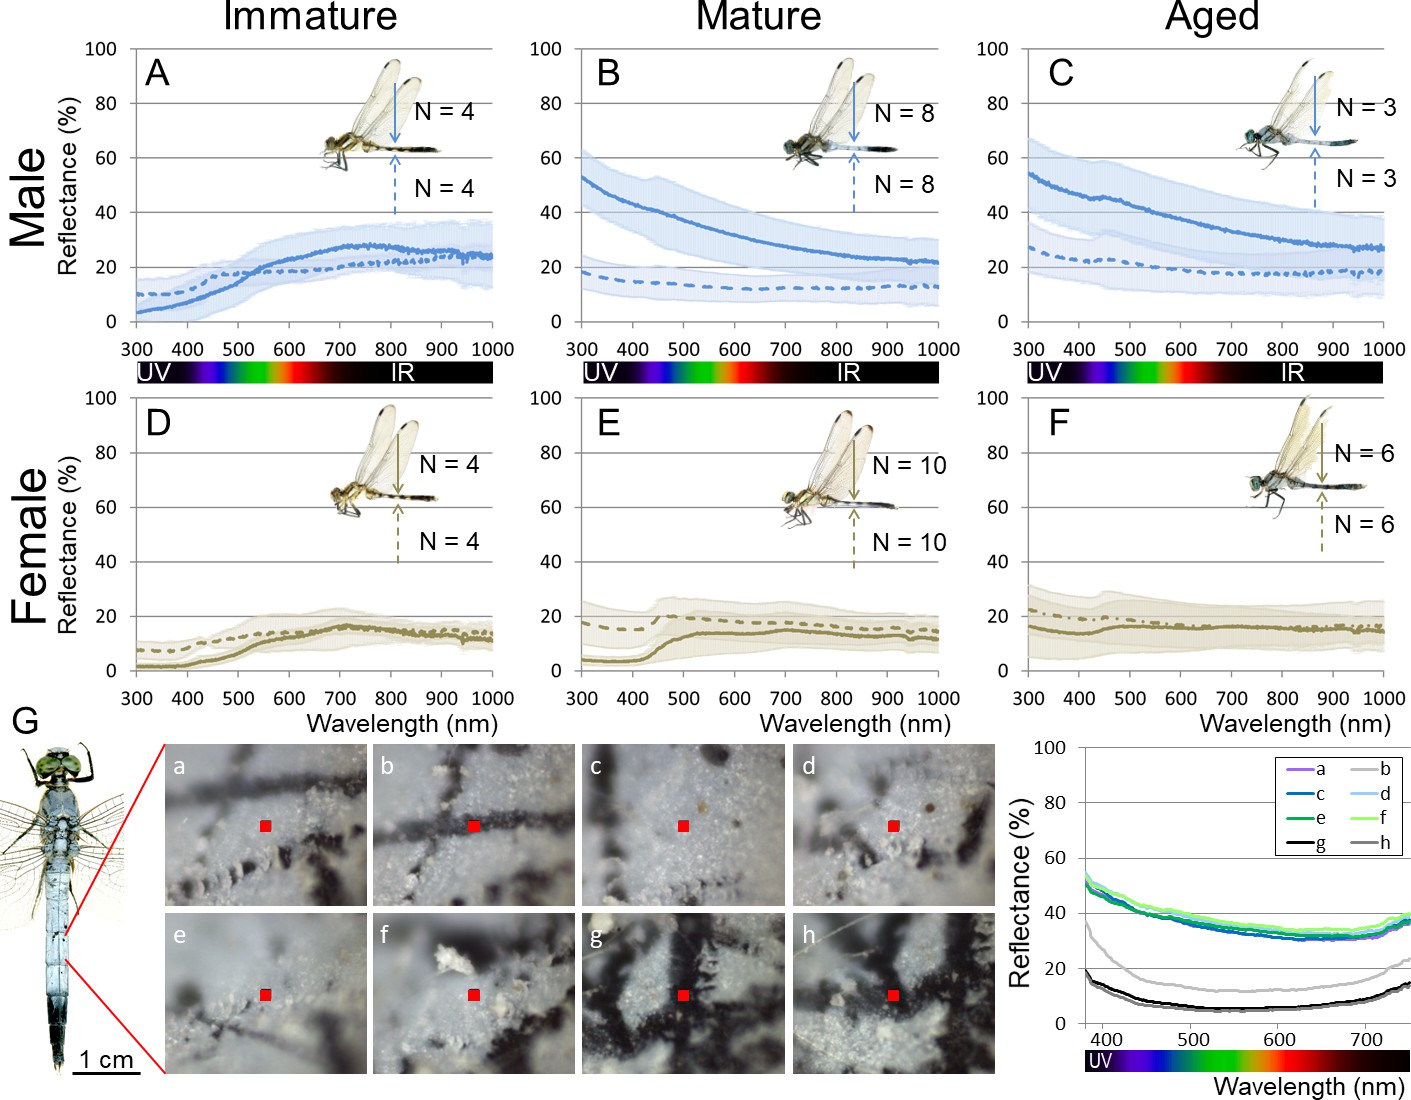
Reflectance of the adult body surface at the 5th abdominal segment of O. albistylum.
(A–F) Spectrometry of a round area (6 mm in diameter) in males (A–C) and females (D–F). (A, D) Immature individuals. (B, E) Mature individuals. (C, F) Aged individuals. Solid and dotted lines indicate averaged UV reflectance on the dorsal and ventral sides of the abdomen, respectively. The standard deviation is shaded. (G) Micro-spectrometry of the 5th abdominal segment of a mature male. UV reflectance was measured in eight micro-areas (10 μm x 10 μm each) depicted as red squares in the photos. In the photos, white areas are covered with secreted wax whereas black areas are without wax, presumably because of accidental scratches and cracks on the adult body surface.
-
Figure 2—source data 1
Spectrometry of a round area (6 mm in diameter) of immature males and females of O. albistylum.
- https://doi.org/10.7554/eLife.43045.006
-
Figure 2—source data 2
Spectrometry of a round area (6 mm in diameter) of mature males and females of O. albistylum.
- https://doi.org/10.7554/eLife.43045.007
-
Figure 2—source data 3
Spectrometry of a round area (6 mm in diameter) of aged males and females of O. albistylum.
- https://doi.org/10.7554/eLife.43045.008
-
Figure 2—source data 4
Micro-spectrometry of the 5th abdominal segment of a mature male of O. albistylum.
- https://doi.org/10.7554/eLife.43045.009
-
Figure 2—source data 5
Micro-spectrometry of immature males and females of O. albistylum.
- https://doi.org/10.7554/eLife.43045.010
-
Figure 2—source data 6
Micro-spectrometry of mature males and females of O. albistylum.
- https://doi.org/10.7554/eLife.43045.011
-
Figure 2—source data 7
Micro-spectrometry of aged males and females of O. albistylum.
- https://doi.org/10.7554/eLife.43045.012
Figure 2—figure supplement 1
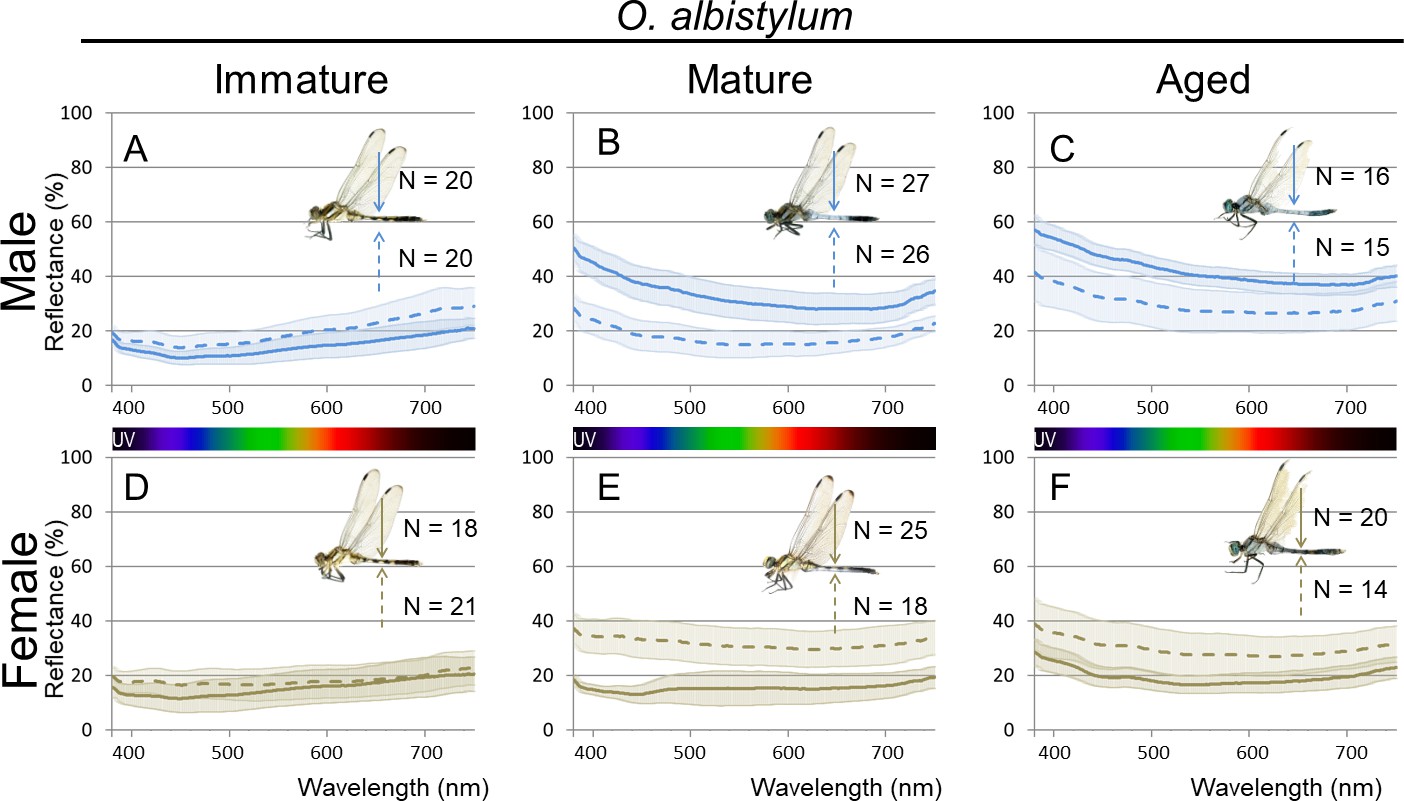
Micro-spectrometry (of 10 × 10 µm micro-areas) of O. albistylum.
(A–C) Male. (D–F) Female. (A, D) Immature individuals. (B, E) Mature individuals. (C, F) Aged individuals. Three to eight micro-areas were measured for each individual.
Figure 3
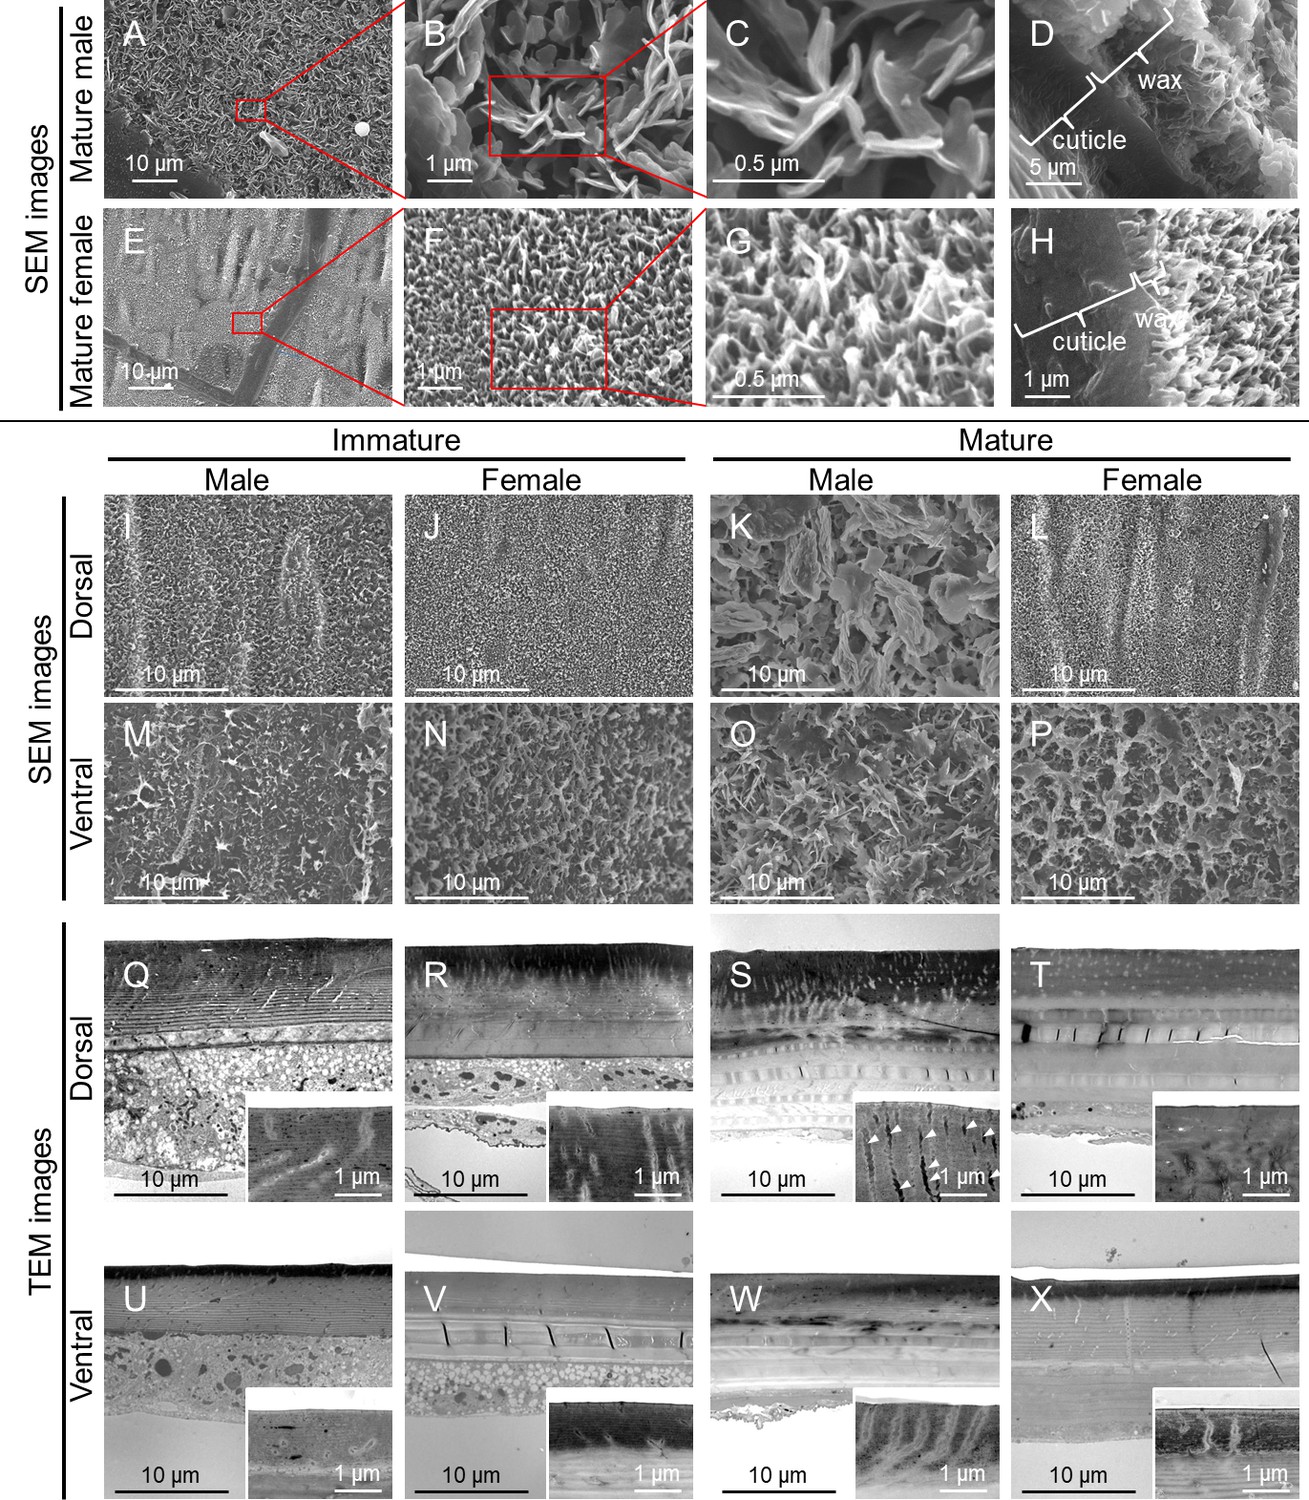
Fine structure of the adult body surface at the 5th abdominal segment of O. albistylum.
(A–P) Scanning electron microscopic (SEM) images of the body surface. (Q–X) Transmission electron microscopic (TEM) images of the sectioned cuticle. It should be noted here that the surface wax was dissolved and removed during the processing of the sample for TEM observation. (A–H) Dorsal side of mature male (A–D) and mature female (E–H). Panels B and F are magnified images of panels A and E, as indicated by red rectangles. Likewise, panels C and G are magnified images of panels B and F. (D, H) Cross-sectioned images of cuticle and surface wax. (I–L and Q–T) Dorsal side. (M–P and U–X) Ventral side. (I, M, Q, U) Immature male. (J, N, R, V) Immature female. (K, O, S, W) Mature male. (L, P, T, X) Mature female.
Figure 4
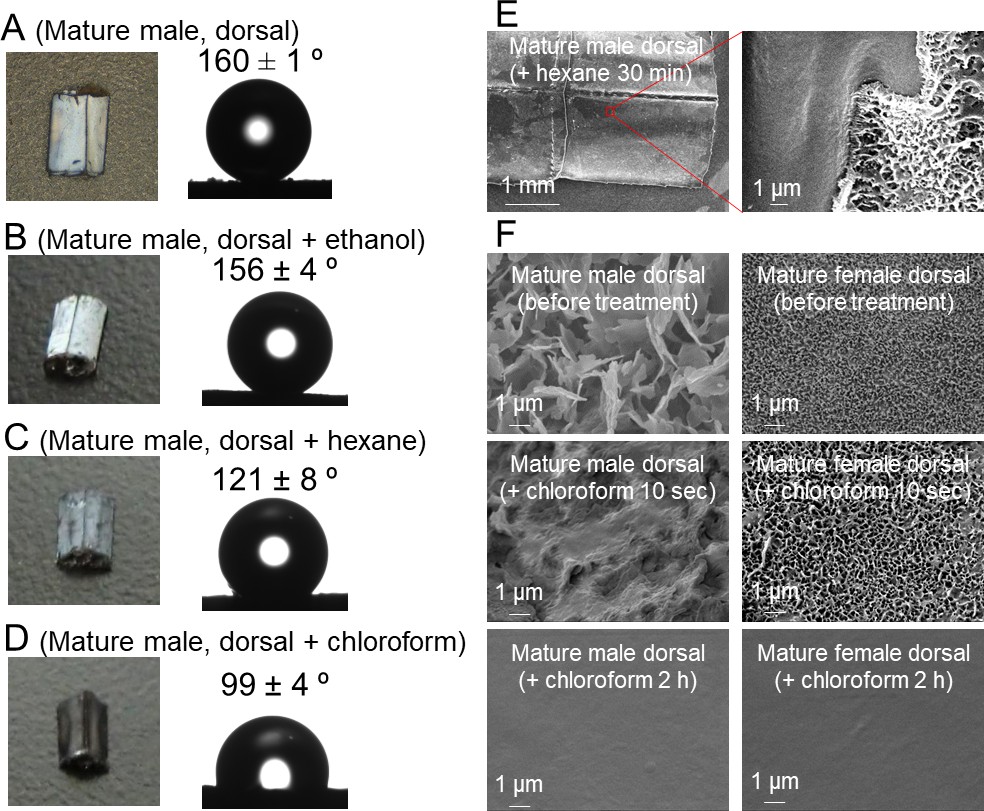
Solubility and wettability of the abdominal wax of O. albistylum.
(A–D) Dorsal side of the 5th abdominal segment of mature males. (A) No treatment. (B) After ethanol treatment. (C) After hexane treatment. (D) After chloroform treatment. (E) Scanning electron microscope images of the dorsal surface of mature male 30 min after hexane treatment. (F) Scanning electron microscope images of dorsal side of a mature male (left) or a mature female (right) after chloroform treatment.
Figure 5 with 1 supplement
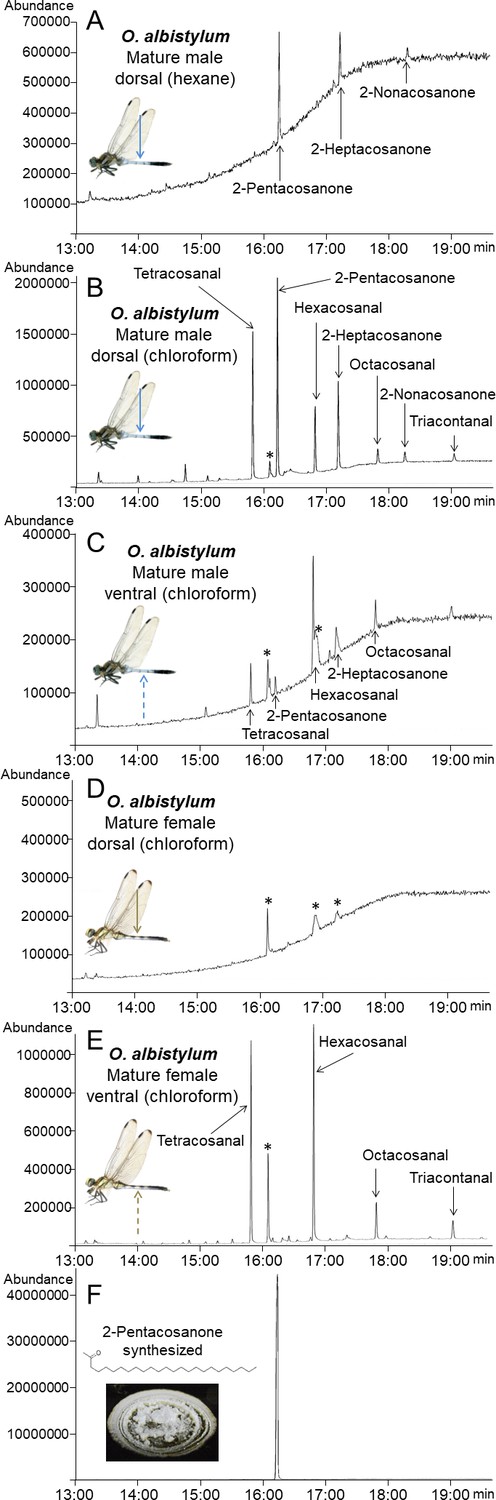
Identification and chemical synthesis of surface wax of O. albistylum.
(A) Chromatogram of hexane extract from the dorsal abdomen of a mature male. (B) Chromatogram of chloroform extract from the dorsal abdomen of a mature male. (C) Chromatogram of chloroform extract from the ventral abdomen of a mature male. (D) Chromatogram of chloroform extract from the dorsal abdomen of a mature female. (E) Chromatogram of chloroform extract from the ventral abdomen of a mature female. (F) Chromatogram of chemically synthesized 2-pentacosanone. Asterisks indicate nonspecific peaks that are also detected with the solvent only. The Y-axis shows the abundance of total ion current.
Figure 5—figure supplement 1
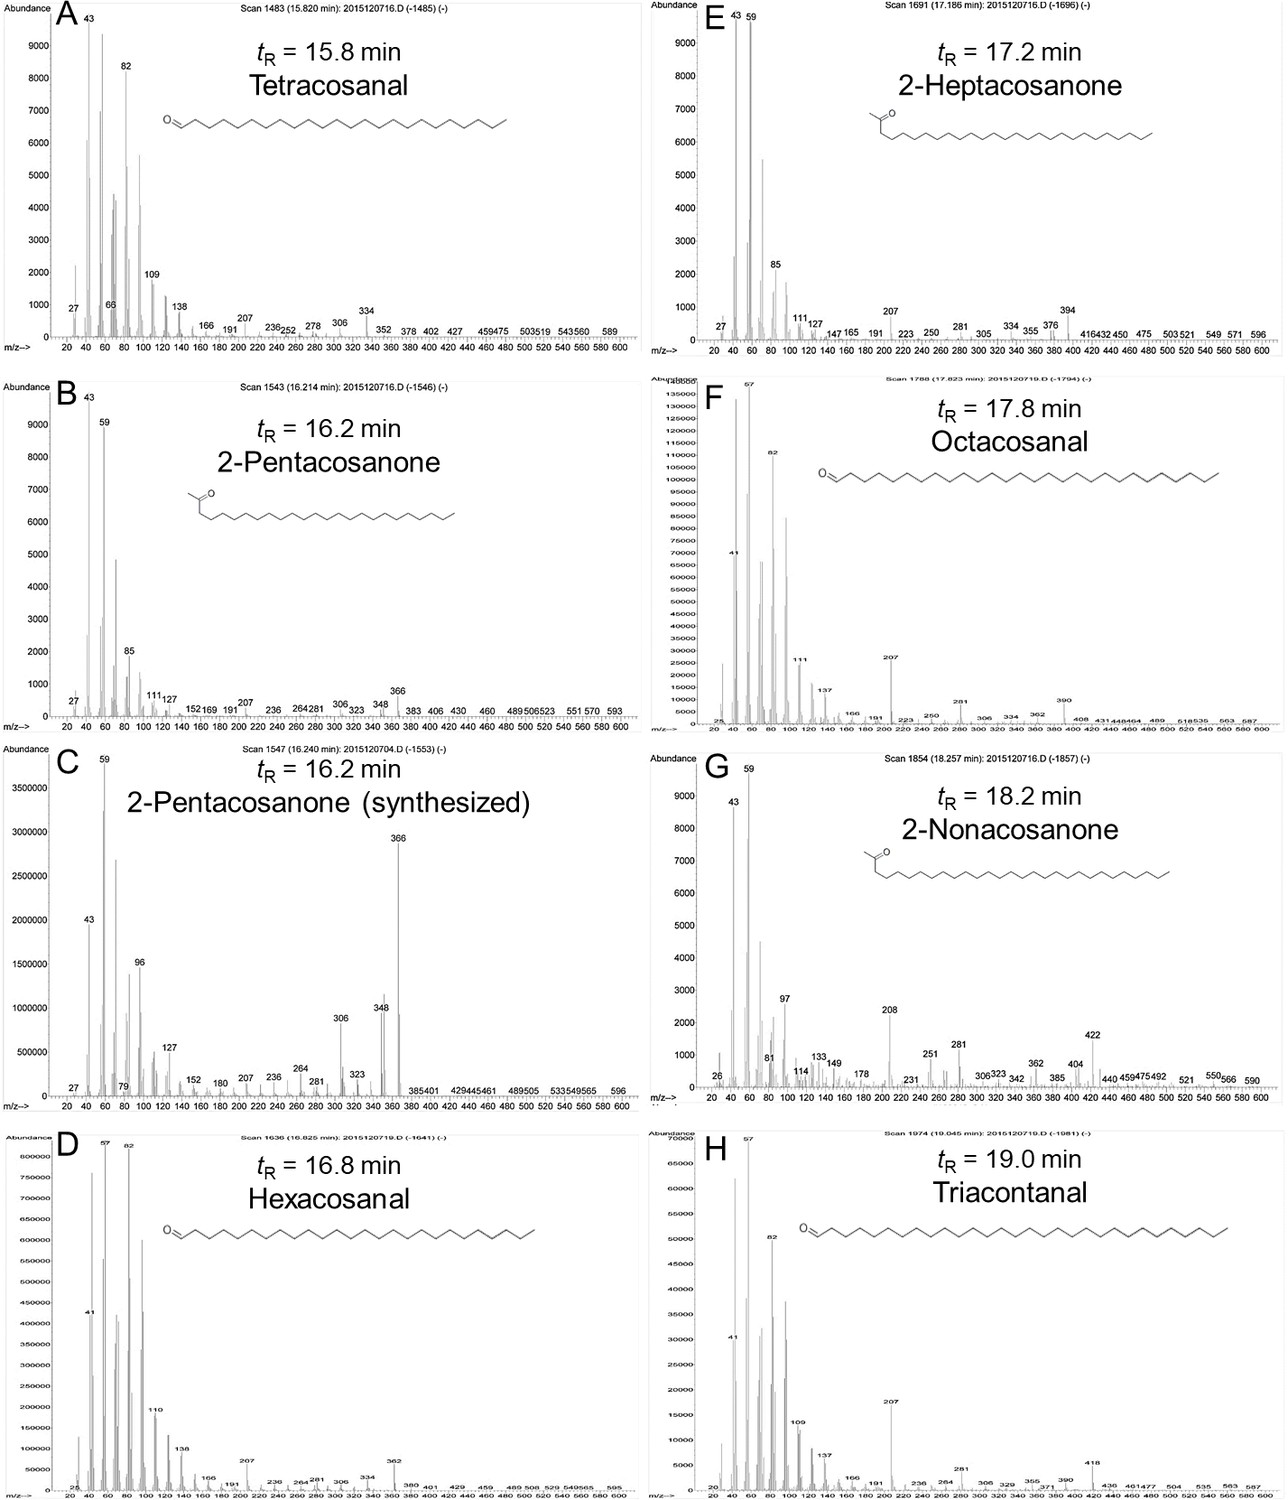
Mass spectra and extracted ion chromatogram of dragonfly wax
(A, B, D–H) and of synthetic 2-pentacosanone (C).
Figure 6
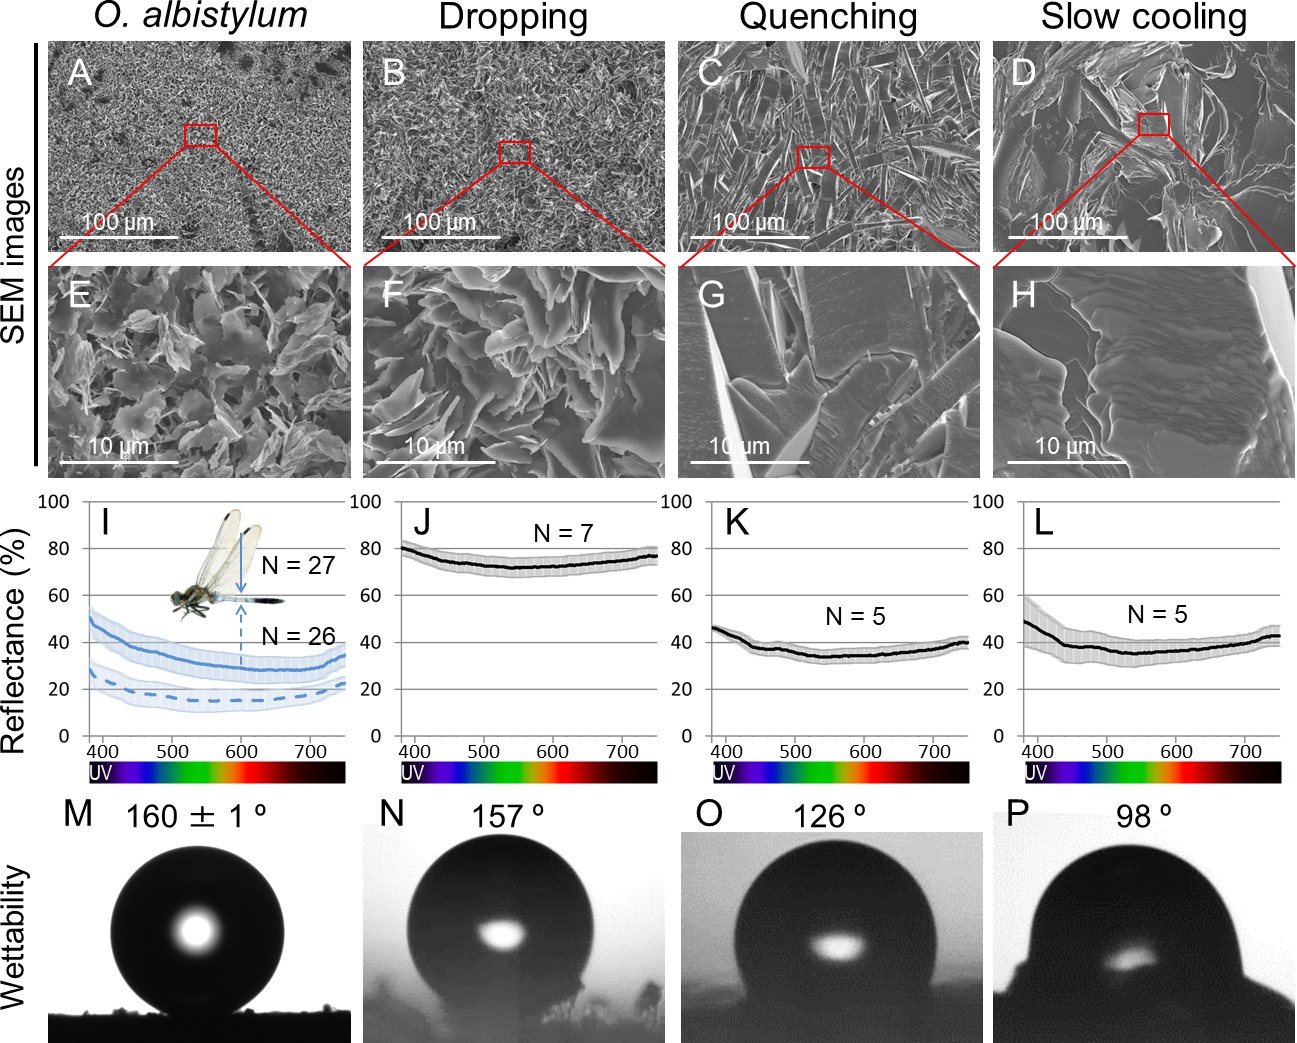
Comparison of surface fine structure, reflectance, and wettability between the dorsal abdomen of mature males of O. albistylum and synthetic 2- pentacosanone crystallized on glass plates using three different cooling processes.
(A–H) Scanning electron microscope images. Panels E, F, G and H are magnified images of panels A, B, C and D, respectively, as indicated by red rectangles. (I–L) Micro-spectrometry from a 10 µm x 10 µm area. (M–P) Wettability measured with a 1 nL water droplet. (A, E, I, M) The dorsal abdomen of mature males of O. albistylum. (B, F, J, N) Synthetic wax crystallized by the dropping method. (C, G, K, O) Synthetic wax crystallized by the quenching method. (D, H, L, P) Synthetic wax crystallized by the slow-cooling method.
-
Figure 6—source data 1
Micro-spectrometry of synthetic 2-pentacosanone crystallized on glass plates using three different cooling processes.
- https://doi.org/10.7554/eLife.43045.020
Figure 7 with 1 supplement
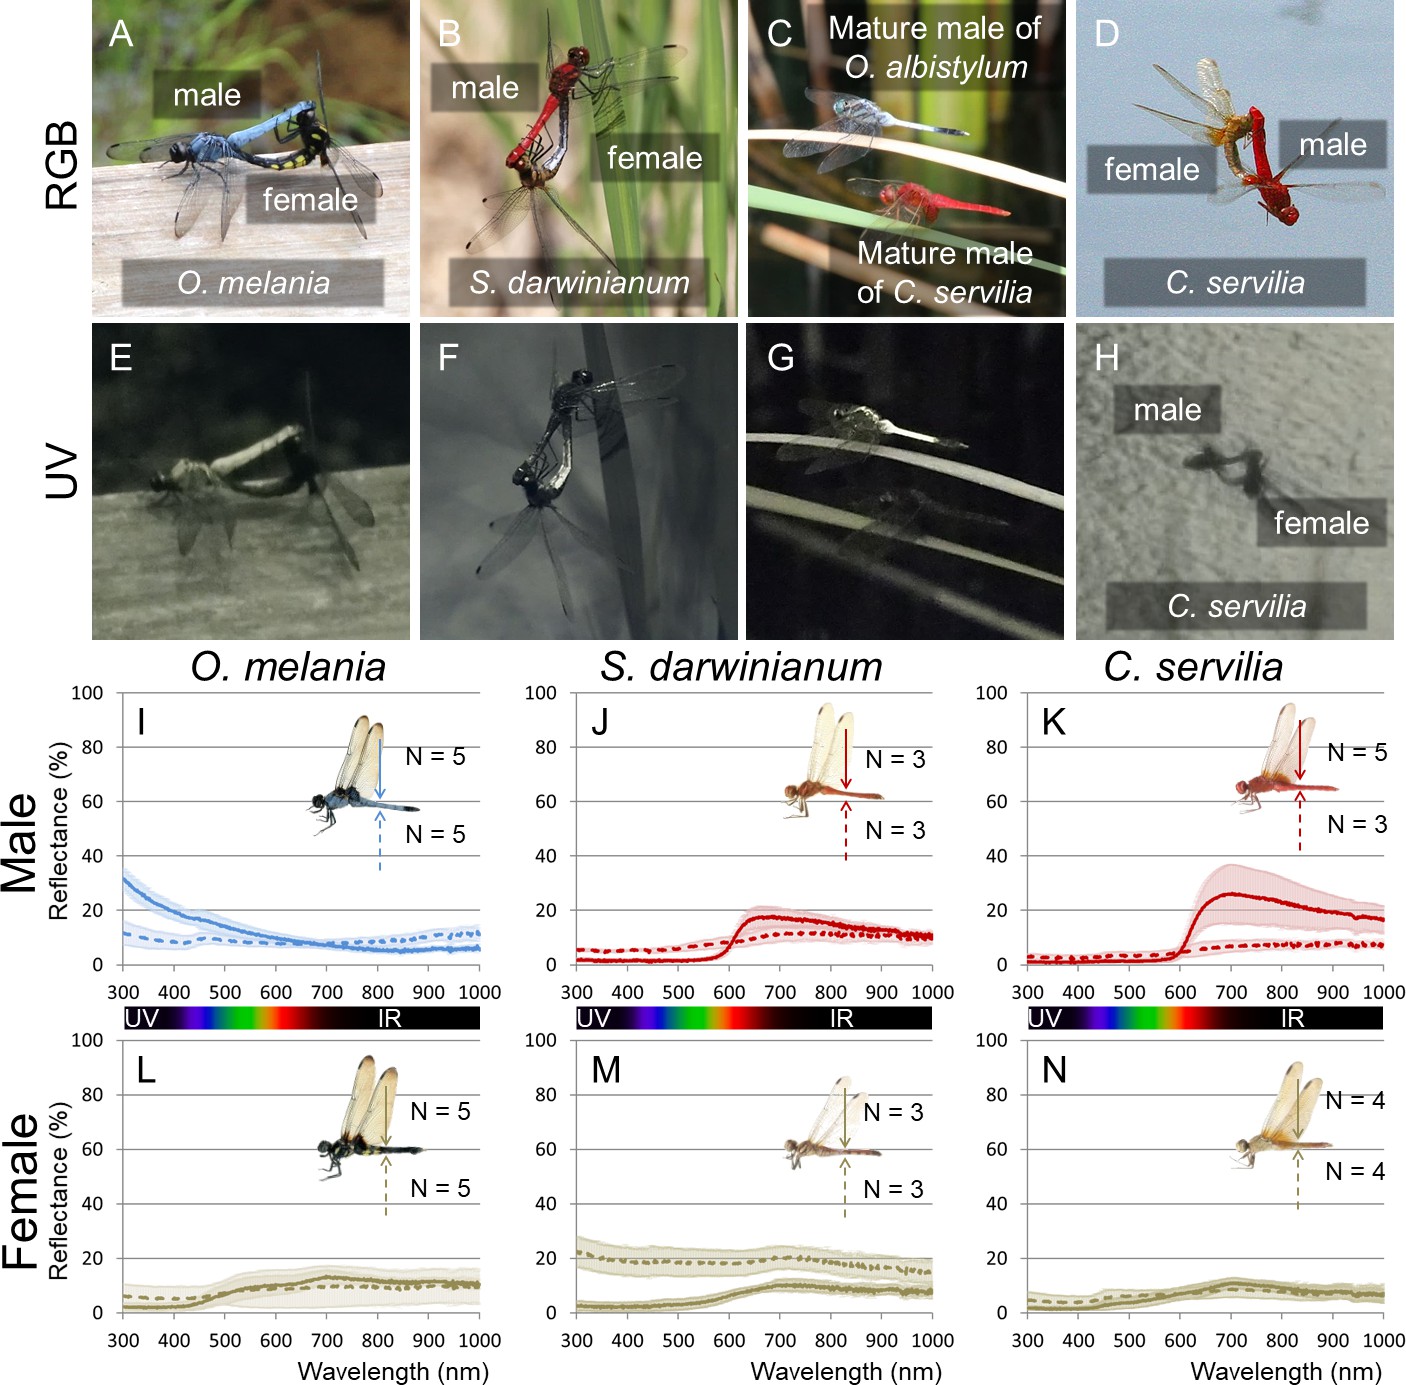
UV reflection patterns in O. melania, S. darwinianum and C. servilia.
(A, E) Mating pair of O. melania. (B, F) Mating pair of S. darwinianum. (C, G) Mature male of C. servilia with mature male of O. albistylum. (D, H) Mating pair of C. servilia. Each image photographed normally (RGB) (A–D) or through a UV filter (E–H) in the field. (I–N) Spectrometry of a round area (6 mm in diameter) on the 5th abdominal segment of O. melania (I, L), S. darwinianum (J, M), and C. servilia (K, N). (I–K) Male. (L–N) Female. Solid and dotted lines indicate averaged UV reflectance on the dorsal and ventral sides of the abdomen, respectively. The standard deviation is shaded.
-
Figure 7—source data 1
Spectrometry of a round area (6 mm in diameter) of O. melania.
- https://doi.org/10.7554/eLife.43045.023
-
Figure 7—source data 2
Spectrometry of a round area (6 mm in diameter) of S. darwinianum.
- https://doi.org/10.7554/eLife.43045.024
-
Figure 7—source data 3
Spectrometry of a round area (6 mm in diameter) of C. servilia.
- https://doi.org/10.7554/eLife.43045.025
-
Figure 7—source data 4
Micro-spectrometry of O. melania.
- https://doi.org/10.7554/eLife.43045.026
-
Figure 7—source data 5
Micro-spectrometry of S. darwinianum.
- https://doi.org/10.7554/eLife.43045.027
-
Figure 7—source data 6
Micro-spectrometry of C. servilia.
- https://doi.org/10.7554/eLife.43045.028
Figure 7—figure supplement 1
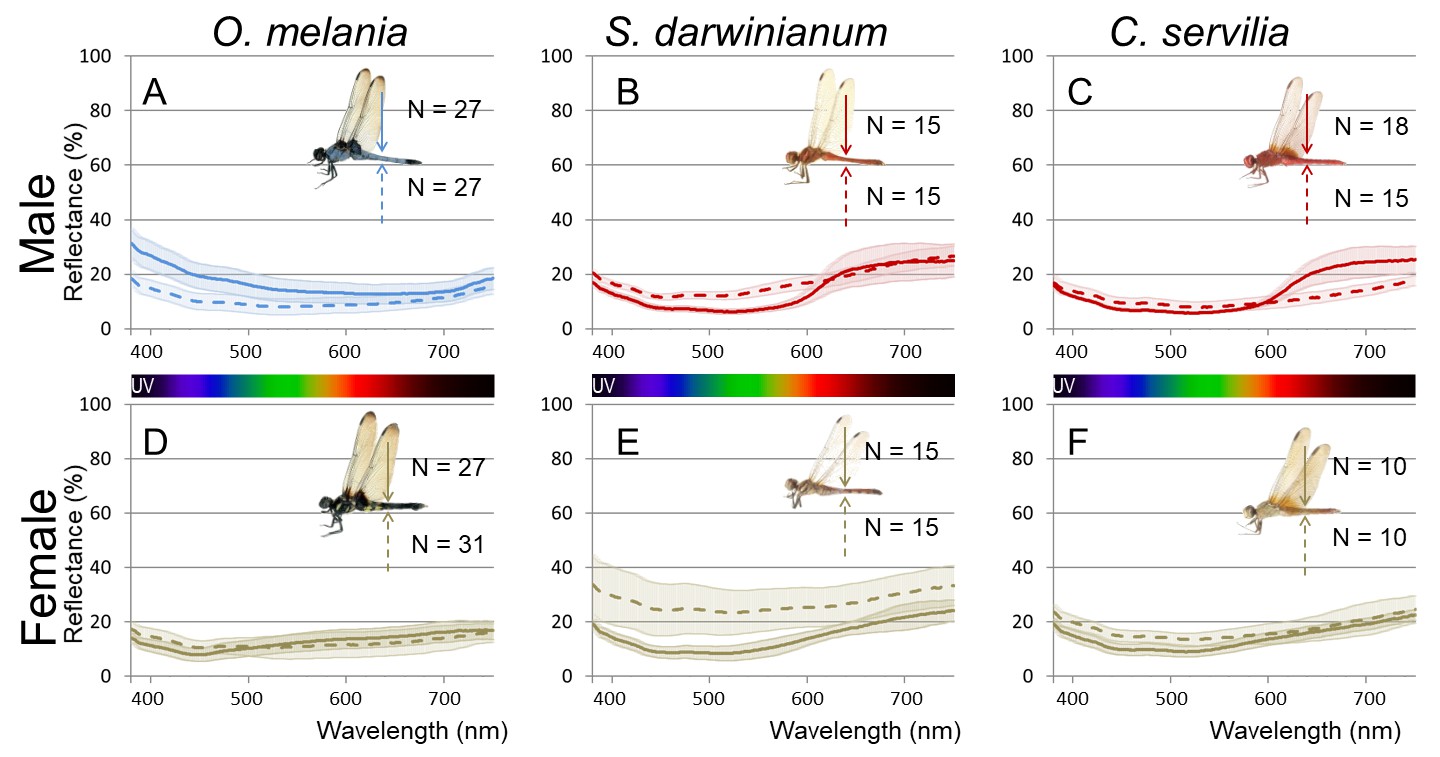
Micro-spectrometry (of a 10 × 10 µm micro-area) of O. melania (A, D), S. darwinianum (B, E), and C. servilia (C, F).
(A–C) Male. (D–F) Female. Five to ten micro-areas were measured for each individual.
Figure 8
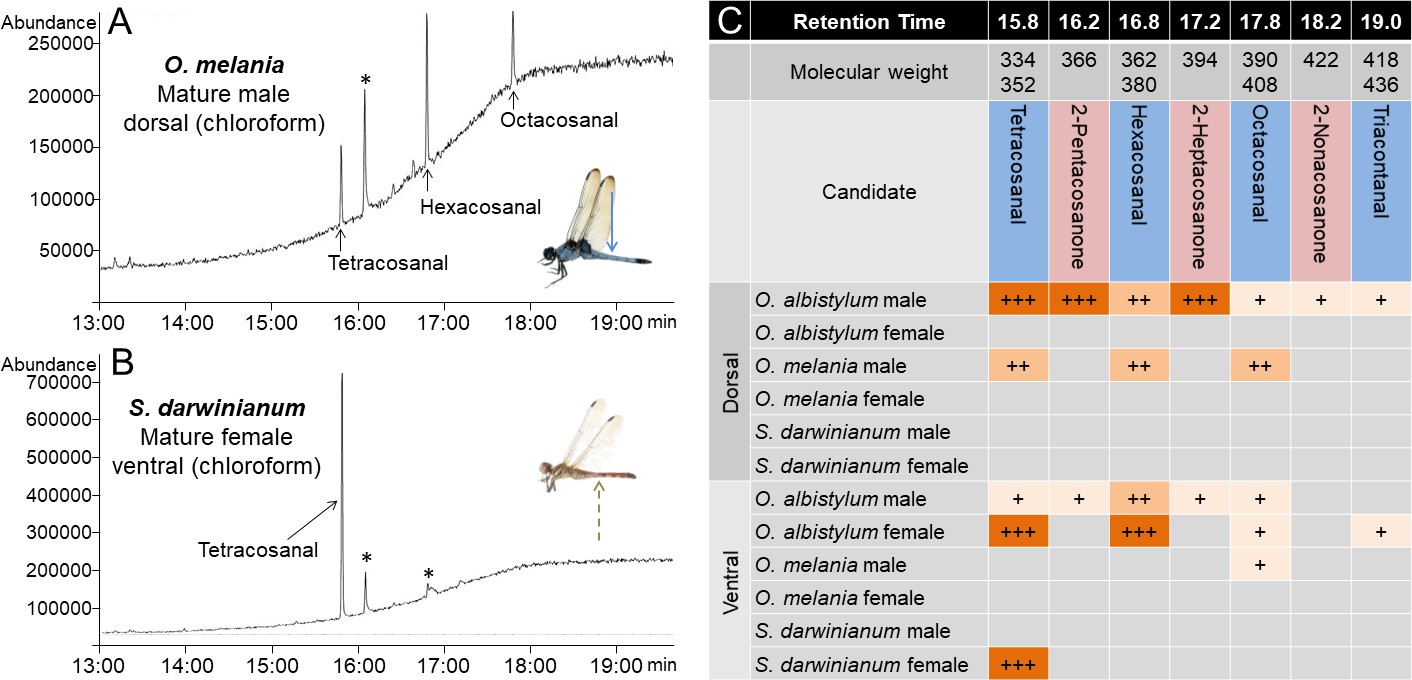
Comparison of wax components on the dorsal and ventral abdomen of O. albistylum, O. melania and S. darwinianum.
(A) Chromatogram of chloroform extract from the dorsal abdomen of a mature male of O. melania. (B) Chromatogram of chloroform extract from the ventral abdomen of a mature female of S. darwinianum. Asterisks indicate nonspecific peaks also detected with the solvent only. (C) Summary of wax components detected from O. albistylum, O. melania and S. darwinianum. Relative amount was judged from the abundance of total ion current. +++, high amount; ++, moderate amount; +, small amount.
Figure 9
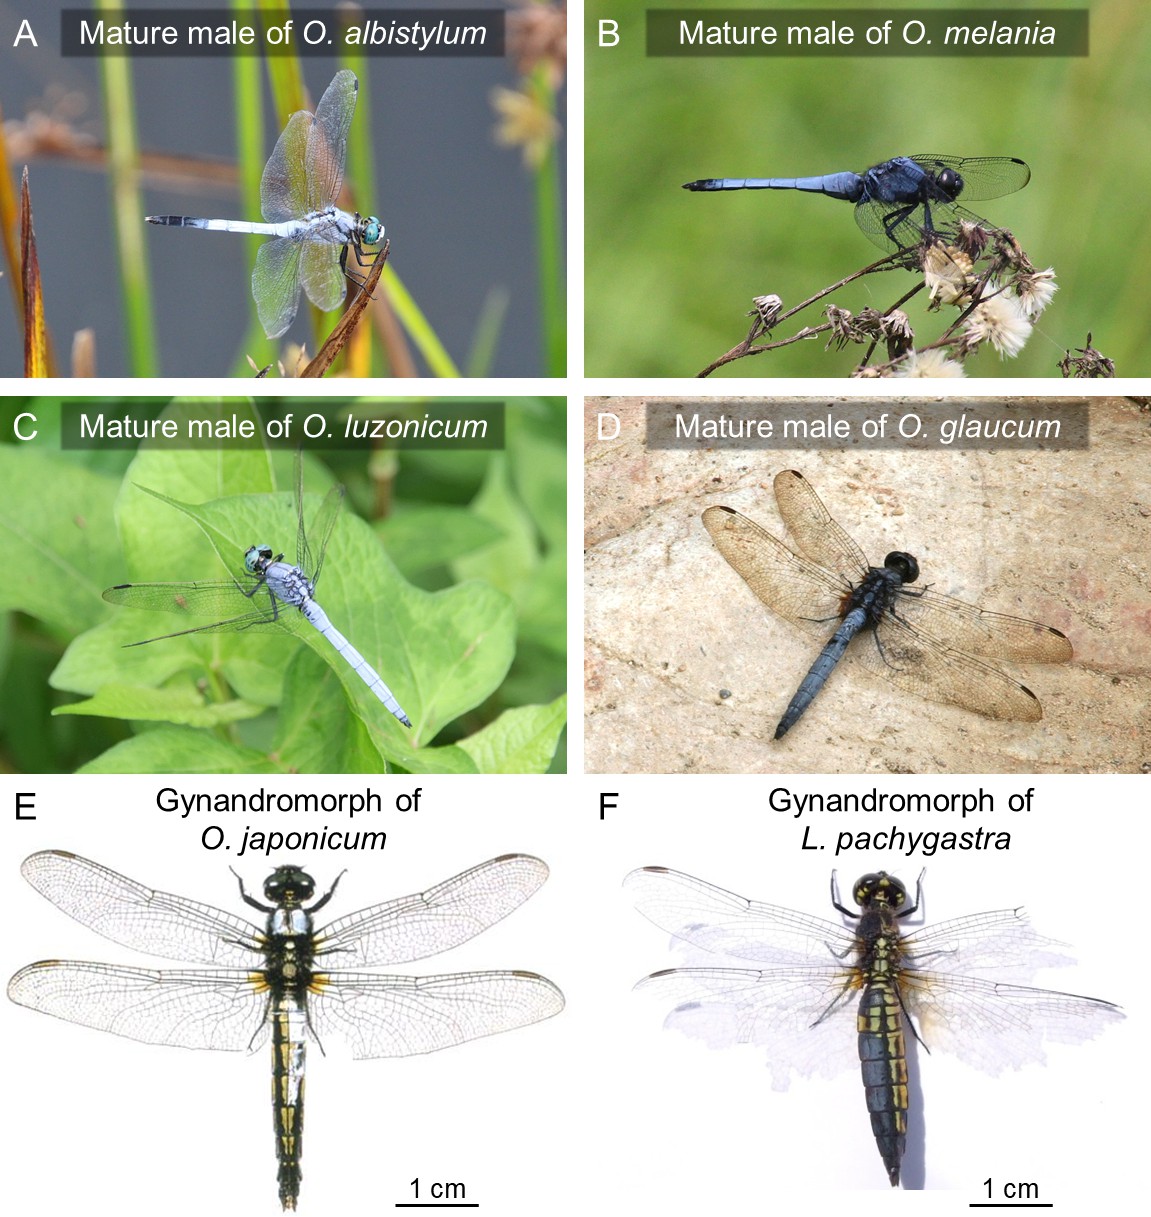
Surface wax of Orthetrum species and allied dragonflies.
(A–D) Mature males of O. albistylum (A), O. melania (B), O. luzonicum (C) and O. glaucum (D). (E–F) Gynandromorphic individuals of O. japonimum (E) and Lyriothemis pachygastra (F). Photos courtesy of Mitsutoshi Sugimura (E) and Makoto Machida (F).
Figure 10 with 1 supplement
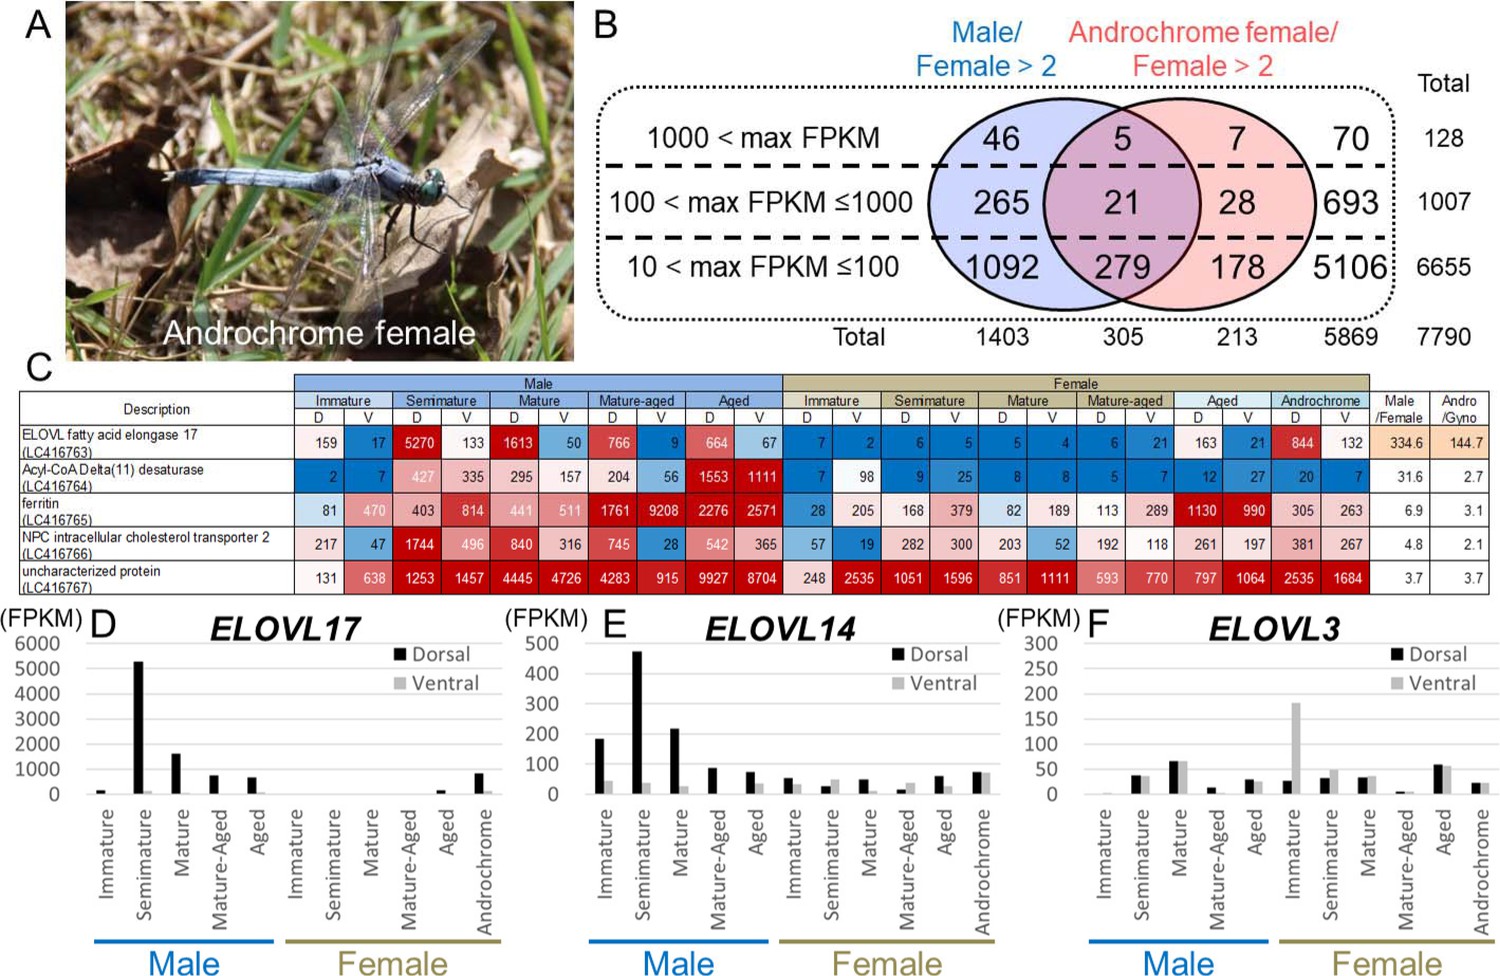
Genes associated with UV reflective wax.
(A) An androchrome female used for transcriptome analysis. (B) The number of genes that were upregulated in the dorsal abdominal epidermis of males and/or an androchrome female compared to normal females. (C) The list of genes upregulated in the dorsal abdominal epidermis of both males and an androchrome female (max FPKM >1000). Gene expression levels are displayed as a heat map. The numbers indicate FPKM values. Red and blue fills indicate high and low expression levels, respectively. D and V indicate the dorsal and ventral abdominal regions, respectively. (D–F) Expression level of three elongation of very long-chain fatty acids (ELOVL) genes in the dorsal and ventral parts of the epidermis of O. albistylum.
Figure 10—figure supplement 1
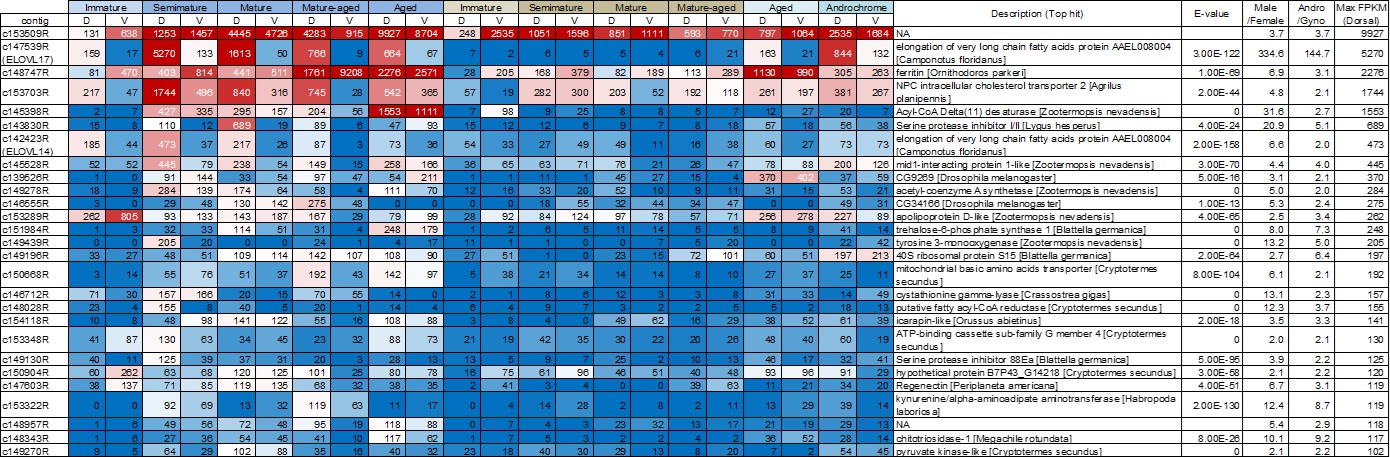
List of genes that are upregulated in the dorsal abdominal epidermis of both males and an androchrome female (max FPKM >100).
Gene expression levels are displayed as a heat map. The numbers indicate FPKM values. Red and blue fills indicate high and low expression levels, respectively. D and V indicate the dorsal and ventral abdominal regions, respectively. Andro and Gyno mean androchrome and normal (gynochrome) females, respectively.
Figure 11
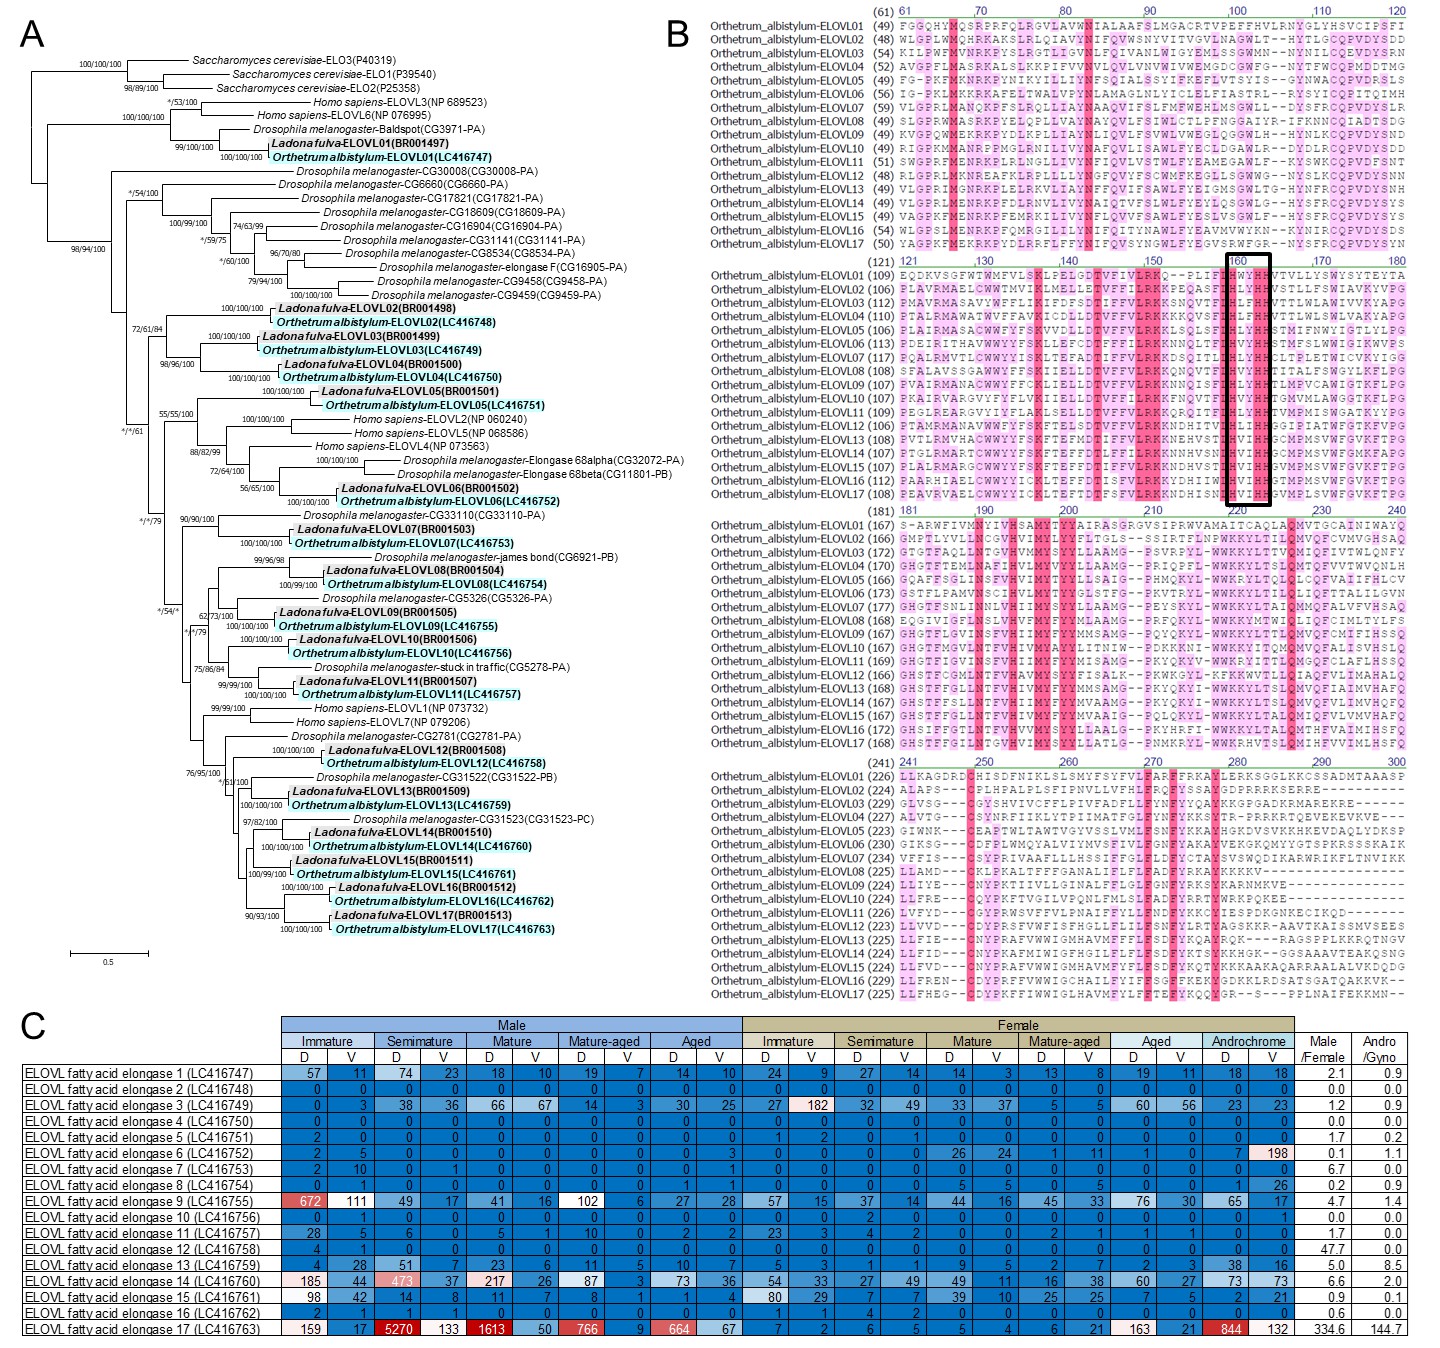
Identification of 17 ELOVL genes in dragonflies.
(A) Phylogenetic tree of ELOVL family genes produced on the basis of their amino-acid sequences. A maximum likelihood phylogeny is shown, but neighbor-joining and Bayesian phylogenies exhibit substantially the same topologies. Statistical supporting values are indicated for each node (shown as (bootstrap value of neighbor-joining)/(bootstrap value of maximum likelihood)/(posterior probability of Bayesian)). Asterisks indicate support values < 50%. Blue and gray shading indicates O. albistylum and L. fulva genes, respectively. Accession numbers or annotation identities are shown in parentheses. (B) Alignment of 17 ELOVL genes of O. albistylum. The conserved histidine motif is boxed. (C) Gene expression levels of 17 ELOVL genes in O. albistylum. The numbers indicate FPKM values. Red and blue shading indicates high and low expression levels, respectively. D and V indicate the dorsal and ventral abdominal regions, respectively.
Videos
Video 1
Movie of visible light and UV reflection of O. albistylum in the field.
https://doi.org/10.7554/eLife.43045.013
Video 2
Reversible color change by adding acetone.
https://doi.org/10.7554/eLife.43045.015
Video 3
Movie of visible light and UV reflection of O. melania, S. darwinianum, and C. servilia in the field.
https://doi.org/10.7554/eLife.43045.030Additional files
-
Supplementary file 1
Orthetrum albistylum samples and RNA sequencing reads.
- https://doi.org/10.7554/eLife.43045.035
-
Transparent reporting form
- https://doi.org/10.7554/eLife.43045.036
Download links
A two-part list of links to download the article, or parts of the article, in various formats.
Downloads (link to download the article as PDF)
Open citations (links to open the citations from this article in various online reference manager services)
Cite this article (links to download the citations from this article in formats compatible with various reference manager tools)
Molecular basis of wax-based color change and UV reflection in dragonflies
eLife 8:e43045.
https://doi.org/10.7554/eLife.43045


